


Summary
African admixture in Europe refers to the presence of human genotypes attributable to periods of human population dispersals out of Africa in the genetic history of Europe. For example, certain Y-DNA and mtDNA lineages are thought to have spread from Northeastern Africa to the Near East during the later Pleistocene, and from there to Europe with the Neolithic Revolution.[1][2]
More recent African admixture – primarily Berber admixture from North Africa – is associated with historic migrations through the Mediterranean Sea and the Muslim conquests of the Early Middle Ages. This admixture can be found primarily in the Iberian peninsula (modern day Spain and Portugal), with higher levels in the West and the South[3][4][5] and Southern Italy, with higher levels in Sardinia and Sicily.[6]
Neolithic edit
The change from hunting and gathering to agriculture during the Neolithic Revolution was a watershed in world history. The societies that first made the change to agriculture are believed to have lived in Western Asia and Asia Minor around 10,000 BCE. Agriculture was introduced into Europe and North Africa by migrating farmers from West Asia.[7] According to the demic diffusion model, these Middle Eastern farmers either replaced or interbred with the local hunter-gather populations that had been living in Europe since the Out of Africa migration.[8]
It has been suggested that the first Middle Eastern farmers reflected North African influences or vice versa.[9] There have been suggestions that some genetic lineages found in the Middle East arrived there during this period.[10] The first agricultural societies in the Middle East are generally thought to have emerged after, and perhaps from, the Natufian culture between 12,000 and 10,000 BCE. The latter group was widely semi-sedentary even before the introduction of agriculture. An important migration from North Africa across the Sinai also appears to have occurred before the formation of the Natufian.[citation needed].
Historical period edit
In historical times, there has been a period of north African influence in southern Europe, especially in the Iberia and parts of southern Italy (namely Sicily), during various Muslim conquests. The genetic effect of this period on modern European populations is the subject of discussion (see below). In more recent history, the peoples of Europe and Africa came into contact during the exploration and colonization of Africa and as a consequence of the Atlantic slave trade.[2]
Admixture edit
- Hernandez et al. (2020) identified 11.17 ± 1.87% North African ancestry in southern Portuguese samples (from a population similar to modern northern Moroccans and Algerians), 9.28 ± 1.79% of such ancestry in western Andalusians, and an average of 1.41 ± 0.72% sub-Saharan ancestry in southern Iberians (using Yoruba as a proxy source). Substantially lower levels of North African admixture were further detected in Northern Italians (0.77%) and Tuscans (1%). [11]
- Olalde et al. (2019) found evidence for 'sporadic contacts' between Iberia and North Africa in the Copper Age and Bronze Age. A male sample from central Iberia, dating from 2473–2030 cal BCE, was found to cluster with modern and ancient North Africans, characterised by ancestry from both Late Pleistocene North Africans and Early Neolithic Europeans. Another Bronze Age sample had 25% such North African ancestry. However, North African ancestry only became widespread in Iberia in the past ~2000 years, associated with the Roman Empire or earlier Punic presence and the later period of Muslim rule. The study analysed 45 samples from southeastern Spain dating from the 3rd-16th centuries CE, all of which fell outside the genetic variation of preceding Iberian Iron Age populations, harbouring ancestry from both southern European and North African populations, as well as additional Levantine-related ancestry. 2 samples out of 23 dating from the 10th to 16th centuries were also found to have partial sub-Saharan ancestry, which was not identified in earlier samples. Present-day southern Iberians harbour less African ancestry than Muslim period samples, likely due to subsequent population expulsions and repopulation from the north, as supported by historical sources and genetic analysis of present-day groups.[4]
- Bycroft et al. (2019) identified regionally varying fractions of Northwest African ancestry in modern Iberians, ranging from 0–12%. This ancestry was found to be from a source population similar to modern Northwest Africans. The admixture was dated to 860–1120 CE, associated with the Muslim conquest and subsequent Reconquista. The highest levels of Northwest African admixture were identified in western Iberia whilst the lowest levels were found in the Basque region and an area in the North East roughly corresponding to the 14th-century Crown of Aragon. They also found some evidence for a second admixture event in Portuguese and Southern Spanish groups involving a second North African population within which a small sub-Saharan African component was detected.This admixture event was dated to approximately 1300 CE.[5]
- Botigué et al. (2013) analysed genome-wide SNP data from over 2,000 modern individuals from Iberia. They estimated an average of 4% to 12% Northwest African admixture in modern Iberians (with low or zero levels in Basques), whereas populations in southeastern Europe had less than 2% of such admixture. Sub-Saharan African ancestry was detected at less than 1% in Europe, with the exception of the Canary Islands.[12][13]
- Moorjani et al. (2011) estimated that some Southern Europeans have inherited 1%–3% sub-Saharan ancestry (approximately 3.2% in Portugal, 2.9% in Sardinia, 2.7% in southern Italy, 2.4% in Spain and 1.1% in northern Italy), although the percentages were lower (ranging from 0.2% in Sardinia and northern Italy to 2.1% in Portugal) when reanalyzed with the 'STRUCTURE' statistical model. An average mixture date of around 55 generations/1100 years ago was given, "consistent with North African gene flow at the end of the Roman Empire and subsequent Arab migrations". This admixture was not identified in Northern Europeans.[14]
- Pino-Yanes et al. (2011) found that from an autosomal analysis, the average Northwest African influence is about 17% in Canary Islanders, with a wide interindividual variation ranging from 0% to 96%. The substantial Northwest African ancestry found for Canary Islanders supports the idea that, despite the aggressive conquest by the Spanish in the 15th century and the subsequent immigration, genetic footprints of the first settlers of the Canary Islands persist in the current inhabitants. Paralleling mtDNA findings, the largest average Northwest African contribution was found for the samples from La Gomera.[15]
- Auton et al. (2009) found that South West Europe had the highest proportion in Europe of haplotypes that are shared with sub-Saharan Africa (represented by Yoruba), and significantly more relative to South East Europe.[16]
Sexual Chromosomes edit
Generally, markers and lineages used to characterize African admixture are those that are believed to be specific to Africa. There are also DNA polymorphisms that are shared between populations native to Europe, West Asia, North Africa and the Horn of Africa, such as the y-chromosomal haplogroup E1b1b and the mitochondrial haplogroup M1.[2]
With regard to the paternal haplogroup E1b1b and maternal haplogroup M1, derivatives of these clades have been observed in prehistoric human fossils excavated at the Ifri n'Amr or Moussa site in Morocco, which have been radiocarbon-dated to the Early Neolithic period (ca. 5,000 BC). Ancient DNA analysis of these specimens indicates that they carried paternal haplotypes related to the E1b1b1b1a (E-M81) subclade and the maternal haplogroups U6a and M1, all of which are frequent among present-day communities in the Maghreb. These ancient individuals also bore an autochthonous Maghrebi genomic component that peaks among modern Berbers, indicating that they were ancestral to populations in the area. Additionally, fossils excavated at the Kelif el Boroud site near Rabat were found to carry the broadly-distributed paternal haplogroup T-M184 as well as the maternal haplogroups K1, T2 and X2, the latter of which were common mtDNA lineages in Neolithic Europe and Anatolia. These ancient individuals likewise bore the Berber-associated Maghrebi genomic component. This altogether indicates that the Late Neolithic Kelif el Boroud inhabitants were ancestral to contemporary populations in the area, but also likely experienced gene flow from Europe.[17]
Other lineages that are now found in Africa and Europe may have a common origin in Asia (e.g. Y haplogroups R1, and some paternal haplogroup T and U subclades). One subclade of haplogroup U, namely U6a1, is known to have expanded from northern and eastern Africa back into Europe[18][19] even though haplogroup U6 is considered to have originated in the Middle East. Other lineages are known to have moved from Europe directly into Africa, for example mitochondrial haplogroups H1 and H3.[20] Such bidirectional migrations between Africa and Eurasia complicate the task of defining admixture.
Y-DNA edit
One proposed example of Holocene gene flow from North Africa to Europe, via the Middle East, is thought to be E1b1b, which is thought to have emerged about 40,000 years ago in the Horn of Africa, and branches of it are thought to have migrated to the Middle East by 14,000 years ago during the late Pleistocene period.[21][10][22]
Entering the late mesolithic Natufian culture, the E1b1b1a2 (E-V13) subclade has been associated with the spread of farming from the Middle East into Europe either during or just before the Neolithic transition. E1b1b1 lineages are found throughout Europe but are distributed along a south-to-north cline, with an E1b1b1a mode in the Balkans.[1][23][24][a][b]
In separate migrations, E lineages in the form of the E1b1b1b subclade appear to have entered Europe from Northwest Africa into Iberia. In a sample of European males, haplogroup E was observed at a frequency of 7.2%.[1] The timing of this movement has been given widely varying estimates.[25] In much of Europe, frequencies of E lineages are very low, usually less than 1%. For example, the frequency of such lineages are at 2% in southern Portugal, 4% in northern Portugal, 2.9% in Istanbul, and 4.3% among Turkish Cypriots.[1] E1b1a is closely related to E1b1b, the most frequent clade in Europe. E lineages that are not E1b1a or E1b1b could therefore reflect either a recent expansion associated with E1b1a or ancient population movements associated with E1b1b. For example, haplogroup E1a lineages have been detected in Portugal (5/553 = 1%),[26] among Italians in Calabria (1/80=1.3%), and among Albanians in Calabria (2/68=2.9%).[23] The distribution of haplogroup E1a lineages in Portugal was independent of the distribution of the younger and more ubiquitous E1b1a.[26] this distribution is consistent with a prehistoric migration from Africa to Iberia, possibly alongside mtDNA haplogroup U6. In Majorcans, Sub-Saharan Y-DNA lineage E-V38 was found at a total of 3.2% (2/62).[27] Sub-Saharan Y-DNA lineages E3a, E1, BC*, (xE3), and E3* are found between 1 and 5% in Portugal, Valencia, Majorca, Cantabria, Málaga, Seville, and Galicia (Spain).[27][28] In Sardinians, Sub-Saharan Y-DNA lineages A1b1b2b and E1a1 were found at a total of 1.0% (A1b1b2b 0.5% / E1a1 0.5%).[29]
Haplogroups A and B are thought to have been the predominant haplogroups in central and southern Africa prior to the Bantu Expansion. Currently these haplogroups are less common than E lineages. In a sample of 5,000 African men, haplogroup A had a frequency of 5%. Haplogroup A has rare occurrences in Europe, but recently the haplogroup was detected in seven indigenous British males with the same Yorkshire surname.[30]

The subclade E3b1 (probably originating in northeastern Africa) has a wide distribution in North Africa, the Horn of Africa, the Middle East, and Europe. This haplogroup, in Italy, is represented by E-M78, E-M123 and E-M81 (Figure 3)[31] and reaches a frequency of 8% in northern and central Italy and slightly higher, 11%, in the south of that country.[31]
It has also been argued that the European distribution of E3b1 is compatible with the Neolithic demic diffusion of agriculture; thus, two subclades—E3b1a-M78 and E3b1c-M123—present a higher occurrence in Anatolia, the Balkans, and the Italian peninsula. Another subclade, E3b1b-M81 is associated with Berber populations and is commonly found in regions that have had historical gene flow with northern Africa, such as the Iberian Peninsula, the Canary Islands, and Sicily.[31]
North African Y-DNA E-M81 was found at a total of 41.1% among "pasiegos" from Cantabria, Spain. That is the highest frequency observed in Europe to date.[1] Estimates of Y-Chromosome ancestry vary. Using 1140 samples from throughout the Iberian peninsula, giving a proportion of 10.6% North African ancestry to the paternal composite of Iberians.[27][32] From an analysis of the Y-chromosome with 659 samples from Southern Portugal, 680 from Northern Spain, 37 samples from Andalusia, 915 samples from mainland Italy, and 93 samples from Sicily found significantly higher levels of North African male ancestry in Portugal, Spain and Sicily (7.1%, 7.7% and 7.5% respectively) than in peninsular Italy (1.7%).[33] Considering both some E-M78 subhaplogroups and the E-M81 haplogroup, the contribution of northern African lineages to the entire male gene pool of Iberia (barring Pasiegos), continental Italy, and Sicily can be estimated as 5.6%, 3.6%, and 6.6%, respectively.[34] Y-DNA lineages E-V12 and E-V22 have been associated with a Levantine source (represented by modern Lebanese), while North African haplogroup E-M81 shows an average frequency of 1.53% in the current Sicilian and Southern Italian genetic pool, but the typical Maghrebin core haplotype 13-14-30-24-9-11-13 has been found in only two out of the five E-M81 individuals.[35] These results, along with the negligible contribution from North-African populations revealed by the admixture-like plot analysis, suggest only a marginal impact of trans-Mediterranean gene flows on the current Sicilian and Southern Italian genetic pool.[35]
mtDNA edit
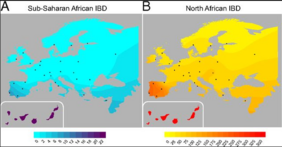
Haplogroup L lineages are relatively infrequent (1% or less) throughout Europe with the exception of Iberia (Spain and Portugal), where frequencies as high as 22% have been reported, and some regions of Southern Italy, where frequencies as high as 2% and 3% have been found. About 65% of the European L lineages most likely arrived in rather recent historical times (Romanization period, Arab conquest of the Iberian Peninsula and Sicily, Atlantic slave trade) and about 35% of L mtDNAs form European-specific subclades, revealing that there was gene flow from Sub-Saharan Africa toward Europe as early as 11,000 years ago.[36]
| Map (in the link) showing the distribution of Sub-Saharan mtDNA (shown in red) in Europe Map is From Cerezo et al. 2012[36] Universidad de Santiago de Compostela Iberia (Spain & Portugal) having the highest amount and strongest concentration of Sub-Saharan mtDNA in Europe. |
In Iberia the mean frequency of haplogroup L lineages reaches 3.83%; the frequency is higher in Portugal (5.83%) than in Spain (2.9% average), and without parallel in the rest of Europe. In both countries, frequencies vary widely between regions, but with increased frequencies observed for Madeira (insular Portugal), southern Portugal, Córdoba (southern Spain), Huelva (southern Spain), Canary Islands (insular Spain), Extremadura (western Spain) and Leon (western Spain).[37] In the Autonomous regions of Portugal (i.e. Madeira and the Azores), L haplogroups constituted about 13% of the lineages in Madeira, significantly more than in the Azores.[38] In the Canary Islands, frequencies have been reported at 6.6%.[38] Regarding Iberia, current debates are concerned with whether these lineages are associated with prehistoric migrations, the Islamic occupation of Iberia, or the slave trade. African lineages in Iberia were predominantly the result of the Atlantic slave trade.[39] Most of the L lineages in Iberia matched Northwest African L lineages rather than contemporary Sub-Saharan L lineages.[40] This pattern indicates that most of the Sub-Saharan L lineages entered Iberia in prehistoric times rather than during the slave trade. According to Sub-Saharan lineages found in Iberia matched lineages from diverse regions in Africa.[37] This pattern is more compatible with a recent arrival of these lineages after slave trading began in the 15th century.[40] Alternative scenarios that invoke much older and demographically more significant introductions have been proposed[40] or a substantial role of the Roman and/or Islamic periods on the introduction of Sub-Saharan lineages seem unlikely. Extracted DNA from human remains that were exhumed from old burial sites in Al-Andalus, Spain, The remains date to between the 12th and 13th centuries.[41] The frequency of Sub-Saharan lineages detected in the medieval samples was 14.6% and 8.3% in the present population of Priego de Cordoba. The Muslim occupation and prehistoric migrations before the Muslim occupation would have been the source of these lineages. The highest frequencies of Sub-Saharan lineages found so far in Europe were observed in the comarca of Sayago (18.2%) which is "comparable to that described for the South of Portugal".[42]
In Italy, haplogroup L lineages are present at lower frequencies than in Iberia and are detected only in certain regions: Latium, Volterra,[43] Basilicata, and Sicily.[44]
In eastern Europe, haplogroup L lineages are present at very low frequencies. Though a high diversity of African mtDNA lineages have been detected, few lineages have accumulated enough mutations in Europe to form monophyletic clusters.[2] The monophyletic clusters L1b and L3b have an estimated age no greater than 6,500 years. African L1b, L2a, L3b, L3d and M1 clades in Slavic populations have been identified at low frequencies.[45] L1b, L3b and L3d had matches with West African populations, indicating that these lineages probably entered Europe through Iberia. One lineage, L2a1a, found in Czechs and Slovaks, appeared to be much older, indicating that it may have entered Europe in prehistoric times.[45] This clade is distinct from the branch of L2a1 called L2a1l2a that is found in individuals of Ashkenazi heritage from central and eastern Europe[46] and less frequently in non-Jewish Poles.[47] L2a lineages are widespread throughout Africa; as a result, the origins of this lineage are uncertain.[48]
Haplogroup M1 is also found in Europe at low frequencies. Haplogroup M1 had a frequency of 0.3%.[19] The origins of haplogroup M1 have yet to be conclusively established.
A prehistoric episode is likely to be the main contributor to the sub-Saharan presence in Mediterranean Europe.[49]
Frequencies of haplogroup L lineages edit
| Country | Region | Number tested | Study | % |
|---|---|---|---|---|
| Europe | Continent-wide (excl. Tuscany) | 10,589 | Achilli et al. (2007)[43] | 0.79% |
| South Iberia | Spain & Portugal | 310 | Casas et al. (2006)[41] | 7.40% |
| Spain | Countrywide | 312 | Álvarez et al. (2007)[50] | 2.90% |
| Spain | Central Spain | 50 | Plaza et al. (2003)[51] | 4.00% |
| Spain | North-West Spain | 216 | Achilli et al. (2007)[43] | 3.70% |
| Spain | Basque Country | 156 | Achilli et al. (2007)[43] | 0.64% |
| Spain | Galicia | 92 | Pereira et al. (2005)[37] | 3.30% |
| Spain | Zamora | 214 | Álvarez et al. (2010)[42] | 4.70% |
| Spain | Sayago | 33 | Álvarez et al. (2010)[42] | 18.18% |
| Spain | Cordoba | 108 | Casas et al. (2006)[41] | 8.30% |
| Spain | Huelva | 135 | Hernandez et al. (2014) | 5.70% |
| Spain | Catalonia | 101 | Álvarez-Iglesias et al. (2009) | 2.97% |
| Spain | Balearic Islands | 231 | Picornell et al. (2005)[52] | 2.20% |
| Spain | Canary Islands | 300 | Brehm et al. (2003)[38] | 6.60% |
| Portugal | Countrywide | 594 | Achilli et al. (2007)[43] | 6.90% |
| Portugal | Countrywide | 1429 | Barral-Arca et al. (2016)[53] | 6.16% |
| Portugal | Countrywide | 549 | Pereira et al. (2005)[37] | 5.83% |
| Portugal | North | 100 | Pereira et al. (2010)[54] | 5.00% |
| Portugal | Center | 82 | Pereira et al. (2010)[54] | 9.70% |
| Portugal | Center | 82 | Plaza et al. (2003)[51] | 6.10% |
| Portugal | South | 195 | Brehm et al. (2003)[38] | 11.30% |
| Portugal | South | 303 | Achilli et al. (2007)[43] | 10.80% |
| Portugal | Coruche | 160 | Pereira et al. (2010)[54] | 8.70% |
| Portugal | Pias | 75 | Pereira et al. (2010)[54] | 3.90% |
| Portugal | Alcácer do Sal | 50 | Pereira et al. (2010)[54] | 22.00% |
| Portugal | Azores | 179 | Brehm et al. (2003)[38] | 3.40% |
| Portugal | Madeira | 155 | Brehm et al. (2003)[38] | 12.90% |
| Portugal | Madeira | 153 | Fernandes et al. (2006)[55] | 12.40% |
| Italy | Countrywide | 583 | Brisighelli et al. (2012)[31] | 1.20% |
| Italy | Countrywide | 865 | Boattini et al. (2013)[56] | 0.00% |
| Italy | Countrywide | 240 | Babalini et al. (2005)[57] | 0.40% |
| Italy | Tuscany | 322 | Achilli et al. (2007)[43] | 1.86% |
| Italy | Tuscany | 49 | Plaza et al. (2003)[51] | 2.00% |
| Italy | Volterra | 114 | Achilli et al. (2007)[43] | 2.63% |
| Italy | Latium | 138 | Achilli et al. (2007)[43] | 2.90% |
| Italy | Marche | 813 | Achilli et al. (2007)[43] | 0.98% |
| Italy | Central Italy | 83 | Plaza et al. (2003)[51] | 1.20% |
| Italy | Lombardy | 177 | Achilli et al. (2007)[43] | 0.00% |
| Italy | Piedmont | 169 | Achilli et al. (2007)[43] | 0.00% |
| Italy | Sardinia | 258 | Pardo et al. (2012)[58] | 0.40% |
| Italy | Sardinia | 73 | Plaza et al. (2003)[51] | 2.80% |
| Italy | Sardinia | 85 | Sanna et al. (2011)[59] | 0.00% |
| Italy | Sardinia (Ogliastra) | 475 | Fraumene C et al. (2003)[60] | 0.00% |
| Italy | Sardinia | 96 | Morelli et al. (1999) | 0.00% |
| Italy | Campania (South Italy) | 313 | Achilli et al. (2007)[43] | 0.32% |
| Italy | Basilicata (South Italy) | 92 | Ottoni et al. (2009)[44] | 2.20% |
| Italy | Apulia & Calabria (South Italy) | 226 | Achilli et al. (2007)[43] | 0.00% |
| Italy | Southern Italy | 115 | Sarno et al. (2014)[35] | 0.00% |
| Italy | Southern Italy | 37 | Plaza et al. (2003)[51] | 8.10%[failed verification] |
| Italy | Sicily | 106 | Cali et al. (2003) | 0.94% |
| Italy | Sicily | 105 | Achilli et al. (2007)[43] | 1.90% |
| Italy | Sicily | 169 | Plaza et al. (2003)[51] | 0.60% |
| Italy | Sicily | 198 | Sarno et al. (2014)[35] | 1.01% |
| Italy | Sicily | 465 | Romano et al. (2003)[61] | 0.65% |
| Greece | Crete | 202 | Achilli et al. (2007)[43] | 0.99% |
| Greece | Crete | 283 | Martinez et al. (2008)[62] | 0.00% |
| Greece | Macedonia | 125 | Richards et al. (2000)[63] | 0.00% |
| Greece | Countrywide | 155 | Achilli et al. (2007)[43] | 0.00% |
| Cyprus | Cyprus | 91 | Irwin et al. (2008)[64] | 3.30%[failed verification] |
| United Kingdom | England | 335 | Achilli et al. (2007)[43] | 0.60% |
| United Kingdom | Wales | 92 | Achilli et al. (2007)[43] | 0.00% |
| Finland | Countrywide | 121 | Achilli et al. (2007)[43] | 0.82% |
| Germany | Countrywide | 335 | Achilli et al. (2007)[43] | 0.30% |
| Ireland | Countrywide | 300 | Achilli et al. (2007)[43] | 0.00% |
| France | Countrywide | 332 | Achilli et al. (2007)[43] | 0.30% |
| Bulgaria | Countrywide | 141 | Achilli et al. (2007)[43] | 0.71% |
| Bosnia and Herzegovina | Countrywide | 144 | Achilli et al. (2007)[43] | 0.69% |
In an analysis which also contains an admixture data but no cluster membership coefficients, shows little to no Sub-Saharan African influence in a wide array of European samples, i.e. Albanians, Austrians, Belgians, Bosnians, Bulgarians, Croatians, Cypriots, Czechs, Danes, Finns, Frenchmen, Germans, Greeks, Hungarians, Irish, Italians, Kosovars, Lithuanians, Latvians, Macedonians, Netherlanders, Norwegians, Poles, Portuguese, Romanians, Russians, Scots, Serbians, Slovaks, Slovenians, Spaniards, Swedes, Swiss (German, French and Italian), Ukrainians, subjects of the United Kingdom, and Yugoslavians.[16]
Haplogroup U6, to which a North African origin has been attributed, is largely distributed among Mozabites (28.2%) and Mauritanians (20%).[65] In other northwest Africans, the frequency of U6 ranges from 4.2% in Tunisians to 8% in Moroccan Arabs.[51] In Europe, U6 is most common in Spain and Portugal.[66][51]
Frequencies of haplogroup U6 lineages edit
| Country | Region | Number tested | Study | % |
| Italy | Countrywide | 583 | Brisighelli et al. (2012)[31] | 0.8% |
| Italy | Mainland | 411 | Plaza et al. (2003)[51] | 0.0% |
| Italy | Countrywide | 865 | Boattini et al. (2013)[56] | 0.35% |
| Italy | Sicily | 169 | Plaza et al. (2003)[51] | 0.6% |
| Italy | Sicily | 106 | Maca-Meyer et al. (2003).[66] | 0.94% |
| Italy | Lazio | 52 | Babalini et al. (2005)[57] | 5.8% |
| Italy | Abruzzo (Molise) | 73 | Babalini et al. (2005)[57] | 0% |
| Italy | Campania | 48 | Babalini et al. (2005)[57] | 0% |
| Italy | Volterra (Tuscany) | 114 | Achilli et al. (2007)[43] | 0.00% |
| Italy | Murlo (Tuscany) | 86 | Achilli et al. (2007)[43] | 1.20% |
| Italy | Casentino (Tuscany) | 122 | Achilli et al. (2007)[43] | 0.80% |
| Italy | Sicily | 105 | Achilli et al. (2007)[43] | 0.95% |
| Italy | Latium | 138 | Achilli et al. (2007)[43] | 0.00% |
| Italy | Lombardy | 177 | Achilli et al. (2007)[43] | 0.00% |
| Italy | Piedmont | 169 | Achilli et al. (2007)[43] | 0.00% |
| Italy | Marche | 813 | Achilli et al. (2007)[43] | 0.25% |
| Italy | Campania | 313 | Achilli et al. (2007)[43] | 1.28% |
| Italy | Apulia-Calabria | 226 | Achilli et al. (2007)[43] | 1.33% |
| Italy | Sardinia | 370 | Achilli et al. (2007)[43] | 0.27% |
| Spain | Central Spain | 50 | Plaza et al. (2003)[51] | 2.0% |
| Spain | Galicia | 103 | Plaza et al. (2003)[51] | 1.9% |
| Spain | Galicia | 135 | Maca-Meyer et al. (2003)[66] | 2.2% |
| Spain | Catalonia | 118 | Maca-Meyer et al. (2003)[66] | 1.6% |
| Spain | Huelva | 135 | Hernandez et al. (2014)[67] | 8.8% |
| Spain | Maragatos | 49 | Maca-Meyer et al. (2003)[66] | 8.1% |
| Spain | Canary Islands | 300 | Brehm et al. (2003)[38] | 14.0% |
| Portugal | Countrywide | 54 | Plaza et al. (2003)[51] | 5.6% |
| Portugal | North Portugal | 184 | Maca-Meyer et al. (2003)[66] | 4.3% |
| Portugal | Central Portugal | 161 | Brehm et al. (2003)[38] | 1.9% |
| Portugal | Madeira | 155 | Brehm et al. (2003)[38] | 3.9% |
| Portugal | Madeira | 153 | Fernandes et al. (2006)[55] | 3.3% |
| Iberia | Spain & Portugal | 887 | Plaza et al. (2003)[51] | 1.8% |
GM immunoglobulin allotypes edit
Further studies have shown that the presence of haplotype GM*1,17 23' 5* in southern Europe. This haplotype is considered a genetic marker of Sub-Saharan Africa, where it shows frequencies of about 80%.[68] Whereas, in non-Mediterranean European populations, that value is about 0.3%, in Spain the average figure for this African haplotype is nearly eight times greater (though still at a low level) at 2.4%, and it shows a peak at 4.5% in Galicia.[69] Values of around 4% have also been found in Huelva and in the Aran valley in the Pyrenees.[70] Although some researchers have associated African traces in Iberia to Islamic conquest, the presence of GM*1,17 23' 5* haplotype in Iberia may in fact be due to more ancient processes as well as more recent ones through the introduction of genes from slaves sold from Africa.[69]
In Sicily the North African haplotype Gm 5*;1;17; ranges from 1.56% at Valledolmo to 5.5% at Alia.[71] The hypothesis is that the presence of this haplotype suggests past contacts with people from North Africa. The introduction of African markers could be due to the Phoenician colonization at the end of the second millennium B.C. or to the more recent Arab conquest (8th–9th centuries A.D.).
Paleoanthropology edit
The migration of farmers from the Middle East into Europe is believed to have significantly influenced the genetic profile of present-day Europeans. Some recent studies have focused on corroborating current genetic data with the archeological evidence from Europe, the Middle East, and Africa.[25] The Natufian culture, which existed about 12,000 years ago, has been the subject of various archeological investigations, as it is generally believed to be the source of the European and North African Neolithic.
According to one hypothesis,[9] the Natufian culture emerged from the mixing of two Stone Age cultures: (1) the Kebaran, a culture indigenous to the Levant, and (2) the Mushabian, a culture introduced into the Levant from North Africa†. It is suggested that the Mushabian culture originated in Africa, given that archeological sites with Mushabian industries in the Nile Valley predate those in the Levant†. The Mushabians would have then moved into the Sinai from the Nile Delta bringing with them their technologies†. The overpopulation in Northeast Africa contributed to the development of the Natufian adaptation, which resulted in agriculture becoming a new way of sustenance.[9]
From an analysis of human remains from the Natufian culture, there is evidence of Sub-Saharan influences in the Natufian samples.[7] These influences would have been diluted by the interbreeding of the Neolithic farmers from the Near East are associated with the indigenous foragers in Europe. The Sub-Saharan influences detected in the Natufian samples with the migration of E1b1b lineages from Northeast Africa to the Levant and then into Europe.[72]
According to an ancient DNA analyse on Natufian skeletal remains from present-day northern Israel, the Natufians in fact shared no evident genetic affinity to sub-Saharan Africans.[22] It was not possible to test for affinity in the Natufians to early North African populations using present-day North Africans as a reference because present-day North Africans owe most of their ancestry to back-migration from Eurasia.[22][73] The Natufians carried the Y-DNA (paternal) haplogroups E1b1b1b2(xE1b1b1b2a,E1b1b1b2b) (2/5; 40%), CT (2/5; 40%), and E1b1(xE1b1a1,E1b1b1b1) (1/5; 20%).[22][74] In terms of autosomal DNA, these Natufians carried around 50% of the Basal Eurasian (BE) and 50% of Western Eurasian Unknown Hunter Gather (UHG) components. However, they were slightly distinct from the northern Anatolian populations that contributed to the peopling of Europe, who had higher Western Hunter-Gatherer (WHG) inferred ancestry. Natufians were strongly genetically differentiated[75] from Neolithic Iranian farmers from the Zagros Mountains, caring up to 62% of the Basal Eurasians and Ancient North Eurasians (ANE). This might suggest that different strains of Basal Eurasians contributed to Natufians and Zagros farmers,[76][77][78] as both Natufians and Zagros farmers descended from different populations of local hunter gatherers. Mating between Natufians, other Neolithic Levantines, Caucasus Hunter Gatherers (CHG), Anatolian and Iranian farmers is believed to have decreased genetic variability among later populations in the Middle East. The scientists suggest that the Levantine early farmers may have spread southward into East Africa, bringing along Western Eurasian and Basal Eurasian ancestral components separate from that which would arrive later in North Africa.
† The Mushabian industry is now known to have originated in the Levant from the previous lithic industries of the region of Lake Lisan.[79] The Mushabian industry was originally thought to have originated in Africa because the microburin technique was not yet known to be much older in the eastern Levant.[80] Currently there is no known industry to connect with the African migration that occurred 14,700 years ago,[1] but it no doubt caused a population expansion in the Negev and Sinai which would not have accommodated an increase in population with the meager resources of a steppe/desert climate.[9] Since all of the known cultures in the Levant at the time of the migration originated in the Levant and an archaeological culture cannot be associated with it, there must have been assimilation into a Levantine culture at the onset, most likely the Ramonian which was present in the Sinai 14,700 years ago.[81]
See also edit
Notes edit
- ^ Recently, it has been proposed that E3b originated in eastern Africa and expanded into the Near East and northern Africa at the end of the Pleistocene. E3b lineages would have then been introduced from the Near East into southern Europe by migrant farmers, during the Neolithic expansion.[1]
- ^ A Mesolithic population carrying Group III lineages with the M35/M215 mutation expanded northwards from sub-Saharan to north Africa and the Levant. The Levantine population of farmers that dispersed into Europe during and after the Neolithic carried these African Group III M35/M215 lineages, together with a cluster of Group VI lineages characterized by M172 and M201 mutations.[24]
References edit
- ^ a b c d e f g Cruciani F, La Fratta R, Santolamazza P, Sellitto D, Pascone R, Moral P, Watson E, Guida V, Colomb EB, Zaharova B, Lavinha J, Vona G, Aman R, Cali F, Akar N, Richards M, Torroni A, Novelletto A, Scozzari R (May 2004). "Phylogeographic analysis of haplogroup E3b (E-M215) y chromosomes reveals multiple migratory events within and out of Africa". American Journal of Human Genetics. 74 (5): 1014–22. doi:10.1086/386294. PMC 1181964. PMID 15042509.
- ^ a b c d Malyarchuk BA, Czarny J (2005). "[African DNA lineages in mitochondrial gene pool of Europeans]". Molekuliarnaia Biologiia (in Russian). 39 (5): 806–12. doi:10.1007/s11008-005-0085-x. PMID 16240714. S2CID 2527074.
- ^ Botigué LR, Henn BM, Gravel S, Maples BK, Gignoux CR, Corona E, et al. (July 2013). "Gene flow from North Africa contributes to differential human genetic diversity in southern Europe". Proceedings of the National Academy of Sciences of the United States of America. 110 (29): 11791–11796. Bibcode:2019NatCo..10..551B. doi:10.1073/pnas.1306223110. PMC 3718088. PMID 23733930.
- ^ a b Olalde I, Mallick S, Patterson N, Rohland N, Villalba-Mouco V, Silva M, et al. (March 2019). "The genomic history of the Iberian Peninsula over the past 8000 years". Science. 363 (6432): 1230–1234. Bibcode:2019Sci...363.1230O. doi:10.1126/science.aav4040. PMC 6436108. PMID 30872528.
- ^ a b c Bycroft C, Fernandez-Rozadilla C, Ruiz-Ponte C, Quintela I, Carracedo Á, Donnelly P, Myers S (February 2019). "Patterns of genetic differentiation and the footprints of historical migrations in the Iberian Peninsula". Nature Communications. 10 (1): 551. Bibcode:2019NatCo..10..551B. doi:10.1038/s41467-018-08272-w. PMC 6358624. PMID 30710075.
- ^ Marcus, Joseph H.; Posth, Cosimo; Ringbauer, Harald; Lai, Luca; Skeates, Robin; Sidore, Carlo; Beckett, Jessica; Furtwängler, Anja; Olivieri, Anna; Chiang, Charleston W. K.; Al-Asadi, Hussein; Dey, Kushal; Joseph, Tyler A.; Liu, Chi-Chun; Der Sarkissian, Clio; Radzevičiūtė, Rita; Michel, Megan; Gradoli, Maria Giuseppina; Marongiu, Patrizia; Rubino, Salvatore; Mazzarello, Vittorio; Rovina, Daniela; La Fragola, Alessandra; Serra, Rita Maria; Bandiera, Pasquale; Bianucci, Raffaella; Pompianu, Elisa; Murgia, Clizia; Guirguis, Michele; Orquin, Rosana Pla; Tuross, Noreen; van Dommelen, Peter; Haak, Wolfgang; Reich, David; Schlessinger, David; Cucca, Francesco; Krause, Johannes; Novembre, John (24 February 2020). "Genetic history from the Middle Neolithic to present on the Mediterranean island of Sardinia". Nature Communications. 11 (1): 939. Bibcode:2020NatCo..11..939M. doi:10.1038/s41467-020-14523-6. PMC 7039977. PMID 32094358.
- ^ a b Brace CL, Seguchi N, Quintyn CB, Fox SC, Nelson AR, Manolis SK, Qifeng P (January 2006). "The questionable contribution of the Neolithic and the Bronze Age to European craniofacial form". Proceedings of the National Academy of Sciences of the United States of America. 103 (1): 242–7. Bibcode:2006PNAS..103..242B. doi:10.1073/pnas.0509801102. PMC 1325007. PMID 16371462.
- ^ Cavalli-Sforza LL, Piazza A (1993). "Human genomic diversity in Europe: a summary of recent research and prospects for the future". European Journal of Human Genetics. 1 (1): 3–18. doi:10.1159/000472383. PMID 7520820. S2CID 25475102.
- ^ a b c d Bar-Yosef O (1987). "Pleistocene connexions between Africa and Southwest Asia: an archaeological perspective". African Archaeological Review. 5 (1): 29–38. doi:10.1007/BF01117080. S2CID 132865471.
- ^ a b Underhill PA, Kivisild T (2007). "Use of y chromosome and mitochondrial DNA population structure in tracing human migrations". Annual Review of Genetics. 41 (1): 539–64. doi:10.1146/annurev.genet.41.110306.130407. PMID 18076332.
- ^ a b Hernández, Candela (2019). "Human Genomic Diversity Where the Mediterranean Joins the Atlantic". Molecular Biology and Evolution. 37 (4): 1041–1055. doi:10.1093/molbev/msz288. PMC 7086172. PMID 31816048.
- ^ a b Botigué LR, Henn BM, Gravel S, Maples BK, Gignoux CR, Corona E, Atzmon G, Burns E, Ostrer H, Flores C, Bertranpetit J, Comas D, Bustamante CD (July 2013). "Gene flow from North Africa contributes to differential human genetic diversity in southern Europe". Proceedings of the National Academy of Sciences of the United States of America. 110 (29): 11791–6. Bibcode:2013PNAS..11011791B. doi:10.1073/pnas.1306223110. PMC 3718088. PMID 23733930.
- ^ "Los españoles somos los europeos con más genes magrebíes". Huffington Post. 2013.
Comprobaron que entre un 4% y un 20% del genoma de los españoles es compartido con los norteafricanos. 'La cifra del 20% sólo se da en Canarias, para el resto del país oscila entre el 10% y 12%', explica Comas. Sólo los vascos de la muestra no presentan ese influjo norteafricano." English translation: "They found that between 4% and 20% of the genome of Spaniards is shared with North Africans. "The figure of 20% only occurs in the Canary Islands, for the rest of the country it ranges between 10% and 12%," explains Comas. Only the Basques in the sample do not show this North African influence.
- ^ Moorjani P, Patterson N, Hirschhorn JN, Keinan A, Hao L, Atzmon G, Burns E, Ostrer H, Price AL, Reich D (April 2011). McVean G (ed.). "The history of African gene flow into Southern Europeans, Levantines, and Jews". PLOS Genetics. 7 (4): e1001373. doi:10.1371/journal.pgen.1001373. PMC 3080861. PMID 21533020.
- ^ Pino-Yanes M, Corrales A, Basaldúa S, Hernández A, Guerra L, Villar J, Flores C (March 2011). O'Rourke D (ed.). "North African influences and potential bias in case-control association studies in the Spanish population". PLOS ONE. 6 (3): e18389. Bibcode:2011PLoSO...618389P. doi:10.1371/journal.pone.0018389. PMC 3068190. PMID 21479138.
- ^ a b Auton A, Bryc K, Boyko AR, Lohmueller KE, Novembre J, Reynolds A, Indap A, Wright MH, Degenhardt JD, Gutenkunst RN, King KS, Nelson MR, Bustamante CD (May 2009). "Global distribution of genomic diversity underscores rich complex history of continental human populations". Genome Research. 19 (5): 795–803. doi:10.1101/gr.088898.108. PMC 2675968. PMID 19218534.
- ^ Fregel R, Méndez FL, Bokbot Y, Martín-Socas D, Camalich-Massieu MD, Ávila-Arcos MC, et al. (2017). "Neolithization of North Africa involved the migration of people from both the Levant and Europe". bioRxiv 10.1101/191569.
- ^ Rando JC, Cabrera VM, Larruga JM, Hernández M, González AM, Pinto F, Bandelt HJ (September 1999). "Phylogeographic patterns of mtDNA reflecting the colonization of the Canary Islands". Annals of Human Genetics. 63 (Pt 5): 413–28. doi:10.1046/j.1469-1809.1999.6350413.x. PMID 10735583. S2CID 25089862.
- ^ a b González AM, Larruga JM, Abu-Amero KK, Shi Y, Pestano J, Cabrera VM (July 2007). "Mitochondrial lineage M1 traces an early human backflow to Africa". BMC Genomics. 8 (1): 223. doi:10.1186/1471-2164-8-223. PMC 1945034. PMID 17620140.
- ^ Ennafaa H, Cabrera VM, Abu-Amero KK, González AM, Amor MB, Bouhaha R, Dzimiri N, Elgaaïed AB, Larruga JM (February 2009). "Mitochondrial DNA haplogroup H structure in North Africa". BMC Genetics. 10 (1): 8. doi:10.1186/1471-2156-10-8. PMC 2657161. PMID 19243582.
- ^ Trombetta B, D'Atanasio E, Massaia A, Ippoliti M, Coppa A, Candilio F, et al. (June 2015). "Phylogeographic Refinement and Large Scale Genotyping of Human Y Chromosome Haplogroup E Provide New Insights into the Dispersal of Early Pastoralists in the African Continent". Genome Biology and Evolution. 7 (7): 1940–1950. doi:10.1093/gbe/evv118. PMC 4524485. PMID 26108492.
- ^ a b c d Lazaridis I, Nadel D, Rollefson G, Merrett DC, Rohland N, Mallick S, et al. (17 June 2016). "The genetic structure of the world's first farmers". bioRxiv 10.1101/059311. -- Table S6.1 - Y-chromosome haplogroups
- ^ a b Semino O, Magri C, Benuzzi G, Lin AA, Al-Zahery N, Battaglia V, Maccioni L, Triantaphyllidis C, Shen P, Oefner PJ, Zhivotovsky LA, King R, Torroni A, Cavalli-Sforza LL, Underhill PA, Santachiara-Benerecetti AS (May 2004). "Origin, diffusion, and differentiation of Y-chromosome haplogroups E and J: inferences on the neolithization of Europe and later migratory events in the Mediterranean area". American Journal of Human Genetics. 74 (5): 1023–34. doi:10.1086/386295. PMC 1181965. PMID 15069642.
- ^ a b Underhill PA, Passarino G, Lin AA, Shen P, Mirazón Lahr M, Foley RA, Oefner PJ, Cavalli-Sforza LL (January 2001). "The phylogeography of Y chromosome binary haplotypes and the origins of modern human populations". Annals of Human Genetics. 65 (Pt 1): 43–62. doi:10.1046/j.1469-1809.2001.6510043.x. PMID 11415522.
- ^ a b Lancaster A (2009). "Y Haplogroups, Archaeological Cultures and Language Families: a Review of the Multidisciplinary Comparisons using the case of E-M35" (PDF). Journal of Genetic Genealogy. 5 (1). Archived from the original (PDF) on 2016-05-06. Retrieved 2009-09-03.[unreliable medical source?]
- ^ a b Gonçalves R, Freitas A, Branco M, Rosa A, Fernandes AT, Zhivotovsky LA, Underhill PA, Kivisild T, Brehm A (July 2005). "Y-chromosome lineages from Portugal, Madeira and Açores record elements of Sephardim and Berber ancestry". Annals of Human Genetics. 69 (Pt 4): 443–54. doi:10.1111/j.1529-8817.2005.00161.x. hdl:10400.13/3018. PMID 15996172. S2CID 3229760.
- ^ a b c Adams SM, Bosch E, Balaresque PL, Ballereau SJ, Lee AC, Arroyo E, López-Parra AM, Aler M, Grifo MS, Brion M, Carracedo A, Lavinha J, Martínez-Jarreta B, Quintana-Murci L, Picornell A, Ramon M, Skorecki K, Behar DM, Calafell F, Jobling MA (December 2008). "The genetic legacy of religious diversity and intolerance: paternal lineages of Christians, Jews, and Muslims in the Iberian Peninsula". American Journal of Human Genetics. 83 (6): 725–36. doi:10.1016/j.ajhg.2008.11.007. PMC 2668061. PMID 19061982.
- ^ Flores C, Maca-Meyer N, González AM, Oefner PJ, Shen P, Pérez JA, Rojas A, Larruga JM, Underhill PA (October 2004). "Reduced genetic structure of the Iberian peninsula revealed by Y-chromosome analysis: implications for population demography". European Journal of Human Genetics. 12 (10): 855–63. doi:10.1038/sj.ejhg.5201225. PMID 15280900.
- ^ Francalacci P, Morelli L, Angius A, Berutti R, Reinier F, Atzeni R, Pilu R, Busonero F, Maschio A, Zara I, Sanna D, Useli A, Urru MF, Marcelli M, Cusano R, Oppo M, Zoledziewska M, Pitzalis M, Deidda F, Porcu E, Poddie F, Kang HM, Lyons R, Tarrier B, Gresham JB, Li B, Tofanelli S, Alonso S, Dei M, Lai S, Mulas A, Whalen MB, Uzzau S, Jones C, Schlessinger D, Abecasis GR, Sanna S, Sidore C, Cucca F (August 2013). "Low-pass DNA sequencing of 1200 Sardinians reconstructs European Y-chromosome phylogeny". Science. 341 (6145): 565–9. Bibcode:2013Sci...341..565F. doi:10.1126/science.1237947. PMC 5500864. PMID 23908240.
- ^ King TE, Parkin EJ, Swinfield G, Cruciani F, Scozzari R, Rosa A, Lim SK, Xue Y, Tyler-Smith C, Jobling MA (March 2007). "Africans in Yorkshire? The deepest-rooting clade of the Y phylogeny within an English genealogy". European Journal of Human Genetics. 15 (3): 288–93. doi:10.1038/sj.ejhg.5201771. PMC 2590664. PMID 17245408.
- ^ a b c d e Brisighelli F, Álvarez-Iglesias V, Fondevila M, Blanco-Verea A, Carracedo A, Pascali VL, Capelli C, Salas A (10 December 2012). "Uniparental markers of contemporary Italian population reveals details on its pre-Roman heritage". PLOS ONE. 7 (12): e50794. Bibcode:2012PLoSO...750794B. doi:10.1371/journal.pone.0050794. PMC 3519480. PMID 23251386.
- ^ Di Giacomo F, Luca F, Popa LO, Akar N, Anagnou N, Banyko J, et al. (October 2004). "Y chromosomal haplogroup J as a signature of the post-neolithic colonization of Europe". Human Genetics. 115 (5): 357–371. doi:10.1007/s00439-004-1168-9. PMID 15322918. S2CID 18482536.
- ^ Capelli C, Onofri V, Brisighelli F, Boschi I, Scarnicci F, Masullo M, et al. (June 2009). "Moors and Saracens in Europe: estimating the medieval North African male legacy in southern Europe". European Journal of Human Genetics. 17 (6): 848–852. doi:10.1038/ejhg.2008.258. PMC 2947089. PMID 19156170.
- ^ Cruciani F, La Fratta R, Trombetta B, Santolamazza P, Sellitto D, Colomb EB, et al. (June 2007). "Tracing past human male movements in northern/eastern Africa and western Eurasia: new clues from Y-chromosomal haplogroups E-M78 and J-M12". Molecular Biology and Evolution. 24 (6): 1300–1311. doi:10.1093/molbev/msm049. PMID 17351267.
- ^ a b c d Sarno S, Boattini A, Carta M, Ferri G, Alù M, Yao DY, et al. (2014-04-30). "An ancient Mediterranean melting pot: investigating the uniparental genetic structure and population history of sicily and southern Italy". PLOS ONE. 9 (4): e96074. Bibcode:2014PLoSO...996074S. doi:10.1371/journal.pone.0096074. PMC 4005757. PMID 24788788.
- ^ a b Cerezo M, Achilli A, Olivieri A, Perego UA, Gómez-Carballa A, Brisighelli F, Lancioni H, Woodward SR, López-Soto M, Carracedo A, Capelli C, Torroni A, Salas A (May 2012). "Reconstructing ancient mitochondrial DNA links between Africa and Europe". Genome Research. 22 (5): 821–6. doi:10.1101/gr.134452.111. PMC 3337428. PMID 22454235.
- ^ a b c d Pereira L, Cunha C, Alves C, Amorim A (April 2005). "African female heritage in Iberia: a reassessment of mtDNA lineage distribution in present times". Human Biology. 77 (2): 213–29. doi:10.1353/hub.2005.0041. hdl:10216/109268. PMID 16201138. S2CID 20901589.
- ^ a b c d e f g h i Brehm A, Pereira L, Kivisild T, Amorim A (December 2003). "Mitochondrial portraits of the Madeira and Açores archipelagos witness different genetic pools of its settlers". Human Genetics. 114 (1): 77–86. doi:10.1007/s00439-003-1024-3. hdl:10400.13/3046. PMID 14513360. S2CID 8870699.
- ^ Pereira L, Prata MJ, Amorim A (November 2000). "Diversity of mtDNA lineages in Portugal: not a genetic edge of European variation". Annals of Human Genetics. 64 (Pt 6): 491–506. doi:10.1046/j.1469-1809.2000.6460491.x. PMID 11281213. S2CID 10478774.
- ^ a b c González AM, Brehm A, Pérez JA, Maca-Meyer N, Flores C, Cabrera VM (April 2003). "Mitochondrial DNA affinities at the Atlantic fringe of Europe". American Journal of Physical Anthropology. 120 (4): 391–404. doi:10.1002/ajpa.10168. PMID 12627534.
- ^ a b c Casas MJ, Hagelberg E, Fregel R, Larruga JM, González AM (December 2006). "Human mitochondrial DNA diversity in an archaeological site in al-Andalus: genetic impact of migrations from North Africa in medieval Spain". American Journal of Physical Anthropology. 131 (4): 539–51. doi:10.1002/ajpa.20463. PMID 16685727.
- ^ a b c Alvarez L, Santos C, Ramos A, Pratdesaba R, Francalacci P, Aluja MP (August 2010). "Mitochondrial DNA patterns in the Iberian Northern plateau: population dynamics and substructure of the Zamora province". American Journal of Physical Anthropology. 142 (4): 531–539. doi:10.1002/ajpa.21252. PMID 20127843.
As regards sub-Saharan Hgs (L1b, L2b, and L3b), the high frequency found in the southern regions of Zamora, 18.2% in Sayago and 8.1% in Bajo Duero, is comparable to that described for the South of Portugal
- ^ a b c d e f g h i j k l m n o p q r s t u v w x y z aa ab ac ad ae af ag ah ai aj Achilli A, Olivieri A, Pala M, Metspalu E, Fornarino S, Battaglia V, Accetturo M, Kutuev I, Khusnutdinova E, Pennarun E, Cerutti N, Di Gaetano C, Crobu F, Palli D, Matullo G, Santachiara-Benerecetti AS, Cavalli-Sforza LL, Semino O, Villems R, Bandelt HJ, Piazza A, Torroni A (April 2007). "Mitochondrial DNA variation of modern Tuscans supports the near eastern origin of Etruscans". American Journal of Human Genetics. 80 (4): 759–68. doi:10.1086/512822. PMC 1852723. PMID 17357081.
- ^ a b Ottoni C, Martinez-Labarga C, Vitelli L, Scano G, Fabrini E, Contini I, Biondi G, Rickards O (2009). "Human mitochondrial DNA variation in Southern Italy". Annals of Human Biology. 36 (6): 785–811. doi:10.3109/03014460903198509. PMID 19852679. S2CID 1788055.
- ^ a b Malyarchuk BA, Derenko M, Perkova M, Grzybowski T, Vanecek T, Lazur J (September 2008). "Reconstructing the phylogeny of African mitochondrial DNA lineages in Slavs". European Journal of Human Genetics. 16 (9): 1091–6. doi:10.1038/ejhg.2008.70. PMID 18398433.
- ^ Brook, Kevin Alan (2022). The Maternal Genetic Lineages of Ashkenazic Jews. Academic Studies Press. pp. 77–78. doi:10.2307/j.ctv33mgbcn. ISBN 978-1644699843. S2CID 254519342.
- ^ Marta Mielnik-Sikorska; Patrycja Daca; Boris Malyarchuk; Miroslava Derenko; Katarzyna Skonieczna; Maria Perkova; Tadeusz Dobosz; Tomasz Grzybowski (14 January 2013). "The history of Slavs inferred from complete mitochondrial genome sequences". PLOS ONE. 8 (1): e54360. Bibcode:2013PLoSO...854360M. doi:10.1371/journal.pone.0054360. PMC 3544712. PMID 23342138.
- ^ Behar DM, Metspalu E, Kivisild T, Achilli A, Hadid Y, Tzur S, Pereira L, Amorim A, Quintana-Murci L, Majamaa K, Herrnstadt C, Howell N, Balanovsky O, Kutuev I, Pshenichnov A, Gurwitz D, Bonne-Tamir B, Torroni A, Villems R, Skorecki K (March 2006). "The matrilineal ancestry of Ashkenazi Jewry: portrait of a recent founder event". American Journal of Human Genetics. 78 (3): 487–97. doi:10.1086/500307. PMC 1380291. PMID 16404693.
- ^ Hernández CL, Soares P, Dugoujon JM, Novelletto A, Rodríguez JN, Rito T, Oliveira M, Melhaoui M, Baali A, Pereira L, Calderón R (2015). "Early Holocenic and Historic mtDNA African Signatures in the Iberian Peninsula: The Andalusian Region as a Paradigm". PLOS ONE. 10 (10): e0139784. Bibcode:2015PLoSO..1039784H. doi:10.1371/journal.pone.0139784. PMC 4624789. PMID 26509580.
- ^ Álvarez JC, Johnson DL, Lorente JA, Martinez-Espin E, Martinez-Gonzalez LJ, Allard M, et al. (November 2007). "Characterization of human control region sequences for Spanish individuals in a forensic mtDNA data set". Legal Medicine. 9 (6): 293–304. doi:10.1016/j.legalmed.2007.05.005. PMID 17616421.
- ^ a b c d e f g h i j k l m n o Plaza S, Calafell F, Helal A, Bouzerna N, Lefranc G, Bertranpetit J, Comas D (July 2003). "Joining the pillars of Hercules: mtDNA sequences show multidirectional gene flow in the western Mediterranean". Annals of Human Genetics. 67 (Pt 4): 312–328. doi:10.1046/j.1469-1809.2003.00039.x. PMID 12914566. S2CID 11201992.
- ^ Picornell A, Gómez-Barbeito L, Tomàs C, Castro JA, Ramon MM (September 2005). "Mitochondrial DNA HVRI variation in Balearic populations". American Journal of Physical Anthropology. 128 (1): 119–30. doi:10.1002/ajpa.10423. PMID 15761883.
- ^ Barral-Arca R, Pischedda S, Gómez-Carballa A, Pastoriza A, Mosquera-Miguel A, López-Soto M, et al. (2016). "Meta-Analysis of Mitochondrial DNA Variation in the Iberian Peninsula". PLOS ONE. 11 (7): e0159735. Bibcode:2016PLoSO..1159735B. doi:10.1371/journal.pone.0159735. PMC 4956223. PMID 27441366.
- ^ a b c d e Pereira V, Gomes V, Amorim A, Gusmão L, João Prata M (2010). "Genetic characterization of uniparental lineages in populations from Southwest Iberia with past malaria endemicity". American Journal of Human Biology. 22 (5): 588–95. doi:10.1002/ajhb.21049. PMID 20737604. S2CID 23350335.
- ^ a b Fernandes AT, Gonçalves R, Rosa A, Brehm A (April 2006). "Analysis of Y-chromosome and mtDNA variability in the Madeira Archipelago population". International Congress Series. 1288. Elsevier: 94–96. doi:10.1016/j.ics.2005.12.067. hdl:10400.13/4477. S2CID 67830076.
- ^ a b Boattini A, Martinez-Cruz B, Sarno S, Harmant C, Useli A, Sanz P, Yang-Yao D, Manry J, Ciani G, Luiselli D, Quintana-Murci L, Comas D, Pettener D (2013). "Uniparental markers in Italy reveal a sex-biased genetic structure and different historical strata". PLOS ONE. 8 (5): e65441. Bibcode:2013PLoSO...865441B. doi:10.1371/journal.pone.0065441. PMC 3666984. PMID 23734255.
- ^ a b c d Babalini C, Martínez-Labarga C, Tolk HV, Kivisild T, Giampaolo R, Tarsi T, Contini I, Barać L, Janićijević B, Martinović Klarić I, Pericić M, Sujoldzić A, Villems R, Biondi G, Rudan P, Rickards O (August 2005). "The population history of the Croatian linguistic minority of Molise (southern Italy): a maternal view". European Journal of Human Genetics. 13 (8): 902–12. doi:10.1038/sj.ejhg.5201439. PMID 15886710.
- ^ Pardo LM, Piras G, Asproni R, van der Gaag KJ, Gabbas A, Ruiz-Linares A, et al. (September 2012). "Dissecting the genetic make-up of North-East Sardinia using a large set of haploid and autosomal markers". European Journal of Human Genetics. 20 (9): 956–964. doi:10.1038/ejhg.2012.22. PMC 3421114. PMID 22378280.
- ^ Sanna D, Pala M, Cossu P, Dedola GL, Melis S, Fresu G, et al. (April 2011). "Mendelian breeding units versus standard sampling strategies: Mitochondrial DNA variation in southwest Sardinia". Genetics and Molecular Biology. 34 (2): 187–194. doi:10.1590/s1415-47572011000200003. PMC 3115307. PMID 21734814.
- ^ Fraumene C, Petretto E, Angius A, Pirastu M (December 2003). "Striking differentiation of sub-populations within a genetically homogeneous isolate (Ogliastra) in Sardinia as revealed by mtDNA analysis". Human Genetics. 114 (1): 1–10. doi:10.1007/s00439-003-1008-3. PMID 13680359. S2CID 32334073.
- ^ Romano V, Calì F, Ragalmuto A, D'Anna RP, Flugy A, De Leo G, Giambalvo O, Lisa A, Fiorani O, Di Gaetano C, Salerno A, Tamouza R, Charron D, Zei G, Matullo G, Piazza A (January 2003). "Autosomal microsatellite and mtDNA genetic analysis in Sicily (Italy)". Annals of Human Genetics. 67 (Pt 1): 42–53. doi:10.1046/j.1469-1809.2003.00007.x. PMID 12556234. S2CID 41123114.
- ^ Martinez, Laisel; Mirabal, Sheyla; Luis, Javier R.; Herrera, Rene J. (2008). "Middle Eastern and European mtDNA lineages characterize populations from eastern Crete". American Journal of Physical Anthropology. 137 (2): 213–223. doi:10.1002/ajpa.20857. ISSN 0002-9483. PMID 18500747.
- ^ Richards, Martin; Macaulay, Vincent; Hickey, Eileen; Vega, Emilce; Sykes, Bryan; Guida, Valentina; Rengo, Chiara; Sellitto, Daniele; Cruciani, Fulvio; Kivisild, Toomas; Villems, Richard; Thomas, Mark; Rychkov, Serge; Rychkov, Oksana; Rychkov, Yuri (2000). "Tracing European Founder Lineages in the Near Eastern mtDNA Pool". The American Journal of Human Genetics. 67 (5): 1251–1276. doi:10.1016/S0002-9297(07)62954-1. PMC 1288566. PMID 11032788.
- ^ Irwin J, Saunier J, Strouss K, Paintner C, Diegoli T, Sturk K, et al. (January 2008). "Mitochondrial control region sequences from northern Greece and Greek Cypriots". International Journal of Legal Medicine. 122 (1): 87–89. doi:10.1007/s00414-007-0173-7. PMID 17492459. S2CID 19488308.
- ^ Rando JC, Pinto F, González AM, Hernández M, Larruga JM, Cabrera VM, Bandelt HJ (November 1998). "Mitochondrial DNA analysis of northwest African populations reveals genetic exchanges with European, near-eastern, and sub-Saharan populations". Annals of Human Genetics. 62 (Pt 6): 531–50. doi:10.1046/j.1469-1809.1998.6260531.x. PMID 10363131. S2CID 2925153.
- ^ a b c d e f Maca-Meyer N, González AM, Pestano J, Flores C, Larruga JM, Cabrera VM (October 2003). "Mitochondrial DNA transit between West Asia and North Africa inferred from U6 phylogeography". BMC Genetics. 4: 15. doi:10.1186/1471-2156-4-15. PMC 270091. PMID 14563219.
- ^ Hernández CL, Reales G, Dugoujon JM, Novelletto A, Rodríguez JN, Cuesta P, Calderón R (January 2014). "Human maternal heritage in Andalusia (Spain): its composition reveals high internal complexity and distinctive influences of mtDNA haplogroups U6 and L in the western and eastern side of region". BMC Genetics. 15: 11. doi:10.1186/1471-2156-15-11. PMC 3905667. PMID 24460736.
- ^ Calderón R, Ambrosio B, Guitard E, González-Martín A, Aresti U, Dugoujon JM (December 2006). "Genetic position of Andalusians from Huelva in relation to other European and North African populations: a study based on GM and KM allotypes". Human Biology. 78 (6): 663–79. doi:10.1353/hub.2007.0008. PMID 17564246. S2CID 38748780.
- ^ a b Calderón R, Lodeiro R, Varela TA, Fariña J, Ambrosio B, Guitard E, González-Martín A, Dugoujon JM (June 2007). "GM and KM immunoglobulin allotypes in the Galician population: new insights into the peopling of the Iberian Peninsula". BMC Genetics. 8 (1): 37. doi:10.1186/1471-2156-8-37. PMC 1934380. PMID 17597520.
- ^ Giraldo MP, Esteban E, Aluja MP, Nogués RM, Backés-Duró C, Dugoujon JM, Moral P (November 2001). "Gm and Km alleles in two Spanish Pyrenean populations (Andorra and Pallars Sobirà): a review of Gm variation in the Western Mediterranean basin". Annals of Human Genetics. 65 (Pt 6): 537–48. doi:10.1046/j.1469-1809.2001.6560537.x. PMID 11851984.
- ^ Cerutti N, Dugoujon JM, Guitard E, Rabino Massa E (January 2004). "Gm and Km immunoglobulin allotypes in Sicily". Immunogenetics. 55 (10): 674–81. doi:10.1007/s00251-003-0628-z. PMID 14652700. S2CID 9663858.
- ^ Ricaut FX, Waelkens M (October 2008). "Cranial discrete traits in a Byzantine population and eastern Mediterranean population movements". Human Biology. 80 (5): 535–64. doi:10.3378/1534-6617-80.5.535. PMID 19341322. S2CID 25142338.
- ^ Lazaridis 2016 Quote: "However, no affinity of Natufians to sub-Saharan Africans is evident in our genome-wide analysis, as present-day sub-Saharan Africans do not share more alleles with Natufians than with other ancient Eurasians (Extended Data Table 1)."
- ^ Lazaridis I, Nadel D, Rollefson G, Merrett DC, Rohland N, Mallick S, et al. (August 2016). "Genomic insights into the origin of farming in the ancient Near East". Nature. 536 (7617): 419–424. Bibcode:2016Natur.536..419L. doi:10.1038/nature19310. PMC 5003663. PMID 27459054., Supplementary Table 1.
- ^ Lazaridis I, Nadel D, Rollefson G, Merrett DC, Rohland N, Mallick S, et al. (August 2016). "Genomic insights into the origin of farming in the ancient Near East". Nature. 536 (7617): 419–424. Bibcode:2016Natur.536..419L. doi:10.1038/nature19310. PMC 5003663. PMID 27459054.
- ^ Broushaki F, Thomas MG, Link V, López S, van Dorp L, Kirsanow K, et al. (July 2016). "Early Neolithic genomes from the eastern Fertile Crescent". Science. 353 (6298): 499–503. Bibcode:2016Sci...353..499B. doi:10.1126/science.aaf7943. PMC 5113750. PMID 27417496.
- ^ Gallego-Llorente M, Connell S, Jones ER, Merrett DC, Jeon Y, Eriksson A, et al. (August 2016). "The genetics of an early Neolithic pastoralist from the Zagros, Iran". Scientific Reports. 6: 31326. Bibcode:2016NatSR...631326G. doi:10.1038/srep31326. PMC 4977546. PMID 27502179.
- ^ Fernández E, Pérez-Pérez A, Gamba C, Prats E, Cuesta P, Anfruns J, et al. (June 2014). "Ancient DNA analysis of 8000 B.C. near eastern farmers supports an early neolithic pioneer maritime colonization of Mainland Europe through Cyprus and the Aegean Islands". PLOS Genetics. 10 (6): e1004401. doi:10.1371/journal.pgen.1004401. PMC 4046922. PMID 24901650.
- ^ Goring-Morris AN, Hovers E, Belfer-Cohen A (2009). "The Dynamics of Pleistocene and Early Holocene Settlement Patterns in the Levant: An Overview.". In Shea JJ, Lieberman DE (eds.). Transitions in Prehistory: Essays in Honor of Ofer Bar-Yosef. Oxbow Books. ISBN 978-1-84217-340-4.
- ^ Olszewski DI (2006). "Issues in the Levantine Epipaleolithic: The Madamaghan, Nebekian and Qalkhan (Levant Epipaleolithic)". Paléorient. 32 (1): 19–26. doi:10.3406/paleo.2006.5168.
- ^ Richter T, Garrard AN, Allock S, Maher LA (2011). "Interaction before Agriculture: Exchanging Material and Sharing Knowledge in the Final Pleistocene Levant" (PDF). Cambridge Archaeological Journal. 21 (1): 95–114. doi:10.1017/S0959774311000060. S2CID 162887983.
Further reading edit
- Cavalli-Sforza LL (July 1997). "Genes, peoples, and languages". Proceedings of the National Academy of Sciences of the United States of America. 94 (15): 7719–24. Bibcode:1997PNAS...94.7719C. doi:10.1073/pnas.94.15.7719. PMC 33682. PMID 9223254.
- Cherni L, Fernandes V, Pereira JB, Costa MD, Goios A, Frigi S, Yacoubi-Loueslati B, Amor MB, Slama A, Amorim A, El Gaaied AB, Pereira L (June 2009). "Post-last glacial maximum expansion from Iberia to North Africa revealed by fine characterization of mtDNA H haplogroup in Tunisia". American Journal of Physical Anthropology. 139 (2): 253–60. doi:10.1002/ajpa.20979. PMID 19090581.