
KNOWPIA
WELCOME TO KNOWPIA

Bracknell Forest Borough Council elections 
Summary
Bracknell Forest Borough Council is the local authority for Bracknell Forest, a unitary authority in Berkshire, England. Until 1 April 1998 it was a non-metropolitan district.[1]
Political control edit
Since the first election to the council in 1973 political control of the council has been held by the following parties:[2][3]
Non-metropolitan district
| Party in control | Years | |
|---|---|---|
| Labour | 1973–1976 | |
| Conservative | 1976–1995 | |
| Labour | 1995–1997 | |
| Conservative | 1997–1998 | |
Unitary authority
| Party in control | Years | |
|---|---|---|
| Conservative | 1998–2023 | |
| Labour | 2023–present | |
Leadership edit
The leaders of the council since 1984 have been:[4]
| Councillor | Party | From | To | |
|---|---|---|---|---|
| Alan Ward[5] | Conservative | 1984 | 30 Apr 1992 | |
| Bob Angell[6] | Conservative | 30 Apr 1992 | 7 May 1995 | |
| Austin McCormack | Labour | May 1995 | 13 May 1997 | |
| Paul Bettison | Conservative | 13 May 1997 | 7 May 2023 | |
| Mary Temperton[7] | Labour | 24 May 2023 | ||
Council elections edit
Non-metropolitan district elections edit
- 1973 Bracknell District Council election
- 1976 Bracknell District Council election
- 1979 Bracknell District Council election (New ward boundaries, number of seats increased from 31 to 40)[8]
- 1983 Bracknell District Council election
- 1987 Bracknell Forest Borough Council election
- 1991 Bracknell Forest Borough Council election (Borough boundary changes took place but the number of seats remained the same)[9]
- 1995 Bracknell Forest Borough Council election
Unitary authority elections edit
- 1997 Bracknell Forest Borough Council election
- 2000 Bracknell Forest Borough Council election
- 2003 Bracknell Forest Borough Council election (New ward boundaries increased the number of seats by 2)[10][11]
- 2007 Bracknell Forest Borough Council election
- 2011 Bracknell Forest Borough Council election
- 2015 Bracknell Forest Borough Council election
- 2019 Bracknell Forest Borough Council election
- 2023 Bracknell Forest Borough Council election (New ward boundaries decreased the number of seats by 1)
Results maps edit
-
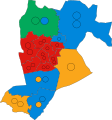 2023 results map

By-election results edit
1997–2000 edit
| Party | Candidate | Votes | % | ±% | |
|---|---|---|---|---|---|
| Labour | John Piasecki | 638 | 62.2 | +18.9 | |
| Conservative | Diana Henfrey | 329 | 32.1 | -8.3 | |
| Liberal Democrats | David Maxwell | 58 | 5.7 | -10.6 | |
| Majority | 309 | 30.1 | |||
| Turnout | 1,025 | 29.0 | |||
| Labour gain from Conservative | Swing | ||||
| Party | Candidate | Votes | % | ±% | |
|---|---|---|---|---|---|
| Labour | Roy Bailey | 876 | 50.2 | +10.7 | |
| Conservative | Christopher Turrell | 765 | 43.9 | +8.9 | |
| Liberal Democrats | Alan Cocks | 103 | 5.9 | -10.6 | |
| Majority | 111 | 6.3 | |||
| Turnout | 1,744 | 28.0 | |||
| Labour hold | Swing | ||||
2000–2003 edit
| Party | Candidate | Votes | % | ±% | |
|---|---|---|---|---|---|
| Labour | David Fawcett | 382 | 49.0 | -10.8 | |
| Conservative | Tony Packham | 312 | 40.1 | -0.1 | |
| Liberal Democrats | Sarah Edwards | 85 | 10.9 | +10.9 | |
| Majority | 70 | 8.9 | |||
| Turnout | 779 | 29.0 | |||
| Labour hold | Swing | ||||
| Party | Candidate | Votes | % | ±% | |
|---|---|---|---|---|---|
| Conservative | Charles Bailey | 576 | 40.4 | -2.9 | |
| Labour | Janet Keene | 521 | 36.6 | -0.9 | |
| Liberal Democrats | Lorraine De Laune | 137 | 9.6 | -1.6 | |
| Green | David Young | 120 | 8.4 | +0.4 | |
| UKIP | Lawrence Boxall | 71 | 5.0 | +5.0 | |
| Majority | 55 | 3.8 | |||
| Turnout | 1,425 | 22.0 | |||
| Conservative hold | Swing | ||||
2003–2007 edit
| Party | Candidate | Votes | % | ±% | |
|---|---|---|---|---|---|
| Conservative | Brenda Wilson | 921 | 55.5 | +16.4 | |
| Liberal Democrats | Michael Hawkins | 444 | 26.8 | +4.0 | |
| Labour | David Fawcett | 174 | 10.5 | -8.7 | |
| UKIP | Jeffrey Newbold | 119 | 7.2 | +7.2 | |
| Majority | 477 | 28.7 | |||
| Turnout | 1,658 | 28.4 | |||
| Conservative hold | Swing | ||||
2007–2011 edit
| Party | Candidate | Votes | % | ±% | |
|---|---|---|---|---|---|
| Conservative | Mark Phillips | 640 | 42.4 | -14.2 | |
| Labour | Janet Keene | 377 | 25.0 | -1.9 | |
| Liberal Democrats | Larraine De Laune | 206 | 13.7 | +13.7 | |
| UKIP | Jeff Newbold | 139 | 9.2 | +9.2 | |
| Green | Steven Gabb | 77 | 5.1 | -11.3 | |
| BNP | David Penson | 70 | 4.6 | +4.6 | |
| Majority | 263 | 17.4 | |||
| Turnout | 1,509 | 23.4 | |||
| Conservative hold | Swing | ||||
| Party | Candidate | Votes | % | ±% | |
|---|---|---|---|---|---|
| Conservative | Norman Bowers | 508 | 54.2 | -1.9 | |
| Liberal Democrats | Mark Thompson | 238 | 25.4 | +25.4 | |
| Labour | Guy Gillbe | 126 | 13.4 | +13.4 | |
| Green | Peter Forbes | 66 | 7.0 | +7.0 | |
| Majority | 270 | 28.8 | |||
| Turnout | 938 | 24.0 | |||
| Conservative hold | Swing | ||||
2011-2015 edit
| Party | Candidate | Votes | % | ±% | |
|---|---|---|---|---|---|
| Conservative | Susie Phillips | 582 | 52.5 | -18.9 | |
| UKIP | Ken La Garde | 318 | 28.7 | +28.7 | |
| Labour | Janet Hazel Keene | 139 | 12.5 | -1.4 | |
| Liberal Democrats | Paul Peter Birchall | 69 | 6.2 | +6.2 | |
| Majority | 264 | 23.8 | |||
| Turnout | 1108 | 27 | -20 | ||
| Conservative hold | Swing | ||||
2015-2019 edit
| Party | Candidate | Votes | % | ±% | |
|---|---|---|---|---|---|
| Conservative | Gaby Kennedy | 476 | 69.3 | +6.3 | |
| Labour | Anne Brunton | 211 | 30.7 | +10.5 | |
| Majority | 265 | 38.6 | |||
| Turnout | 687 | 17 | -52 | ||
| Conservative hold | Swing | ||||
2019-2023 edit
| Party | Candidate | Votes | % | ±% | |
|---|---|---|---|---|---|
| Labour | Paul Bidwell | 434 | 61.1 | +23.2 | |
| Conservative | Iain McCracken | 276 | 38.9 | -9.3 | |
| Majority | 158 | 22.2 | |||
| Turnout | 710 | 17 | -12 | ||
| Labour gain from Conservative | Swing | 16.3 | |||
References edit
- ^ "Meetings, agendas and minutes". Bracknell Forest Council. Retrieved 17 October 2009.
- ^ "Council compositions". The Elections Centre. Retrieved 3 May 2016.
- ^ "Bracknell Forest". BBC News Online. Retrieved 17 October 2009.
- ^ "Council minutes". Bracknell Forest Council. Retrieved 11 June 2022.
- ^ "A new man in the hot seat". Bracknell Times. 7 May 1992. p. 3. Retrieved 12 June 2022.
- ^ "Angell falls in a night of shocks". Wokingham Times. 11 May 1995. p. 7. Retrieved 12 June 2022.
- ^ "'History made' at Bracknell Forest Council, says new mayor". Bracknell News. Retrieved 25 May 2023.
- ^ The District of Bracknell (Electoral Arrangements) Order 1977
- ^ legislation.gov.uk - The Berkshire, Buckinghamshire, Hampshire, Oxfordshire and Surrey (County Boundaries) Order 1991. Retrieved on 5 November 2015.
- ^ "Local elections". * BBC News Online. Retrieved 17 October 2009.
- ^ legislation.gov.uk - The Borough of Bracknell Forest (Electoral Changes) Order 2002. Retrieved on 4 October 2015.
- ^ "Election Results – Great Hollands South". Bracknell Forest Council. Archived from the original on 8 June 2011. Retrieved 17 October 2009.
- ^ "Election Results – Harmans Water". Bracknell Forest Council. Archived from the original on 8 June 2011. Retrieved 17 October 2009.
- ^ "Tories inch ahead". guardian.co.uk. 9 November 2001. Retrieved 17 October 2009.
- ^ "Election Results – Hanworth". Bracknell Forest Council. Archived from the original on 8 June 2011. Retrieved 17 October 2009.
- ^ "Election Results – Binfield with Warfield". Bracknell Forest Council. Archived from the original on 8 June 2011. Retrieved 17 October 2009.
- ^ "BNP suffers defeat in Bradford byelection". guardian.co.uk. 24 March 2006. Retrieved 17 October 2009.
- ^ "Hanworth by-election result". Bracknell Forest Standard. 16 October 2009. Retrieved 17 October 2009.
- ^ "Bracknell Conservatives win Owlsmoor by-election". getbracknell. 26 February 2010. Retrieved 26 February 2010.
- ^ "Election results for Winkfield & Cranbourne". Bracknell Forest Borough Council. 28 November 2013. Retrieved 4 October 2018.
- ^ "Election results for Central Sandhurst". Bracknell Forest Borough Council. 20 October 2016. Retrieved 4 October 2018.
- ^ "Election results for Old Bracknell". Bracknell Forest Borough Council. 10 December 2021. Retrieved 10 December 2021.
- By-election results Archived 29 March 2010 at the Wayback Machine
External links edit
- Bracknell Forest Council