


Summary
The 1928 United States presidential election in Alabama took place on November 6, 1928, as part of the 1928 United States presidential election, which was held throughout all contemporary forty-eight states. Voters chose twelve representatives, or electors to the Electoral College, who voted for president and vice president. This was the last election in which Alabama had twelve electoral votes: the Great Migration caused the state to lose congressional districts after the 1930 Census produced the first Congressional redistricting since 1911.
| ||||||||||||||||||||||||||
| ||||||||||||||||||||||||||
 County results
| ||||||||||||||||||||||||||
| ||||||||||||||||||||||||||
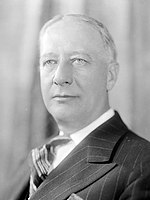
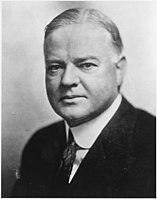
Alabama voted narrowly for the Democratic nominee, Governor Alfred E. "Al" Smith of New York, over the Republican nominee, former Secretary of Commerce Herbert Hoover of California. Smith's running mate was Senator Joseph Taylor Robinson of Arkansas, while Hoover's running mate was Senate Majority Leader Charles Curtis of Kansas. The only other candidate on the ballot was Socialist Norman Thomas, who received a mere 460 votes.[1]
Since the 1890s, Alabama had become a one-party state ruled by the Democratic Party. Disenfranchisement of almost all African-Americans and a large proportion of poor whites via poll taxes, literacy tests[2] and informal harassment had essentially eliminated opposition parties outside of presidential campaigns in a few northern hill counties. The only competitive statewide elections became Democratic Party primaries, and ever since 1900 the Democratic Party won over two-thirds of the limited number of votes cast even in presidential elections.
Between 1900 and 1924, the southern bloc had been able to veto presidential nominations by extralimital branches of the Democratic Party. This changed before the 1928 election, as most Democrats decided to sit out the convention due to their belief the party had no chance of winning the November election.[3] Consequently, Al Smith, a four-term Governor of New York, was able to win the nomination on the first ballot.
Four characteristics of Smith made him anything but an ideal candidate for Southern Democrats: he was a devout Catholic, opposed to Prohibition, linked with New York City's Tammany Hall political machine, and the son of Irish and Italian immigrants. Whilst it is generally thought that the South would have accepted a man possessing one of those characteristics,[4] the combination proved a bitter dose for many of Alabama's loyal Democrats. It was also thought by some, including those close to the revived Ku Klux Klan, that Smith was too friendly with blacks[5] and some Alabama whites unsubtly called Smith "nigger, nigger, nigger."[6] Nonetheless, these people did not think Hoover any safer on the race issue, although they did prefer Hoover's view on Prohibition.[7]
The conflict between disapproval of Smith's faith and policies on one hand and extreme traditional hostility towards the Republican Party in almost all of Alabama (the only exceptions being the historically anti-secession counties of Winston and a few populist strongholds like Chilton) produced an exceptionally bitter campaign.[8] Black Belt whites – who had controlled the state government since the disenfranchisement of blacks and poor whites – also felt Smith's social views obnoxious, especially his opposition to the Ku Klux Klan. Consequently, many of Alabama's voters swore to vote for Hoover without declaring themselves Republicans, instead calling themselves "Hoovercrats".[8] Defections were particularly pronounced in North Alabama, where a contiguous block of counties from Birmingham northeastwards to the Tennessee border uniformly gave majorities for Hoover. Hoover also won a number of counties in the far southern coastal regions, whose soils had always proved unsuitable for cotton plantations.[9] On the other hand, the whites of the black belt, who were like Al Smith "wet" (opposed to prohibition of alcohol), did not bolt from the Democratic Party because of this alcohol issue and their strong view that the Democrats were the best safeguard for white supremacy.[10]
Overall, Smith held the state by just over seven thousand votes, although opponents of Smith believed that electoral fraud was widespread in the Black Belt. State judges Hugh Locke, Horace Wilkinson and Ira Champion argued that up to seventeen thousand ballots for Hoover had been rejected.[11] No recount, however, was ever contemplated by authorities. This result constitutes the third-closest presidential election in Alabama’s history after that of 1980, another Republican landslide (this time affected by the personal vote in the South for Jimmy Carter), and that of 1848, when Democratic nominee Lewis Cass won the state by 1.12 percentage points.
A strong correlation was revealed between percentage of blacks in the population and (white) voter loyalty to the Democratic Party (with the r-value equaling 0.7268): of the twenty-six counties won by Hoover, only five had population over thirty percent Negro, and most of these were urban areas less attached to the traditions of black belt politics, while Chambers County was the home of Hoovercrat senator J. Thomas Heflin.[12] At the other extreme, of the ten counties possessing populations under ten percent African American in 1930,[13][a] only Marion County stayed loyal to Smith and only by a very narrow margin.
Results edit
| 1928 United States presidential election in Alabama[1] | |||||
|---|---|---|---|---|---|
| Party | Candidate | Votes | Percentage | Electoral votes | |
| Democratic | Al Smith | 127,797 | 51.33% | 12 | |
| Republican | Herbert Hoover | 120,753 | 48.50% | 0 | |
| Socialist | Norman Thomas | 460 | 0.18% | 0 | |
| Voter turnout (voting age) | 18.8%[14] | ||||
Results by county edit
| County | Al Smith Democratic |
Herbert Hoover Republican |
Norman Mattoon Thomas Socialist |
Margin | Total votes cast[15] | ||||
|---|---|---|---|---|---|---|---|---|---|
| # | % | # | % | # | % | # | % | ||
| Autauga | 883 | 56.39% | 683 | 43.61% | 0 | 0.00% | 200 | 12.78% | 1,566 |
| Baldwin | 1,317 | 48.44% | 1,388 | 51.05% | 14 | 0.51% | -71 | -2.61% | 2,719 |
| Barbour | 1,507 | 63.48% | 845 | 35.59% | 23 | 0.97% | 662 | 27.89% | 2374 |
| Bibb | 1,188 | 54.02% | 1,003 | 45.61% | 8 | 0.36% | 185 | 8.41% | 2,199 |
| Blount | 1,607 | 47.94% | 1,745 | 52.06% | 0 | 0.00% | -138 | -4.12% | 3,352 |
| Bullock | 699 | 73.73% | 249 | 26.27% | 0 | 0.00% | 450 | 47.46% | 948 |
| Butler | 1,235 | 63.86% | 699 | 36.14% | 0 | 0.00% | 536 | 27.72% | 1,934 |
| Calhoun | 2,117 | 45.48% | 2,537 | 54.50% | 1 | 0.02% | -420 | -9.02% | 4,655 |
| Chambers | 999 | 36.58% | 1,732 | 63.42% | 0 | 0.00% | -733 | -26.84% | 2,731 |
| Cherokee | 894 | 37.05% | 1,515 | 62.78% | 4 | 0.17% | -621 | -25.73% | 2,413 |
| Chilton | 1,402 | 30.52% | 3,186 | 69.37% | 5 | 0.11% | -1,784 | -38.85% | 4,593 |
| Choctaw | 1,242 | 74.33% | 429 | 25.67% | 0 | 0.00% | 813 | 48.66% | 1671 |
| Clarke | 1,662 | 63.97% | 936 | 36.03% | 0 | 0.00% | 726 | 27.94% | 2,598 |
| Clay | 978 | 34.10% | 1,889 | 65.86% | 1 | 0.03% | -911 | -31.76% | 2,868 |
| Cleburne | 794 | 41.75% | 1,108 | 58.25% | 0 | 0.00% | -314 | -16.50% | 1,902 |
| Coffee | 1,609 | 60.83% | 1,036 | 39.17% | 0 | 0.00% | 573 | 21.66% | 2,645 |
| Colbert | 2,596 | 65.75% | 1,249 | 31.64% | 103 | 2.61% | 1,347 | 34.11% | 3,948 |
| Conecuh | 858 | 43.53% | 1,113 | 56.47% | 0 | 0.00% | -255 | -12.94% | 1,971 |
| Coosa | 699 | 39.31% | 1,078 | 60.63% | 1 | 0.06% | -379 | -21.32% | 1,778 |
| Covington | 2,000 | 54.26% | 1,681 | 45.60% | 5 | 0.14% | 319 | 8.66% | 3,686 |
| Crenshaw | 1,314 | 57.33% | 978 | 42.67% | 0 | 0.00% | 336 | 14.66% | 2,292 |
| Cullman | 1,574 | 34.72% | 2,959 | 65.28% | 0 | 0.00% | -1,385 | -30.56% | 4,533 |
| Dale | 1,233 | 55.19% | 1,000 | 44.76% | 1 | 0.04% | 233 | 10.43% | 2,234 |
| Dallas | 1,905 | 72.96% | 705 | 27.00% | 1 | 0.04% | 1,200 | 45.96% | 2,611 |
| DeKalb | 3,957 | 40.71% | 5,761 | 59.27% | 2 | 0.02% | -1,804 | -18.56% | 9,720 |
| Elmore | 1,309 | 42.49% | 1,770 | 57.45% | 2 | 0.06% | -461 | -14.96% | 3,081 |
| Escambia | 1,077 | 38.03% | 1,754 | 61.94% | 1 | 0.04% | -677 | -23.91% | 2,832 |
| Etowah | 2,484 | 43.70% | 3,162 | 55.63% | 38 | 0.67% | -678 | -11.93% | 5,684 |
| Fayette | 1,131 | 40.13% | 1,686 | 59.83% | 1 | 0.04% | -555 | -19.70% | 2818 |
| Franklin | 2,279 | 43.64% | 2,937 | 56.24% | 6 | 0.11% | -658 | -12.60% | 5,222 |
| Geneva | 1,485 | 49.20% | 1,533 | 50.80% | 0 | 0.00% | -48 | -1.60% | 3,018 |
| Greene | 601 | 93.91% | 39 | 6.09% | 0 | 0.00% | 562 | 87.82% | 640 |
| Hale | 1,048 | 72.23% | 403 | 27.77% | 0 | 0.00% | 645 | 44.46% | 1,451 |
| Henry | 815 | 50.53% | 796 | 49.35% | 2 | 0.12% | 19 | 1.18% | 1,613 |
| Houston | 2,290 | 53.81% | 1,963 | 46.12% | 3 | 0.07% | 327 | 7.69% | 4,256 |
| Jackson | 2,153 | 41.03% | 3,081 | 58.72% | 13 | 0.25% | -928 | -17.69% | 5,247 |
| Jefferson | 16,735 | 47.94% | 18,060 | 51.74% | 112 | 0.32% | -1,325 | -3.80% | 34,907 |
| Lamar | 1,412 | 63.72% | 804 | 36.28% | 0 | 0.00% | 608 | 27.44% | 2,216 |
| Lauderdale | 2,763 | 67.82% | 1,410 | 34.61% | 1 | 0.02% | 1,353 | 33.21% | 4,074 |
| Lawrence | 1,035 | 50.59% | 1,008 | 49.27% | 3 | 0.15% | 27 | 1.32% | 2,046 |
| Lee | 1,436 | 58.97% | 1,016 | 41.72% | 3 | 0.12% | 420 | 17.25% | 2,435 |
| Limestone | 1,689 | 80.58% | 407 | 19.42% | 0 | 0.00% | 1,282 | 61.16% | 2,096 |
| Lowndes | 703 | 79.61% | 180 | 20.39% | 0 | 0.00% | 523 | 59.22% | 883 |
| Macon | 526 | 59.98% | 348 | 39.68% | 3 | 0.34% | 178 | 20.30% | 877 |
| Madison | 2,681 | 49.85% | 2,695 | 50.11% | 2 | 0.04% | -14 | -0.26% | 5,378 |
| Marengo | 1,898 | 71.62% | 752 | 28.38% | 0 | 0.00% | 1,146 | 43.24% | 2,650 |
| Marion | 1,541 | 50.87% | 1,488 | 49.13% | 0 | 0.00% | 53 | 1.74% | 3,029 |
| Marshall | 2,322 | 47.94% | 2,511 | 51.84% | 11 | 0.23% | -189 | -3.90% | 4,844 |
| Mobile | 5,965 | 54.07% | 5,058 | 45.84% | 10 | 0.09% | 907 | 8.23% | 11,033 |
| Monroe | 1,343 | 57.22% | 1,074 | 45.76% | 0 | 0.00% | 269 | 11.46% | 2,347 |
| Montgomery | 6,347 | 67.06% | 3,114 | 32.90% | 3 | 0.03% | 3,233 | 34.16% | 9,464 |
| Morgan | 3,366 | 45.12% | 4,085 | 54.76% | 9 | 0.12% | -719 | -9.64% | 7,460 |
| Perry | 1,242 | 72.97% | 459 | 26.97% | 1 | 0.06% | 783 | 46.00% | 1,702 |
| Pickens | 1,028 | 61.85% | 634 | 38.15% | 0 | 0.00% | 394 | 23.70% | 1,662 |
| Pike | 1,819 | 76.59% | 552 | 23.24% | 4 | 0.17% | 1,267 | 53.35% | 2,375 |
| Randolph | 1,257 | 40.89% | 1,815 | 59.04% | 2 | 0.07% | -558 | -18.15% | 3,074 |
| Russell | 846 | 70.68% | 333 | 27.82% | 18 | 1.50% | 513 | 42.86% | 1,197 |
| St. Clair | 1,313 | 33.70% | 2,581 | 66.25% | 2 | 0.05% | -1,268 | -32.55% | 3,896 |
| Shelby | 1,679 | 39.95% | 2,502 | 59.53% | 22 | 0.52% | -823 | -19.58% | 4,203 |
| Sumter | 1,015 | 84.16% | 191 | 15.84% | 0 | 0.00% | 824 | 68.32% | 1,206 |
| Talladega | 1,693 | 51.18% | 1,602 | 48.43% | 13 | 0.39% | 91 | 2.75% | 3,308 |
| Tallapoosa | 1,849 | 59.51% | 1,257 | 40.46% | 1 | 0.03% | 592 | 19.05% | 3,107 |
| Tuscaloosa | 2,769 | 69.56% | 1,210 | 30.39% | 2 | 0.05% | 1,559 | 39.17% | 3,981 |
| Walker | 4,228 | 53.77% | 3,635 | 46.23% | 0 | 0.00% | 593 | 7.54% | 7,863 |
| Washington | 718 | 58.18% | 515 | 41.73% | 1 | 0.08% | 203 | 16.45% | 1,234 |
| Wilcox | 979 | 78.57% | 266 | 21.35% | 1 | 0.08% | 713 | 57.22% | 1,246 |
| Winston | 659 | 24.01% | 2,085 | 75.96% | 1 | 0.04% | -1,426 | -51.95% | 2,745 |
| Totals | 127,796 | 51.33% | 120,725 | 48.49% | 460 | 0.18% | 7,071 | 2.84% | 248,981 |
See also edit
Notes edit
- ^ Alabama counties with a 1930 population less than ten percent Negro were Blount, Cherokee, Cleburne, Cullman, DeKalb, Franklin, Jackson, Marion, Marshall and Winston. Cleburne, DeKalb, Franklin and Winston had voted for Calvin Coolidge in 1924, whilst all these four plus Cullman voted for Warren G. Harding in 1920.
References edit
- ^ a b Dave Leip's Atlas of U.S. Presidential Elections; 1928 Presidential General Election Results – Alabama
- ^ Perman, Michael; Struggle for Mastery: Disfranchisement in the South, 1888–1908, Chapel Hill: North Carolina Press, 2001, Introduction.
- ^ Paulson, Arthur C.; Electoral Realignment and the Outlook for American Democracy; p. 61 ISBN 1555536670
- ^ Kennedy; David M. and Cohen, Lizabeth; The American Pageant, Volume 2, p. 739 ISBN 1111831432
- ^ Rappleye; Charles; Herbert Hoover in the White House: The Ordeal of the Presidency, p. 39 ISBN 1451648677
- ^ Feldman, Glenn; Before Brown: Civil Rights and White Backlash in the Modern South; p. 270 ISBN 0817351345
- ^ Feldman, Glenn; Politics, Society, and the Klan in Alabama, 1915-1949; p. 190 ISBN 0817309845
- ^ a b Feldman; Politics, Society and the Klan in Alabama; p. 168.
- ^ Key, V.O. junior; Southern Politics in State and Nation; p. 328 ISBN 087049435X
- ^ Key; Southern Politics in State and Nation; pp. 234, 319.
- ^ Helm, William P. (junior); 'Smith Foes Want Alabama Recount: Assert Southern "Stronghold" Went for Hoover; To Ask Congressional Action – Fraud Evidence Claimed'; The Washington Post, December 12, 1928, p. 2.
- ^ Key; Southern Politics in State and Nation; p. 324.
- ^ Bunche, Ralph J.; The Political Status of the Negro in the Age of FDR, p. 65 ISBN 0226080285
- ^ Gans, Curtis and Mulling, Matthew; Voter Turnout in the United States, 1788-2009, p. 383 ISBN 9781604265958
- ^ Scammon, Richard M. (compiler); America at the Polls: A Handbook of Presidential Election Statistics 1920-1964; pp. 27–28 ISBN 0405077114