


Summary
The 1928 United States presidential election in North Dakota took place on November 6, 1928, as part of the 1928 United States presidential election which was held throughout all contemporary 48 states. Voters chose five representatives, or electors to the Electoral College, who voted for president and vice president.
| ||||||||||||||||||||||||||
| ||||||||||||||||||||||||||
 County Results
| ||||||||||||||||||||||||||
| ||||||||||||||||||||||||||
Ever since statehood, North Dakota had been overwhelmingly Republican at state level and in many presidential elections,[1] although progressive Democrat Woodrow Wilson was able to carry the state in both his campaigns in 1912 and 1916, in the second due to his anti-war platform. In the following two elections, the state’s voting would be shaped by its extreme isolationism in the aftermath of President Wilson’s pushing of the nation into World War I and his “League of Nations” proposal, to which the Russian-Germans who dominated North Dakota’s populace were vehemently opposed.[2] To North Dakota’s predominantly German-American populace, Wilson’s entry into the war and his support for the Treaty of Versailles was a betrayal, and farmers were also faced with a postwar agricultural depression as prices fell with reduced demand in Europe.[3] Consequently, North Dakota went for the isolationist Republican Warren G. Harding over the pro-League Democrat James M. Cox by four-to-one in 1920. In 1924, Robert M. La Follette under the Nonpartisan League banner attracted North Dakota’s isolationist electorate so strongly that he went within two percentage points of carrying the state. When La Follette died in 1925, his family did not endorse a Republican, but rather New York City Catholic Democrat Al Smith.[4]
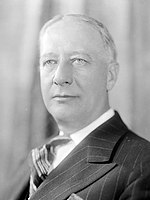
Despite much antagonism with the Catholic Church amongst the German and Scandinavian Lutherans in North Dakota,[5] Smith would capitalise extremely well upon La Folette’s endorsement, due to the state being the most Catholic in the Midwest and a concurrent statewide repeal of Prohibition with the election,[6] further adding to support for the “wet” Smith. The local press in mid-September believed Smith would carry North Dakota.[7] and he later received further endorsement from the Nonpartisan League[8] despite opposition from Senators Lynn J. Frazier and Gerald P. Nye. Smith visited the state during his midwestern tour in late September and early October,[9] but during October the lessened unpopularity with farmers of Republican nominee Herbert Hoover’s led pundits to imagine the GOP would retain the state.[10]
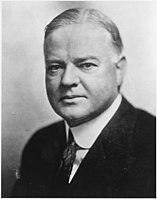
In the days leading up to the actual poll, forecasts suggested Hoover would retain North Dakota for the GOP, and he did this by a margin of 10.33 percent. Despite losing the state, Smith made a massive advance upon James M. Cox’ and John W. Davis’ performances earlier in the decade. Whereas North Dakota had been Cox’ and Davis’ second-weakest state in 1920 and 1924, it voted 7.07 points more Democratic than the nation at-large in 1928. In some counties that were largely Lutheran, Smith still made tremendous gains because of his opposition to Prohibition,[5] which was powerfully opposed by liturgical German Lutherans. This allowed Smith to become the first Democrat to carry McIntosh County – which had been the nation’s most Republican county in 1920[11] and where no Democrat had previously gained over 22 percent of the vote – Logan County, Mercer County, Morton County and Sioux County.[12]
Results edit
| Presidential Candidate | Running Mate | Party | Electoral Vote (EV) | Popular Vote (PV) | |
|---|---|---|---|---|---|
| Herbert Hoover of California | Charles Curtis | Republican | 5[13] | 131,441 | 54.80% |
| Al Smith | Joseph T. Robinson | Democratic | 0 | 106,648 | 44.46% |
| Norman Thomas | James Maurer | Social Production and Distribution | 0 | 936 | 0.39% |
| William Z. Foster | Benjamin Gitlow | Workers’ and Farmers’ Government | 0 | 842 | 0.35% |
Results by county edit
| County[14] | Herbert Clark Hoover Republican |
Alfred Emmanuel Smith Democratic |
Norman Mattoon Thomas Social Production and Distribution |
William Z. Foster Workers’ and Farmers’ Government |
Margin | Total votes cast | |||||
|---|---|---|---|---|---|---|---|---|---|---|---|
| # | % | # | % | # | % | # | % | # | % | ||
| Adams | 1,590 | 70.67% | 644 | 28.62% | 13 | 0.58% | 3 | 0.13% | 946 | 42.04% | 2,250 |
| Barnes | 3,755 | 53.01% | 3,293 | 46.49% | 15 | 0.21% | 20 | 0.28% | 462 | 6.52% | 7,083 |
| Benson | 2,621 | 53.80% | 2,194 | 45.03% | 13 | 0.27% | 44 | 0.90% | 427 | 8.76% | 4,872 |
| Billings | 458 | 52.22% | 412 | 46.98% | 6 | 0.68% | 1 | 0.11% | 46 | 5.25% | 877 |
| Bottineau | 2,680 | 49.79% | 2,648 | 49.19% | 13 | 0.24% | 42 | 0.78% | 32 | 0.59% | 5,383 |
| Bowman | 1,031 | 54.99% | 821 | 43.79% | 12 | 0.64% | 11 | 0.59% | 210 | 11.20% | 1,875 |
| Burke | 2,002 | 58.38% | 1,336 | 38.96% | 70 | 2.04% | 21 | 0.61% | 666 | 19.42% | 3,429 |
| Burleigh | 3,955 | 55.59% | 3,076 | 43.23% | 68 | 0.96% | 16 | 0.22% | 879 | 12.35% | 7,115 |
| Cass | 12,480 | 66.18% | 6,315 | 33.49% | 14 | 0.07% | 49 | 0.26% | 6,165 | 32.69% | 18,858 |
| Cavalier | 3,068 | 54.86% | 2,510 | 44.89% | 11 | 0.20% | 3 | 0.05% | 558 | 9.98% | 5,592 |
| Dickey | 2,250 | 52.90% | 1,977 | 46.48% | 11 | 0.26% | 15 | 0.35% | 273 | 6.42% | 4,253 |
| Divide | 1,963 | 60.36% | 1,250 | 38.44% | 25 | 0.77% | 14 | 0.43% | 713 | 21.92% | 3,252 |
| Dunn | 1,360 | 46.50% | 1,561 | 53.37% | 4 | 0.14% | 0 | 0.00% | -201 | -6.87% | 2,925 |
| Eddy | 1,071 | 46.12% | 1,240 | 53.40% | 9 | 0.39% | 2 | 0.09% | -169 | -7.28% | 2,322 |
| Emmons | 1,792 | 46.25% | 2,066 | 53.32% | 12 | 0.31% | 5 | 0.13% | -274 | -7.07% | 3,875 |
| Foster | 1,137 | 48.99% | 1,178 | 50.75% | 5 | 0.22% | 1 | 0.04% | -41 | -1.77% | 2,321 |
| Golden Valley | 937 | 63.78% | 522 | 35.53% | 4 | 0.27% | 6 | 0.41% | 415 | 28.25% | 1,469 |
| Grand Forks | 8,024 | 64.86% | 4,300 | 34.76% | 15 | 0.12% | 32 | 0.26% | 3,724 | 30.10% | 12,371 |
| Grant | 1,759 | 54.59% | 1,434 | 44.51% | 14 | 0.43% | 15 | 0.47% | 325 | 10.09% | 3,222 |
| Griggs | 1,329 | 52.45% | 1,182 | 46.65% | 13 | 0.51% | 10 | 0.39% | 147 | 5.80% | 2,534 |
| Hettinger | 1,553 | 53.87% | 1,323 | 45.89% | 4 | 0.14% | 3 | 0.10% | 230 | 7.98% | 2,883 |
| Kidder | 1,200 | 49.94% | 1,190 | 49.52% | 6 | 0.25% | 7 | 0.29% | 10 | 0.42% | 2,403 |
| LaMoure | 2,245 | 55.00% | 1,800 | 44.10% | 16 | 0.39% | 21 | 0.51% | 445 | 10.90% | 4,082 |
| Logan | 1,013 | 43.64% | 1,293 | 55.71% | 14 | 0.60% | 1 | 0.04% | -280 | -12.06% | 2,321 |
| McHenry | 2,914 | 53.04% | 2,535 | 46.14% | 21 | 0.38% | 24 | 0.44% | 379 | 6.90% | 5,494 |
| McIntosh | 1,196 | 44.79% | 1,474 | 55.21% | 0 | 0.00% | 0 | 0.00% | -278 | -10.41% | 2,670 |
| McKenzie | 2,100 | 61.14% | 1,289 | 37.53% | 35 | 1.02% | 11 | 0.32% | 811 | 23.61% | 3,435 |
| McLean | 2,730 | 47.51% | 2,855 | 49.69% | 21 | 0.37% | 140 | 2.44% | -125 | -2.18% | 5,746 |
| Mercer | 971 | 37.45% | 1,619 | 62.44% | 3 | 0.12% | 0 | 0.00% | -648 | -24.99% | 2,593 |
| Morton | 2,881 | 42.04% | 3,946 | 57.58% | 17 | 0.25% | 9 | 0.13% | -1,065 | -15.54% | 6,853 |
| Mountrail | 2,354 | 52.30% | 2,003 | 44.50% | 108 | 2.40% | 36 | 0.80% | 351 | 7.80% | 4,501 |
| Nelson | 2,364 | 60.18% | 1,542 | 39.26% | 11 | 0.28% | 11 | 0.28% | 822 | 20.93% | 3,928 |
| Oliver | 680 | 51.67% | 631 | 47.95% | 4 | 0.30% | 1 | 0.08% | 49 | 3.72% | 1,316 |
| Pembina | 3,324 | 60.75% | 2,141 | 39.13% | 7 | 0.13% | 0 | 0.00% | 1,183 | 21.62% | 5,472 |
| Pierce | 1,469 | 47.60% | 1,606 | 52.04% | 5 | 0.16% | 6 | 0.19% | -137 | -4.44% | 3,086 |
| Ramsey | 3,246 | 54.62% | 2,672 | 44.96% | 8 | 0.13% | 17 | 0.29% | 574 | 9.66% | 5,943 |
| Ransom | 2,613 | 60.43% | 1,505 | 34.81% | 198 | 4.58% | 8 | 0.19% | 1,108 | 25.62% | 4,324 |
| Renville | 1,473 | 55.09% | 1,174 | 43.90% | 15 | 0.56% | 12 | 0.45% | 299 | 11.18% | 2,674 |
| Richland | 4,251 | 53.89% | 3,604 | 45.68% | 15 | 0.19% | 19 | 0.24% | 647 | 8.20% | 7,889 |
| Rolette | 1,327 | 37.50% | 2,181 | 61.63% | 12 | 0.34% | 19 | 0.54% | -854 | -24.13% | 3,539 |
| Sargent | 1,772 | 46.88% | 1,989 | 52.62% | 11 | 0.29% | 8 | 0.21% | -217 | -5.74% | 3,780 |
| Sheridan | 1,242 | 56.61% | 944 | 43.03% | 1 | 0.05% | 7 | 0.32% | 298 | 13.58% | 2,194 |
| Sioux | 687 | 40.46% | 988 | 58.19% | 14 | 0.82% | 9 | 0.53% | -301 | -17.73% | 1,698 |
| Slope | 873 | 60.88% | 542 | 37.80% | 10 | 0.70% | 9 | 0.63% | 331 | 23.08% | 1,434 |
| Stark | 1,924 | 37.28% | 3,231 | 62.60% | 4 | 0.08% | 2 | 0.04% | -1,307 | -25.32% | 5,161 |
| Steele | 1,574 | 57.34% | 1,152 | 41.97% | 6 | 0.22% | 13 | 0.47% | 422 | 15.37% | 2,745 |
| Stutsman | 4,782 | 55.07% | 3,873 | 44.60% | 16 | 0.18% | 13 | 0.15% | 909 | 10.47% | 8,684 |
| Towner | 1,588 | 54.23% | 1,324 | 45.22% | 12 | 0.41% | 4 | 0.14% | 264 | 9.02% | 2,928 |
| Traill | 3,638 | 71.36% | 1,447 | 28.38% | 5 | 0.10% | 8 | 0.16% | 2,191 | 42.98% | 5,098 |
| Walsh | 3,657 | 48.94% | 3,798 | 50.83% | 8 | 0.11% | 9 | 0.12% | -141 | -1.89% | 7,472 |
| Ward | 6,561 | 59.72% | 4,362 | 39.71% | 22 | 0.20% | 41 | 0.37% | 2,199 | 20.02% | 10,986 |
| Wells | 2,364 | 52.39% | 2,123 | 47.05% | 18 | 0.40% | 7 | 0.16% | 241 | 5.34% | 4,512 |
| Williams | 3,591 | 57.25% | 2,503 | 39.91% | 121 | 1.93% | 57 | 0.91% | 1,088 | 17.35% | 6,272 |
| Totals | 131,419 | 54.79% | 106,648 | 44.47% | 936 | 0.39% | 842 | 0.35% | 24,771 | 10.33% | 239,845 |
See also edit
References edit
- ^ Hansen, John Mark; Shigeo Hirano, and Snyder, James M. Jr.; ‘Parties within Parties: Parties, Factions, and Coordinated Politics, 1900-1980’; in Gerber, Alan S. and Schickler, Eric; Governing in a Polarized Age: Elections, Parties, and Political Representation in America, pp. 143-159 ISBN 978-1-107-09509-0
- ^ Lubell, Samuel; The Future of American Politics (1956), pp. 156-164
- ^ Phillips, Kevin P.; The Emerging Republican Majority, pp. 420-423 ISBN 978-0-691-16324-6
- ^ Menendez, Albert J.; The Geography of Presidential Elections in the United States, 1868-2004, p. 59 ISBN 0786422173
- ^ a b Stange, Douglas C.; ‘Al Smith and the Republican Party at Prayer: The Lutheran Vote. 1928’, The Review of Politics, Vol. 32, No. 3 (July 1970), pp. 347-364
- ^ Okrent, David; Last Call: The Rise and Fall of Prohibition, p. 309 ISBN 9781464023255
- ^ ‘Reports Progressive Swing to Smith: P.M. Hanson, North Dakota Editor, Says Hoover Will Lose by Vote in That State’; New York Times, September 15, 1928, p. 3
- ^ Gableman, Edwin W.; ‘Gov. Maddock Helps Smith in North Dakota: Nonpartisan Leaguers Are Strong for Governor, He Declares’; The Washington Post, September 27, 1928, p. 1
- ^ ‘North Dakota Wets Big Asset to Smith: State Now Apparently in Line for New York Governor; Hoover Whisper Target. Silence Is Hurting Him’; The Washington Post, October 1, 1928, p. 3
- ^ Oulahan, Richard V.; ‘Hoover Hope Rises in North Dakota: Lessening of His Unpopularity With Farmers Dispels Backers' Gloom of Two Weeks Ago’; New York Times, October 12, 1928, p. 19
- ^ "David Leip's Election Atlas statistics for 1920". Dave Leip’s U.S. Election Atlas.
- ^ Menendez; Geography of Presidential Elections in the United States, pp. 271-273
- ^ "1928 Presidential General Election Results – North Dakota". Dave Leip’s U.S. Election Atlas. Retrieved December 23, 2013.
- ^ "ND US President Race, November 06, 1928". Our Campaigns.