


Summary
The 1928 United States presidential election in Tennessee took place on November 6, 1928, as part of the 1928 United States presidential election. Tennessee voters chose 12 representatives, or electors, to the Electoral College, who voted for president and vice president.
| ||||||||||||||||||||||||||
All 12 Tennessee votes to the Electoral College | ||||||||||||||||||||||||||
|---|---|---|---|---|---|---|---|---|---|---|---|---|---|---|---|---|---|---|---|---|---|---|---|---|---|---|
| ||||||||||||||||||||||||||
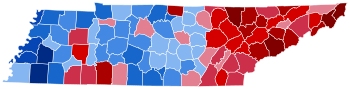 County Results
| ||||||||||||||||||||||||||
| ||||||||||||||||||||||||||
For over a century after the Civil War, Tennessee was divided according to political loyalties established in that war. Unionist regions covering almost all of East Tennessee, Kentucky Pennyroyal-allied Macon County, and the five West Tennessee Highland Rim counties of Carroll, Henderson, McNairy, Hardin and Wayne[1] voted Republican – generally by landslide margins – as they saw the Democratic Party as the "war party" who had forced them into a war they did not wish to fight.[2] Contrariwise, the rest of Middle and West Tennessee who had supported and driven the state's secession was equally fiercely Democratic as it associated the Republicans with Reconstruction.[3] After the disfranchisement of the state's African-American population by a poll tax was largely complete in the 1890s,[4] the Democratic Party was certain of winning statewide elections if united,[5] although unlike the Deep South Republicans would almost always gain thirty to forty percent of the statewide vote from mountain and Highland Rim support. When the Democratic Party was bitterly divided, the Republicans did win the governorship in 1910 and 1912, but did not gain at other levels.
The 1920 election saw a significant but not radical change, whereby by moving into a small number of traditionally Democratic areas in Middle Tennessee[6] and expanding turnout due to the Nineteenth Amendment and powerful isolationist sentiment,[7] the Republican Party was able to capture Tennessee's presidential electoral votes and win the governorship and take three congressional seats in addition to the rock-ribbed GOP First and Second Districts. In 1922 and 1924, with the ebbing of isolationist sympathy and a consequent decline in turnout,[8] the Democratic Party regained Tennessee's governorship and presidential electoral votes.
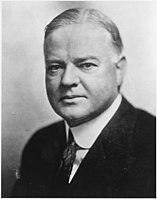
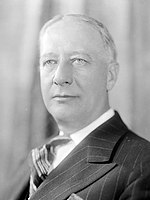
Early in the campaign, Tennessee was seen as a "puzzle" for political pundits, and the state was viewed as "doubtful".[9] Smith made a major battleground of Tennessee in his October campaign after Republican nominee Herbert Hoover visited earlier in the month and was confident of carrying Tennessee,[10] criticising Hoover's campaign as "vague".[11]
By the beginning of November it was thought by pollsters that Smith would carry the state,[12] but as it turned out the state's votes went quite clearly to Hoover, despite the powerful Democratic loyalty of whites in West Tennessee.[13] Hoover benefitted from a substantial Republican trend in normally rock-ribbed Democratic but heavily white counties of Middle Tennessee. Although Hoover managed to flip only Houston County – where he was the only Republican victor until Mitt Romney in 2012[14] – and heavily populated Davidson and "Little Confederacy" Sullivan Counties where he was the first Republican victor since Ulysses S. Grant in 1868,[14] due to a powerful Prohibitionist anti-Catholic vote he gained very strongly compared to Coolidge's 1924 showing in many white counties that remained Democratic,[15] and this added to the mountain and Highland Rim GOP vote ensured Hoover won the state.
This would be the best Republican performance in Tennessee between Grant's 36.85% 1868 landslide and Richard Nixon's carrying the state by 37.95% in 1972.[16] Tennessee would not vote Republican again until Dwight Eisenhower narrowly won the state in 1952.
Results edit
| Presidential Candidate | Running Mate | Party | Electoral Vote (EV) | Popular Vote (PV) | |
|---|---|---|---|---|---|
| Herbert Hoover | Charles Curtis | Republican | 12[17] | 195,388 | 53.76% |
| Al Smith | Joseph Taylor Robinson | Democratic | 0 | 167,343[a] | 46.04% |
| Norman Thomas | James Maurer | Socialist | 0 | 631 | 0.17% |
| William Z. Foster | Benjamin Gitlow | Communist | 0 | 111 | 0.03% |
Results by county edit
| 1928 United States presidential election in Tennessee by county[18][b] | |||||||||
|---|---|---|---|---|---|---|---|---|---|
| County | Herbert Clark Hoover Republican |
Alfred Emmanuel Smith Democratic |
Various candidates Other parties |
Margin | Total votes cast | ||||
| # | % | # | % | # | % | # | % | ||
| Anderson | 2,306 | 81.11% | 537 | 18.89% | 0 | 0.00% | 1,769 | 62.22% | 2,843 |
| Bedford | 1,405 | 47.84% | 1,532 | 52.16% | 0 | 0.00% | -127 | -4.32% | 2,937 |
| Benton | 949 | 43.08% | 1,241 | 56.33% | 13 | 0.59% | -292 | -13.25% | 2,203 |
| Bledsoe | 899 | 59.97% | 600 | 40.03% | 0 | 0.00% | 299 | 19.95% | 1,499 |
| Blount | 4,135 | 85.17% | 715 | 14.73% | 5 | 0.10% | 3,420 | 70.44% | 4,855 |
| Bradley | 2,854 | 75.70% | 913 | 24.22% | 3 | 0.08% | 1,941 | 51.49% | 3,770 |
| Campbell | 3,007 | 83.60% | 585 | 16.26% | 5 | 0.14% | 2,422 | 67.33% | 3,597 |
| Cannon | 588 | 48.60% | 622 | 51.40% | 0 | 0.00% | -34 | -2.81% | 1,210 |
| Carroll | 2,987 | 62.87% | 1,743 | 36.69% | 21 | 0.44% | 1,244 | 26.18% | 4,751 |
| Carter | 4,934 | 90.37% | 512 | 9.38% | 14 | 0.26% | 4,422 | 80.99% | 5,460 |
| Cheatham | 488 | 34.78% | 913 | 65.07% | 2 | 0.14% | -425 | -30.29% | 1,403 |
| Chester | 588 | 44.44% | 735 | 55.56% | 0 | 0.00% | -147 | -11.11% | 1,323 |
| Claiborne | 2,565 | 67.68% | 1,225 | 32.32% | 0 | 0.00% | 1,340 | 35.36% | 3,790 |
| Clay | 556 | 49.03% | 576 | 50.79% | 2 | 0.18% | -20 | -1.76% | 1,134 |
| Cocke | 2,909 | 80.05% | 722 | 19.87% | 3 | 0.08% | 2,187 | 60.18% | 3,634 |
| Coffee | 1,126 | 48.72% | 1,175 | 50.84% | 10 | 0.43% | -49 | -2.12% | 2,311 |
| Crockett | 710 | 48.66% | 749 | 51.34% | 0 | 0.00% | -39 | -2.67% | 1,459 |
| Cumberland | 1,188 | 70.09% | 507 | 29.91% | 0 | 0.00% | 681 | 40.18% | 1,695 |
| Davidson | 15,359 | 53.26% | 13,453 | 46.65% | 27 | 0.09% | 1,906 | 6.61% | 28,839 |
| Decatur | 748 | 47.95% | 812 | 52.05% | 0 | 0.00% | -64 | -4.10% | 1,560 |
| DeKalb | 2,261 | 57.23% | 1,690 | 42.77% | 0 | 0.00% | 571 | 14.45% | 3,951 |
| Dickson | 891 | 38.42% | 1,428 | 61.58% | 0 | 0.00% | -537 | -23.16% | 2,319 |
| Dyer | 842 | 24.04% | 2,661 | 75.96% | 0 | 0.00% | -1,819 | -51.93% | 3,503 |
| Fayette | 122 | 9.98% | 1,100 | 90.02% | 0 | 0.00% | -978 | -80.03% | 1,222 |
| Fentress | 1,399 | 78.07% | 375 | 20.93% | 18 | 1.00% | 1,024 | 57.14% | 1,792 |
| Franklin | 928 | 35.26% | 1,698 | 64.51% | 6 | 0.23% | -770 | -29.26% | 2,632 |
| Gibson | 1,372 | 31.97% | 2,911 | 67.84% | 8 | 0.19% | -1,539 | -35.87% | 4,291 |
| Giles | 1,032 | 27.94% | 2,661 | 72.06% | 0 | 0.00% | -1,629 | -44.11% | 3,693 |
| Grainger | 1,464 | 75.39% | 466 | 24.00% | 12 | 0.62% | 998 | 51.39% | 1,942 |
| Greene | 3,599 | 61.04% | 2,297 | 38.96% | 0 | 0.00% | 1,302 | 22.08% | 5,896 |
| Grundy | 380 | 38.31% | 608 | 61.29% | 4 | 0.40% | -228 | -22.98% | 992 |
| Hamblen | 1,902 | 59.96% | 1,270 | 40.04% | 0 | 0.00% | 632 | 19.92% | 3,172 |
| Hamilton | 13,244 | 64.49% | 7,190 | 35.01% | 103 | 0.50% | 6,054 | 29.48% | 20,537 |
| Hancock | 1,039 | 82.79% | 216 | 17.21% | 0 | 0.00% | 823 | 65.58% | 1,255 |
| Hardeman | 491 | 25.05% | 1,459 | 74.44% | 10 | 0.51% | -968 | -49.39% | 1,960 |
| Hardin | 1,585 | 68.88% | 709 | 30.81% | 7 | 0.30% | 876 | 38.07% | 2,301 |
| Hawkins | 2,969 | 71.28% | 1,190 | 28.57% | 6 | 0.14% | 1,779 | 42.71% | 4,165 |
| Haywood | 178 | 8.08% | 2,024 | 91.92% | 0 | 0.00% | -1,846 | -83.83% | 2,202 |
| Henderson | 2,005 | 72.86% | 714 | 25.94% | 33 | 1.20% | 1,291 | 46.91% | 2,752 |
| Henry | 1,041 | 28.04% | 2,667 | 71.83% | 5 | 0.13% | -1,626 | -43.79% | 3,713 |
| Hickman | 511 | 32.97% | 1,039 | 67.03% | 0 | 0.00% | -528 | -34.06% | 1,550 |
| Houston | 374 | 59.18% | 258 | 40.82% | 0 | 0.00% | 116 | 18.35% | 632 |
| Humphreys | 441 | 36.21% | 771 | 63.30% | 6 | 0.49% | -330 | -27.09% | 1,218 |
| Jackson | 617 | 42.14% | 832 | 56.83% | 15 | 1.02% | -215 | -14.69% | 1,464 |
| Jefferson | 2,582 | 85.53% | 437 | 14.47% | 0 | 0.00% | 2,145 | 71.05% | 3,019 |
| Johnson | 3,057 | 93.74% | 196 | 6.01% | 8 | 0.25% | 2,861 | 87.73% | 3,261 |
| Knox | 14,627 | 71.57% | 5,767 | 28.22% | 44 | 0.22% | 8,860 | 43.35% | 20,438 |
| Lake | 166 | 14.74% | 960 | 85.26% | 0 | 0.00% | -794 | -70.52% | 1,126 |
| Lauderdale | 430 | 13.32% | 2,798 | 86.68% | 0 | 0.00% | -2,368 | -73.36% | 3,228 |
| Lawrence | 3,581 | 56.19% | 2,780 | 43.62% | 12 | 0.19% | 801 | 12.57% | 6,373 |
| Lewis | 269 | 39.39% | 414 | 60.61% | 0 | 0.00% | -145 | -21.23% | 683 |
| Lincoln | 743 | 23.76% | 2,377 | 76.02% | 7 | 0.22% | -1,634 | -52.25% | 3,127 |
| Loudon | 2,128 | 78.26% | 590 | 21.70% | 1 | 0.04% | 1,538 | 56.56% | 2,719 |
| Macon | 1,937 | 82.22% | 419 | 17.78% | 0 | 0.00% | 1,518 | 64.43% | 2,356 |
| Madison | 1,894 | 34.62% | 3,577 | 65.38% | 0 | 0.00% | -1,683 | -30.76% | 5,471 |
| Marion | 1,659 | 58.83% | 1,161 | 41.17% | 0 | 0.00% | 498 | 17.66% | 2,820 |
| Marshall | 735 | 31.69% | 1,584 | 68.31% | 0 | 0.00% | -849 | -36.61% | 2,319 |
| Maury | 1,362 | 27.16% | 3,652 | 72.84% | 0 | 0.00% | -2,290 | -45.67% | 5,014 |
| McMinn | 4,440 | 68.51% | 2,025 | 31.25% | 16 | 0.25% | 2,415 | 37.26% | 6,481 |
| McNairy | 2,326 | 65.80% | 1,209 | 34.20% | 0 | 0.00% | 1,117 | 31.60% | 3,535 |
| Meigs | 722 | 55.07% | 589 | 44.93% | 0 | 0.00% | 133 | 10.14% | 1,311 |
| Monroe | 3,312 | 61.99% | 2,031 | 38.01% | 0 | 0.00% | 1,281 | 23.98% | 5,343 |
| Montgomery | 1,748 | 48.34% | 1,868 | 51.66% | 0 | 0.00% | -120 | -3.32% | 3,616 |
| Moore | 133 | 23.29% | 431 | 75.48% | 7 | 1.23% | -298 | -52.19% | 571 |
| Morgan | 1,487 | 76.93% | 446 | 23.07% | 0 | 0.00% | 1,041 | 53.85% | 1,933 |
| Obion | 789 | 24.05% | 2,492 | 75.95% | 0 | 0.00% | -1,703 | -51.90% | 3,281 |
| Overton | 1,195 | 51.80% | 1,105 | 47.90% | 7 | 0.30% | 90 | 3.90% | 2,307 |
| Perry | 360 | 36.66% | 622 | 63.34% | 0 | 0.00% | -262 | -26.68% | 982 |
| Pickett | 745 | 65.64% | 383 | 33.74% | 7 | 0.62% | 362 | 31.89% | 1,135 |
| Polk | 1,760 | 63.22% | 1,012 | 36.35% | 12 | 0.43% | 748 | 26.87% | 2,784 |
| Putnam | 1,612 | 42.91% | 2,145 | 57.09% | 0 | 0.00% | -533 | -14.19% | 3,757 |
| Rhea | 1,588 | 65.24% | 846 | 34.76% | 0 | 0.00% | 742 | 30.48% | 2,434 |
| Roane | 2,971 | 79.14% | 761 | 20.27% | 22 | 0.59% | 2,210 | 58.87% | 3,754 |
| Robertson | 848 | 35.30% | 1,543 | 64.24% | 11 | 0.46% | -695 | -28.93% | 2,402 |
| Rutherford | 1,429 | 40.32% | 2,115 | 59.68% | 0 | 0.00% | -686 | -19.36% | 3,544 |
| Scott | 2,700 | 91.59% | 244 | 8.28% | 4 | 0.14% | 2,456 | 83.31% | 2,948 |
| Sequatchie | 298 | 43.76% | 383 | 56.24% | 0 | 0.00% | -85 | -12.48% | 681 |
| Sevier | 3,874 | 92.57% | 308 | 7.36% | 3 | 0.07% | 3,566 | 85.21% | 4,185 |
| Shelby | 11,969 | 39.76% | 18,040 | 59.93% | 92 | 0.31% | -6,071 | -20.17% | 30,101 |
| Smith | 1,150 | 44.13% | 1,446 | 55.49% | 10 | 0.38% | -296 | -11.36% | 2,606 |
| Stewart | 403 | 24.28% | 1,257 | 75.72% | 0 | 0.00% | -854 | -51.45% | 1,660 |
| Sullivan | 4,151 | 56.35% | 3,216 | 43.65% | 0 | 0.00% | 935 | 12.69% | 7,367 |
| Sumner | 1,045 | 29.12% | 2,541 | 70.80% | 3 | 0.08% | -1,496 | -41.68% | 3,589 |
| Tipton | 425 | 18.25% | 1,889 | 81.11% | 15 | 0.64% | -1,464 | -62.86% | 2,329 |
| Trousdale | 179 | 22.74% | 607 | 77.13% | 1 | 0.13% | -428 | -54.38% | 787 |
| Unicoi | 2,044 | 84.22% | 376 | 15.49% | 7 | 0.29% | 1,668 | 68.73% | 2,427 |
| Union | 1,826 | 83.30% | 360 | 16.42% | 6 | 0.27% | 1,466 | 66.88% | 2,192 |
| Van Buren | 257 | 49.71% | 260 | 50.29% | 0 | 0.00% | -3 | -0.58% | 517 |
| Warren | 923 | 45.13% | 1,112 | 54.38% | 10 | 0.49% | -189 | -9.24% | 2,045 |
| Washington | 4,889 | 75.99% | 1,545 | 24.01% | 0 | 0.00% | 3,344 | 51.97% | 6,434 |
| Wayne | 1,756 | 81.71% | 382 | 17.78% | 11 | 0.51% | 1,374 | 63.94% | 2,149 |
| Weakley | 1,358 | 35.25% | 2,495 | 64.75% | 0 | 0.00% | -1,137 | -29.51% | 3,853 |
| White | 776 | 43.16% | 1,022 | 56.84% | 0 | 0.00% | -246 | -13.68% | 1,798 |
| Williamson | 693 | 30.20% | 1,595 | 69.50% | 7 | 0.31% | -902 | -39.30% | 2,295 |
| Wilson | 1,049 | 39.17% | 1,629 | 60.83% | 0 | 0.00% | -580 | -21.66% | 2,678 |
| Totals | 195,388 | 55.32% | 157,143[a] | 44.49% | 661 | 0.19% | 38,245 | 10.83% | 353,192 |
Analysis edit
Scopes Trial and a Catholic Nominated by the Democrats edit
In 1925, Tennessee gained national prominence due to the "Scopes Monkey Trial" which aimed to outlaw the teaching of evolution in this powerfully fundamentalist Protestant state with a strong Ku Klux Klan,[19] and a populace extremely hostile to the Catholic faith of most urban immigrants.[20]
However, with most other Democrats sitting the 1928 election out due to the prevailing prosperity,[21] the nomination of Catholic New York Governor Al Smith was always a foregone conclusion from the beginning of the election campaign. Once Smith was nominated – despite his attempt to dispel fears by nominating "dry" Southern Democrat Joseph T. Robinson as his running mate[22] – extreme fear ensued in the South, which had no experience of the Southern and Eastern European Catholic immigrants who were Smith's local constituency. Southern fundamentalist Protestants believed that Smith would allow papal and priestly leadership in the United States, which Protestantism was a reaction against.[23]
Nevertheless, fear that the Republicans would place the heavily black regions of West Tennessee under the influence of "Negro bossism" and possible abolition of lynching meant that whites in the far western region remained all along extremely loyal to Smith[13] although in East Tennessee where many communities had become sundown towns or counties[24] it was believed that Smith was unacceptable because the Catholic Church officially opposed social and political segregation of the races.[25]
Notes edit
References edit
- ^ Wright, John K.; 'Voting Habits in the United States: A Note on Two Maps'; Geographical Review, vol. 22, no. 4 (October 1932), pp. 666-672
- ^ Key (Jr.), Valdimer Orlando; Southern Politics in State and Nation (New York, 1949), pp. 282-283
- ^ Lyons, William; Scheb (II), John M. and Stair Billy; Government and Politics in Tennessee, pp. 183-184 ISBN 1572331410
- ^ Phillips, Kevin P.; The Emerging Republican Majority, pp. 208, 210 ISBN 9780691163246
- ^ Grantham, Dewey W.; 'Tennessee and Twentieth-Century American Politics'; Tennessee Historical Quarterly, Vol. 54, No. 3 (Fall 1995), pp. 210-229
- ^ Reichard, Gary W.; 'The Aberration of 1920: An Analysis of Harding's Victory in Tennessee'; The Journal of Southern History, Vol. 36, No. 1 (February 1970), pp. 33-49
- ^ Phillips; The Emerging Republican Majority, p. 211
- ^ Phillips; The Emerging Republican Majority, p. 287
- ^ 'Tennessee a Puzzle in Political Trend: Wide Organization of Women's Hoover Clubs Is Big Factor in Situation'; The New York Times, September 24, 1928, p. 3
- ^ 'Hoover Confident of Southern Gains: Believes Tennessee Speech Has Aided Cause; Passes Quiet Day in Capital'; The Washington Post,
- ^ 'Smith Challenges Hoover to State Views Clearly; Gets Tennessee Ovations'; The New York Times, October 13, 1928, p. 1
- ^ Howland, William S.; 'Smith Fairly Certain to Win Tennessee: Shift of Entire Woman's Vote Alone May Turn Tide to Hoover'; The Washington Post, November 4, 1928, p. M5
- ^ a b McCarthy, G. Michael; 'Smith v Hoover – The Politics of Race in West Tennessee'; Phylon, Vol. 39, No. 2 (2nd Quarter, 1978), pp. 154-168
- ^ a b Menendez, Albert J.; The Geography of Presidential Elections in the United States, 1868-2004, pp. 298-303 ISBN 0786422173
- ^ Phillips; The Emerging Republican Majority, p. 212
- ^ "Presidential General Election Results Comparison – Tennessee". Dave Leip's U.S. Ekeciton Atlas.
- ^ "1928 Presidential General Election Results – Tennessee". Dave Leip's U.S. Election Atlas.
- ^ Scammon, Richard M. (compiler); America at the Polls: A Handbook of Presidential Election Statistics 1920-1964; pp. 415-416 ISBN 0405077114
- ^ Larson, Edward J.; Summer for the Gods: The Scopes Trial and America's Continuing Debate over Science and Religion ISBN 9780465075102
- ^ Whitfield, Stephen J.; '"One Nation Under God": The Rise of the Religious Right'; The Virginia Quarterly Review, Vol. 58, No. 4 (Autumn 1982), pp. 557-574
- ^ Warren, Kenneth F.; Encyclopedia of U.S. campaigns, elections, and electoral behavior: A-M, Volume 1, p. 620 ISBN 1412954894
- ^ Nelson, Michael (1991); Historic documents on presidential elections, 1787-1988, p. 296
- ^ Whisenhunt, Donald W.; President Herbert Hoover, p. 69 ISBN 1600214762
- ^ Loewen, James A.; Sundown Towns: A Hidden Dimension of American Racism, pp. 72-74 ISBN 0743294483
- ^ Moore, Edmund A. A Catholic Runs For President (New York, 1956) p. 157