Summary
The 1936 United States presidential election in Nevada took place on November 3, 1936, as part of the 1936 United States presidential election. State voters chose three[2] representatives, or electors, to the Electoral College, who voted for president and vice president.
| ||||||||||||||||||||||||||
All 3 Nevada votes to the Electoral College | ||||||||||||||||||||||||||
|---|---|---|---|---|---|---|---|---|---|---|---|---|---|---|---|---|---|---|---|---|---|---|---|---|---|---|
| ||||||||||||||||||||||||||
 County Results
Roosevelt 50-60% 60-70% 70-80% 80-90%
| ||||||||||||||||||||||||||
| ||||||||||||||||||||||||||
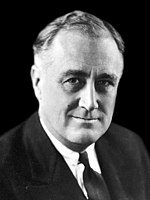
Nevada was won by incumbent President Franklin D. Roosevelt (D–New York), running with Vice President John Nance Garner, with 72.81% of the popular vote, against Governor Alf Landon (R–Kansas), running with Frank Knox, with 27.19% of the popular vote.[3][4]
As of the 2020 presidential election[update], this is the last occasion Douglas County voted for a Democratic presidential candidate,[5] and the last time a Democratic nominee won every single county in the state. This was the first time ever that a presidential candidate won two terms by carrying all counties in Nevada in both instances.
Results edit
| Party | Candidate | Votes | % | |
|---|---|---|---|---|
| Democratic | Franklin D. Roosevelt (inc.) | 31,925 | 72.81% | |
| Republican | Alf Landon | 11,923 | 27.19% | |
| Total votes | 43,848 | 100% | ||
Results by county edit
| County | Franklin Delano Roosevelt Democratic |
Alfred Mossman Landon Republican |
Margin | Total votes cast[6] | |||
|---|---|---|---|---|---|---|---|
| # | % | # | % | # | % | ||
| Churchill | 1,290 | 62.96% | 759 | 37.04% | 531 | 25.92% | 2,049 |
| Clark | 5,091 | 81.21% | 1,178 | 18.79% | 3,913 | 62.42% | 6,269 |
| Douglas | 466 | 57.39% | 346 | 42.61% | 120 | 14.78% | 812 |
| Elko | 2,888 | 73.06% | 1,065 | 26.94% | 1,823 | 46.12% | 3,953 |
| Esmeralda | 566 | 78.39% | 156 | 21.61% | 410 | 56.79% | 722 |
| Eureka | 396 | 68.75% | 180 | 31.25% | 216 | 37.50% | 576 |
| Humboldt | 1,210 | 75.63% | 390 | 24.38% | 820 | 51.25% | 1,600 |
| Lander | 585 | 71.17% | 237 | 28.83% | 348 | 42.34% | 822 |
| Lincoln | 1,639 | 86.58% | 254 | 13.42% | 1,385 | 73.16% | 1,893 |
| Lyon | 1,203 | 71.18% | 487 | 28.82% | 716 | 42.37% | 1,690 |
| Mineral | 778 | 76.73% | 236 | 23.27% | 542 | 53.45% | 1,014 |
| Nye | 1,495 | 76.31% | 464 | 23.69% | 1,031 | 52.63% | 1,959 |
| Ormsby | 745 | 58.29% | 533 | 41.71% | 212 | 16.59% | 1,278 |
| Pershing | 861 | 76.19% | 269 | 23.81% | 592 | 52.39% | 1,130 |
| Storey | 392 | 73.82% | 139 | 26.18% | 253 | 47.65% | 531 |
| Washoe | 9,514 | 68.58% | 4,358 | 31.42% | 5,156 | 37.17% | 13,872 |
| White Pine | 2,806 | 76.29% | 872 | 23.71% | 1,934 | 52.58% | 3,678 |
| Totals | 31,925 | 72.81% | 11,923 | 27.19% | 20,002 | 45.62% | 43,848 |
See also edit
References edit
- ^ "United States Presidential election of 1936 - Encyclopædia Britannica". Retrieved December 25, 2018.
- ^ "1936 Election for the Thirty-eighth Term (1937-41)". Retrieved December 25, 2018.
- ^ "1936 Presidential General Election Results – Nevada". Retrieved December 25, 2018.
- ^ "The American Presidency Project – Election of 1936". Retrieved December 25, 2018.
- ^ Sullivan, Robert David; 'How the Red and Blue Map Evolved Over the Past Century'; America Magazine in The National Catholic Review; June 29, 2016
- ^ Scammon, Richard M. (compiler); America at the Polls: A Handbook of Presidential Election Statistics 1920-1964; p. 289 ISBN 0405077114


