


Summary
The 1948 United States presidential election in Maryland took place on November 2, 1948, as part of the 1948 United States presidential election. State voters chose eight[2] representatives, or electors, to the Electoral College, who voted for president and vice president.
| ||||||||||||||||||||||||||
All 8 Maryland votes to the Electoral College | ||||||||||||||||||||||||||
|---|---|---|---|---|---|---|---|---|---|---|---|---|---|---|---|---|---|---|---|---|---|---|---|---|---|---|
| ||||||||||||||||||||||||||
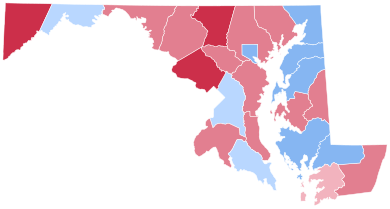 County Results
| ||||||||||||||||||||||||||
| ||||||||||||||||||||||||||

Maryland was won by Governor Thomas Dewey (R–New York), running with Governor Earl Warren, with 49.40% of the popular vote, against incumbent President Harry S. Truman (D–Missouri), running with Senator Alben W. Barkley, with 48.01% of the popular vote.[3][4] This was the first of three times between 1888 and 2000 that Maryland's popular vote had backed a losing candidate nationwide (along with 1968 and 1980).
As of 2020, this is the last time that a Democratic candidate has won the presidency without carrying Maryland and the only time that the state has backed a losing Republican candidate.[5] As of 2020, this remains the last of only 2 occasions in which Maryland was more Republican than the nation (the other occasion being 1896).[6]
Results edit
| Party | Candidate | Votes | % | |
|---|---|---|---|---|
| Republican | Thomas Dewey | 294,814 | 49.40% | |
| Democratic | Harry S. Truman (inc.) | 286,521 | 48.01% | |
| Progressive | Henry A. Wallace | 9,649 | 1.67% | |
| Socialist | Norman Thomas | 2,941 | 0.49% | |
| Write-in | Strom Thurmond | 2,476 | 0.41% | |
| Total votes | 596,735 | 100% | ||
Results by county edit
| County | Thomas Edmund Dewey[7] Republican |
Harry S. Truman[7] Democratic |
Henry Agard Wallace[8] Progressive |
Norman Mattoon Thomas[8] Socialist |
James Strom Thurmond[9] Write-in |
Margin | Total votes cast | ||||||
|---|---|---|---|---|---|---|---|---|---|---|---|---|---|
| # | % | # | % | # | % | # | % | # | % | # | % | ||
| Allegany | 14,375 | 48.98% | 14,398 | 49.06% | 452 | 1.54% | 110 | 0.37% | 13 | 0.04% | -23 | -0.08% | 29,348 |
| Anne Arundel | 10,973 | 53.59% | 8,713 | 42.55% | 368 | 1.80% | 220 | 1.07% | 201 | 0.98% | 2,260 | 11.04% | 20,475 |
| Baltimore | 41,846 | 56.01% | 31,883 | 42.67% | 500 | 0.67% | 386 | 0.52% | 100 | 0.13% | 9,963 | 13.33% | 74,715 |
| Baltimore City | 110,879 | 43.42% | 134,615 | 52.72% | 7,257 | 2.84% | 1,014 | 0.40% | 1,598 | 0.63% | -23,736 | -9.30% | 255,363 |
| Calvert | 1,919 | 50.24% | 1,851 | 48.46% | 22 | 0.58% | 13 | 0.34% | 15 | 0.39% | 68 | 1.78% | 3,820 |
| Caroline | 2,746 | 52.58% | 2,430 | 46.52% | 20 | 0.38% | 12 | 0.23% | 15 | 0.29% | 316 | 6.05% | 5,223 |
| Carroll | 8,003 | 64.89% | 4,226 | 34.27% | 54 | 0.44% | 50 | 0.41% | 3,777 | 30.63% | 12,333 | ||
| Cecil | 3,866 | 46.93% | 4,323 | 52.48% | 32 | 0.39% | 15 | 0.18% | 1 | 0.01% | -457 | -5.55% | 8,237 |
| Charles | 2,703 | 57.71% | 1,878 | 40.09% | 11 | 0.23% | 29 | 0.62% | 63 | 1.35% | 825 | 17.61% | 4,684 |
| Dorchester | 3,751 | 44.71% | 4,507 | 53.73% | 45 | 0.54% | 48 | 0.57% | 38 | 0.45% | -756 | -9.01% | 8,389 |
| Frederick | 9,934 | 57.77% | 7,142 | 41.53% | 79 | 0.46% | 42 | 0.24% | 2,792 | 16.24% | 17,197 | ||
| Garrett | 3,536 | 64.31% | 1,909 | 34.72% | 28 | 0.51% | 23 | 0.42% | 2 | 0.04% | 1,627 | 29.59% | 5,498 |
| Harford | 6,168 | 52.12% | 5,494 | 46.43% | 57 | 0.48% | 31 | 0.26% | 84 | 0.71% | 674 | 5.70% | 11,834 |
| Howard | 3,113 | 51.64% | 2,725 | 45.21% | 158 | 2.62% | 32 | 0.53% | 388 | 6.44% | 6,028 | ||
| Kent | 2,489 | 49.31% | 2,524 | 50.00% | 18 | 0.36% | 17 | 0.34% | -35 | -0.69% | 5,048 | ||
| Montgomery | 23,174 | 60.34% | 14,336 | 37.33% | 386 | 1.01% | 511 | 1.33% | 8,838 | 23.01% | 38,407 | ||
| Prince George's | 14,718 | 48.79% | 14,874 | 49.31% | 258 | 0.86% | 174 | 0.58% | 140 | 0.46% | -156 | -0.52% | 30,164 |
| Queen Anne's | 2,038 | 42.58% | 2,660 | 55.58% | 23 | 0.48% | 21 | 0.44% | 44 | 0.92% | -622 | -13.00% | 4,786 |
| Somerset | 2,247 | 48.42% | 2,293 | 49.41% | 32 | 0.69% | 34 | 0.73% | 35 | 0.75% | -46 | -0.99% | 4,641 |
| St. Mary's | 3,129 | 49.61% | 3,112 | 49.34% | 14 | 0.22% | 44 | 0.70% | 8 | 0.13% | 17 | 0.27% | 6,307 |
| Talbot | 3,585 | 59.74% | 2,344 | 39.06% | 28 | 0.47% | 23 | 0.38% | 21 | 0.35% | 1,241 | 20.68% | 6,001 |
| Washington | 11,887 | 52.49% | 10,588 | 46.76% | 96 | 0.42% | 59 | 0.26% | 15 | 0.07% | 1,299 | 5.74% | 22,645 |
| Wicomico | 5,062 | 47.89% | 5,415 | 51.23% | 23 | 0.22% | 16 | 0.15% | 55 | 0.52% | -353 | -3.34% | 10,571 |
| Worcester | 2,673 | 53.10% | 2,281 | 45.31% | 22 | 0.44% | 17 | 0.34% | 41 | 0.81% | 392 | 7.79% | 5,034 |
| Totals | 294,814 | 49.40% | 286,521 | 48.01% | 9,983 | 1.67% | 2,941 | 0.49% | 2,489 | 0.42% | 8,293 | 1.39% | 596,748 |
Counties that flipped from Republican to Democratic edit
See also edit
References edit
- ^ "United States Presidential election of 1948 - Encyclopædia Britannica". Retrieved December 20, 2017.
- ^ "1948 Election for the Forty-First Term (1949-53)". Retrieved December 20, 2017.
- ^ "1948 Presidential General Election Results – Maryland". Retrieved December 20, 2017.
- ^ "The American Presidency Project - Election of 1948". Retrieved December 20, 2017.
- ^ "Maryland - Google Drive". docs.google.com. Retrieved August 28, 2022.
- ^ "Dave Leip's Atlas of U.S. Presidential Elections". uselectionatlas.org. Retrieved January 29, 2023.
- ^ a b Scammon, Richard M. (compiler); America at the Polls: A Handbook of Presidential Election Statistics 1920-1964; p. 395 ISBN 0405077114
- ^ a b Géoelections; Popular Vote for Henry Wallace (.xlsx file for €15)
- ^ Géoelections; Popular Vote for Strom Thurmond (.xlsx file for €15)