


Summary
General elections were held in Belgium on 26 June 1949.[1] Several reforms took effect prior to the elections; they were the first after the introduction of universal women's suffrage; the number of seats in the Chamber of Representatives was increased from 202 to 212, and from now on, elections for the nine provincial councils were held simultaneously with parliamentary elections. The number of Chamber seats and the simultaneous provincial and parliamentary elections would remain unchanged until state reforms in 1993.
| |||||||||||||||||||||||||||||||||||||||||||||||||||||||||||||||||
All 212 seats in the Chamber of Representatives 106 seats in the Senate 107 (Chamber) seats needed for a majority | |||||||||||||||||||||||||||||||||||||||||||||||||||||||||||||||||
|---|---|---|---|---|---|---|---|---|---|---|---|---|---|---|---|---|---|---|---|---|---|---|---|---|---|---|---|---|---|---|---|---|---|---|---|---|---|---|---|---|---|---|---|---|---|---|---|---|---|---|---|---|---|---|---|---|---|---|---|---|---|---|---|---|---|
| |||||||||||||||||||||||||||||||||||||||||||||||||||||||||||||||||
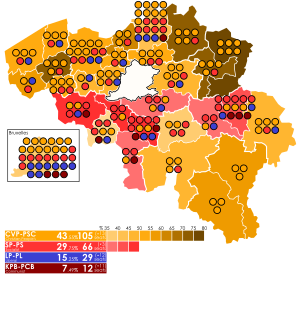 Chamber seat distribution by constituency | |||||||||||||||||||||||||||||||||||||||||||||||||||||||||||||||||
| |||||||||||||||||||||||||||||||||||||||||||||||||||||||||||||||||


The result was a victory for the Christian Social Party, which won 105 of the 212 seats in the Chamber of Representatives and 54 of the 106 seats in the Senate.[2] Voter turnout was 94.4%.[3]
Results edit
Chamber of Deputies edit
 | |||||
|---|---|---|---|---|---|
| Party | Votes | % | Seats | +/– | |
| Christian Social Party | 2,190,895 | 43.55 | 105 | +13 | |
| Belgian Socialist Party | 1,496,539 | 29.75 | 66 | -3 | |
| Liberal Party | 767,180 | 15.25 | 29 | +12 | |
| Communist Party of Belgium | 376,765 | 7.49 | 12 | –11 | |
| Flemish Concentration | 103,896 | 2.07 | 0 | New | |
| Middle Class | 45,721 | 0.91 | 0 | 0 | |
| Independent Party | 20,450 | 0.41 | 0 | New | |
| Traders Union | 6,709 | 0.13 | 0 | New | |
| Belgian National Rally | 6,077 | 0.12 | 0 | New | |
| Walloon Unity | 5,852 | 0.12 | 0 | New | |
| Luxembourg Defence | 2,024 | 0.04 | 0 | New | |
| Cosmocraten | 685 | 0.01 | 0 | New | |
| Light | 680 | 0.01 | 0 | New | |
| Independent General Syndicate | 610 | 0.01 | 0 | New | |
| Belgian Patriotic Party | 55 | 0.00 | 0 | New | |
| Independents | 6,745 | 0.13 | 0 | 0 | |
| Total | 5,030,883 | 100.00 | 212 | +10 | |
| Valid votes | 5,030,883 | 94.56 | |||
| Invalid/blank votes | 289,333 | 5.44 | |||
| Total votes | 5,320,216 | 100.00 | |||
| Registered voters/turnout | 5,635,452 | 94.41 | |||
| Source: Belgian Elections | |||||
Senate edit
 | |||||
|---|---|---|---|---|---|
| Party | Votes | % | Seats | +/– | |
| Christian Social Party | 2,208,553 | 44.96 | 54 | +3 | |
| Belgian Socialist Party | 1,410,135 | 28.71 | 33 | –1 | |
| Liberal Party | 762,530 | 15.52 | 14 | +10 | |
| Communist Party of Belgium | 377,209 | 7.68 | 5 | –6 | |
| Flemish Concentration | 66,055 | 1.34 | 0 | New | |
| Middle Class | 37,302 | 0.76 | 0 | New | |
| Independent Party | 20,357 | 0.41 | 0 | New | |
| A | 13,379 | 0.27 | 0 | New | |
| Traders Union | 5,507 | 0.11 | 0 | New | |
| Walloon Unity | 5,010 | 0.10 | 0 | New | |
| B | 554 | 0.01 | 0 | New | |
| Independents | 5,241 | 0.11 | 0 | 0 | |
| Total | 4,911,832 | 100.00 | 106 | +5 | |
| Valid votes | 4,911,832 | 93.87 | |||
| Invalid/blank votes | 321,017 | 6.13 | |||
| Total votes | 5,232,849 | 100.00 | |||
| Registered voters/turnout | 5,635,452 | 92.86 | |||
| Source: Belgian Elections | |||||
Constituencies edit
The distribution of seats among the electoral districts of the Chamber of Representatives was as follows.[4] Several arrondissements got one or more additional seats.
| Province | Arrondissement(s) | Seats | Change |
|---|---|---|---|
| Antwerp | Antwerp | 20 | +2 |
| Mechelen | 6 | – | |
| Turnhout | 6 | +1 | |
| Limburg | Hasselt | 5 | +1 |
| Tongeren-Maaseik | 6 | +1 | |
| East Flanders | Aalst | 6 | – |
| Oudenaarde | 3 | – | |
| Gent-Eeklo | 13 | +1 | |
| Dendermonde | 4 | – | |
| Sint-Niklaas | 4 | – | |
| West Flanders | Bruges | 5 | +1 |
| Roeselare-Tielt | 5 | +1 | |
| Kortrijk | 6 | – | |
| Ypres | 3 | – | |
| Veurne-Diksmuide-Ostend | 5 | – | |
| Brabant | Leuven | 7 | – |
| Brussels | 32 | +2 | |
| Nivelles | 5 | – | |
| Hainaut | Tournai-Ath | 6 | – |
| Charleroi | 11 | – | |
| Thuin | 4 | – | |
| Mons | 7 | – | |
| Soignies | 3 | – | |
| Liège | Huy-Waremme | 4 | – |
| Liège | 14 | – | |
| Verviers | 5 | – | |
| Luxembourg | Arlon-Marche-Bastogne | 3 | – |
| Neufchâteau-Virton | 3 | – | |
| Namur | Namur | 5 | – |
| Dinant-Philippeville | 4 | – | |
| Total | 212 | +10 | |