
KNOWPIA
WELCOME TO KNOWPIA

1968 Danish general election 
Summary
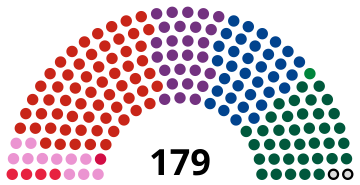
General elections were held in Denmark on 23 January 1968.[1] The Social Democratic Party remained the largest in the Folketing, with 62 of the 179 seats. Voter turnout was 89% in Denmark proper, 57% in the Faroe Islands and 56% in Greenland.[2] They were the last elections in which the old counties were used as constituencies.
| ||||||||||||||||||||||||||||||||||||||||||||||||||||||||||||||||||
All 179 seats in the Folketing 90 seats needed for a majority | ||||||||||||||||||||||||||||||||||||||||||||||||||||||||||||||||||
| Turnout | 89.28% | |||||||||||||||||||||||||||||||||||||||||||||||||||||||||||||||||
|---|---|---|---|---|---|---|---|---|---|---|---|---|---|---|---|---|---|---|---|---|---|---|---|---|---|---|---|---|---|---|---|---|---|---|---|---|---|---|---|---|---|---|---|---|---|---|---|---|---|---|---|---|---|---|---|---|---|---|---|---|---|---|---|---|---|---|
This lists parties that won seats. See the complete results below.
| ||||||||||||||||||||||||||||||||||||||||||||||||||||||||||||||||||

Results edit
 | |||||
|---|---|---|---|---|---|
| Party | Votes | % | Seats | +/– | |
| Denmark proper | |||||
| Social Democrats | 974,833 | 34.15 | 62 | –7 | |
| Conservative People's Party | 581,051 | 20.35 | 37 | +3 | |
| Venstre | 530,167 | 18.57 | 34 | –1 | |
| Danish Social Liberal Party | 427,304 | 14.97 | 27 | +14 | |
| Socialist People's Party | 174,553 | 6.11 | 11 | –9 | |
| Left Socialists | 57,184 | 2.00 | 4 | New | |
| Liberal Centre | 37,407 | 1.31 | 0 | –4 | |
| Communist Party of Denmark | 29,706 | 1.04 | 0 | 0 | |
| Justice Party of Denmark | 21,124 | 0.74 | 0 | 0 | |
| Independent Party | 14,360 | 0.50 | 0 | 0 | |
| Schleswig Party | 6,831 | 0.24 | 0 | New | |
| Independents | 127 | 0.00 | 0 | 0 | |
| Total | 2,854,647 | 100.00 | 175 | 0 | |
| Valid votes | 2,854,647 | 99.65 | |||
| Invalid/blank votes | 10,158 | 0.35 | |||
| Total votes | 2,864,805 | 100.00 | |||
| Registered voters/turnout | 3,208,646 | 89.28 | |||
| Faroe Islands | |||||
| People's Party | 4,294 | 34.42 | 1 | 0 | |
| Social Democratic Party | 4,051 | 32.47 | 1 | 0 | |
| Union Party | 3,242 | 25.99 | 0 | 0 | |
| Progress Party | 889 | 7.13 | 0 | New | |
| Total | 12,476 | 100.00 | 2 | 0 | |
| Valid votes | 12,476 | 99.68 | |||
| Invalid/blank votes | 40 | 0.32 | |||
| Total votes | 12,516 | 100.00 | |||
| Registered voters/turnout | 22,122 | 56.58 | |||
| Greenland | |||||
| Independents | 11,164 | 100.00 | 2 | 0 | |
| Total | 11,164 | 100.00 | 2 | 0 | |
| Valid votes | 11,164 | 95.56 | |||
| Invalid/blank votes | 519 | 4.44 | |||
| Total votes | 11,683 | 100.00 | |||
| Registered voters/turnout | 20,766 | 56.26 | |||
| Source: Nohlen & Stöver | |||||
References edit
- ^ Dieter Nohlen & Philip Stöver (2010) Elections in Europe: A data handbook, p524 ISBN 978-3-8329-5609-7
- ^ Nohlen & Stöver, p543