


Summary
General elections were held in Sweden on 19 September 1982.[1] They saw the return of the Swedish Social Democratic Party to power after six years in opposition, the longest period in opposition by the Social Democrats since the 1910s. The center-right coalition of Thorbjörn Fälldin had earlier suffered a loss upon the breakup of the government in 1981, the year before the election, when the rightist Moderate Party chose to withdraw from the government, protesting against the centrist tax policies of the Fälldin government. After regaining power, Social Democratic leader Olof Palme succeeded in being elected Prime Minister again, having earlier held power between 1969 and 1976.
| ||||||||||||||||||||||||||||||||||||||||||||||||||||||||||||||||||||
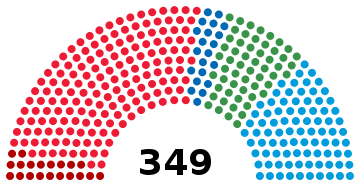
All 349 seats in the Riksdag 175 seats needed for a majority | ||||||||||||||||||||||||||||||||||||||||||||||||||||||||||||||||||||
|---|---|---|---|---|---|---|---|---|---|---|---|---|---|---|---|---|---|---|---|---|---|---|---|---|---|---|---|---|---|---|---|---|---|---|---|---|---|---|---|---|---|---|---|---|---|---|---|---|---|---|---|---|---|---|---|---|---|---|---|---|---|---|---|---|---|---|---|---|
| ||||||||||||||||||||||||||||||||||||||||||||||||||||||||||||||||||||
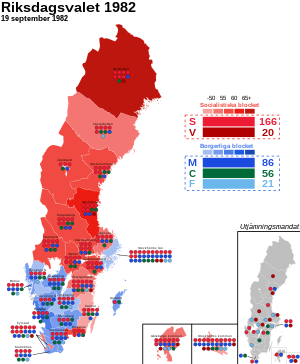 Map of the election, showing the distribution of constituency and levelling seats, as well as the largest political bloc within each constituency. | ||||||||||||||||||||||||||||||||||||||||||||||||||||||||||||||||||||
| ||||||||||||||||||||||||||||||||||||||||||||||||||||||||||||||||||||


The 2,533,250 votes for the Social Democrats is, in spite of a larger electorate, as of 2022 the highest number of people voting for a single party in Swedish electoral history, although the party had previously recorded higher percentage shares.
Debates edit
| 1982 Swedish general election debates | |||||||||
|---|---|---|---|---|---|---|---|---|---|
| Date | Time | Organizers | Moderators | P Present I Invitee N Non-invitee | |||||
| S | M | C | L | V | Refs | ||||
| Sveriges Television | Lars Orup [sv] | P Olof Palme, Kjell-Olof Feldt |
P Ulf Adelsohn |
P Thorbjörn Fälldin |
P Ola Ullsten |
P Lars Werner |
[2] | ||
Results edit
 | |||||
|---|---|---|---|---|---|
| Party | Votes | % | Seats | +/– | |
| Swedish Social Democratic Party | 2,533,250 | 45.61 | 166 | +12 | |
| Moderate Party | 1,313,337 | 23.64 | 86 | +13 | |
| Centre Party | 859,618 | 15.48 | 56 | −8 | |
| People's Party | 327,770 | 5.90 | 21 | −17 | |
| Left Party Communists | 308,899 | 5.56 | 20 | 0 | |
| Christian Democratic Unity | 103,820 | 1.87 | 0 | 0 | |
| Green Party | 91,787 | 1.65 | 0 | New | |
| Workers Party Communists | 5,745 | 0.10 | 0 | 0 | |
| Other parties | 10,376 | 0.19 | 0 | 0 | |
| Total | 5,554,602 | 100.00 | 349 | 0 | |
| Valid votes | 5,554,602 | 99.07 | |||
| Invalid/blank votes | 52,001 | 0.93 | |||
| Total votes | 5,606,603 | 100.00 | |||
| Registered voters/turnout | 6,130,993 | 91.45 | |||
| Source: Nohlen & Stöver | |||||
Seat distribution edit
| Constituency | Total seats |
Seats won | |||||||
|---|---|---|---|---|---|---|---|---|---|
| By party | By coalition | ||||||||
| S | M | C | F | V | Left | Right | |||
| Älvsborg North | 10 | 5 | 2 | 2 | 1 | 5 | 5 | ||
| Älvsborg South | 7 | 3 | 2 | 2 | 3 | 4 | |||
| Blekinge | 6 | 4 | 1 | 1 | 4 | 2 | |||
| Bohus | 10 | 4 | 3 | 2 | 1 | 4 | 6 | ||
| Fyrstadskretsen | 19 | 9 | 6 | 2 | 1 | 1 | 10 | 9 | |
| Gävleborg | 12 | 7 | 2 | 2 | 1 | 8 | 4 | ||
| Gothenburg | 18 | 8 | 5 | 1 | 2 | 2 | 10 | 8 | |
| Gotland | 2 | 1 | 1 | 1 | 1 | ||||
| Halland | 10 | 4 | 3 | 2 | 1 | 4 | 6 | ||
| Jämtland | 5 | 3 | 1 | 1 | 3 | 2 | |||
| Jönköping | 13 | 6 | 3 | 3 | 1 | 6 | 7 | ||
| Kalmar | 9 | 5 | 2 | 2 | 5 | 4 | |||
| Kopparberg | 12 | 6 | 2 | 3 | 1 | 7 | 5 | ||
| Kristianstad | 11 | 5 | 3 | 2 | 1 | 5 | 6 | ||
| Kronoberg | 7 | 3 | 2 | 2 | 3 | 4 | |||
| Malmöhus | 13 | 6 | 4 | 2 | 1 | 6 | 7 | ||
| Norrbotten | 10 | 7 | 1 | 1 | 1 | 8 | 2 | ||
| Örebro | 12 | 6 | 2 | 2 | 1 | 1 | 7 | 5 | |
| Östergötland | 17 | 8 | 4 | 3 | 1 | 1 | 9 | 8 | |
| Skaraborg | 12 | 5 | 3 | 3 | 1 | 5 | 7 | ||
| Södermanland | 11 | 6 | 2 | 2 | 1 | 6 | 5 | ||
| Stockholm County | 34 | 14 | 12 | 3 | 2 | 3 | 17 | 17 | |
| Stockholm Municipality | 31 | 12 | 11 | 2 | 2 | 4 | 16 | 15 | |
| Uppsala | 11 | 5 | 2 | 2 | 1 | 1 | 6 | 5 | |
| Värmland | 13 | 6 | 3 | 2 | 1 | 1 | 7 | 6 | |
| Västerbotten | 10 | 5 | 1 | 2 | 1 | 1 | 6 | 4 | |
| Västernorrland | 13 | 7 | 2 | 3 | 1 | 8 | 5 | ||
| Västmanland | 11 | 6 | 2 | 1 | 1 | 1 | 7 | 4 | |
| Total | 349 | 166 | 86 | 56 | 21 | 20 | 186 | 163 | |
| Source: Statistics Sweden | |||||||||
By municipality edit
-
 Votes by municipality. The municipalities are the color of the party that got the most votes within the coalition that won relative majority.
 -
 Cartogram of the map to the left with each municipality rescaled to the number of valid votes cast.
 -
 Map showing the voting shifts from the 1979 to the 1982 election. Darker blue indicates a municipality voted more towards the parties that formed the centre-right bloc. Darker red indicates a municipality voted more towards the parties that form the left-wing bloc.
 -
 Votes by municipality as a scale from red/Left-wing bloc to blue/Centre-right bloc.
 -
 Cartogram of vote with each municipality rescaled in proportion to number of valid votes cast. Deeper blue represents a relative majority for the centre-right coalition, brighter red represents a relative majority for the left-wing coalition.


References edit
- ^ Dieter Nohlen & Philip Stöver (2010) Elections in Europe: A data handbook, p1858 ISBN 978-3-8329-5609-7
- ^ Sweden, Sveriges Television AB, Stockholm, Slutdebatter – Partiledardebatt (in Swedish), retrieved 29 January 2024
{{citation}}: CS1 maint: multiple names: authors list (link)