


Summary
The 1984 United States presidential election in North Carolina took place on November 6, 1984, and was part of the 1984 United States presidential election. Voters chose 13 representatives, or electors to the Electoral College, who voted for president and vice president.
| ||||||||||||||||||||||||||
| ||||||||||||||||||||||||||

| ||||||||||||||||||||||||||
| ||||||||||||||||||||||||||


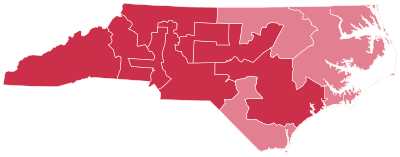
North Carolina voted for President Ronald Reagan, running with Vice President George H. W. Bush, against former Vice President Walter Mondale, running with U.S. Representative Geraldine Ferraro.
As of the 2020 presidential election[update], this is the last election in which Vance County and Chatham County voted for a Republican presidential candidate and Scotland County would not vote Republican again until 2020.[1]
Campaign edit
Jesse Jackson's voters were 89% black, 8% white, 1% Hispanic, and 2% were members of other groups.[2]
73% of white voters supported Reagan while 27% supported Mondale.[3][4]
Results edit
| 1984 United States presidential election in North Carolina[5] | |||||
|---|---|---|---|---|---|
| Party | Candidate | Votes | Percentage | Electoral votes | |
| Republican | Ronald Reagan (incumbent) | 1,346,481 | 61.90% | 13 | |
| Democratic | Walter Mondale | 824,287 | 37.89% | 0 | |
| Libertarian | David Bergland | 3,794 | 0.17% | 0 | |
| Socialist Workers | Melvin Mason | 799 | 0.04% | 0 | |
| Totals | 2,175,361 | 100.00% | 13 | ||
| Voter turnout | — | ||||
Results by county edit
| County[6] | Ronald Reagan Republican |
Walter Mondale Democratic |
David Bergland Libertarian |
Melvin Mason Socialist Workers |
Margin | Total | |||||
|---|---|---|---|---|---|---|---|---|---|---|---|
| # | % | # | % | # | % | # | % | # | % | ||
| Alamance | 26,063 | 69.74% | 11,230 | 30.05% | 68 | 0.18% | 9 | 0.02% | 14,833 | 39.69% | 37,370 |
| Alexander | 8,502 | 70.22% | 3,581 | 29.58% | 20 | 0.17% | 4 | 0.03% | 4,921 | 40.66% | 12,107 |
| Alleghany | 2,589 | 56.08% | 2,013 | 43.60% | 13 | 0.28% | 2 | 0.04% | 576 | 12.48% | 4,617 |
| Anson | 3,719 | 42.45% | 5,015 | 57.25% | 11 | 0.13% | 15 | 0.17% | -1,296 | -14.80% | 8,760 |
| Ashe | 6,611 | 62.10% | 4,009 | 37.66% | 22 | 0.21% | 3 | 0.03% | 2,602 | 24.44% | 10,645 |
| Avery | 4,702 | 79.88% | 1,159 | 19.69% | 17 | 0.29% | 8 | 0.14% | 3,543 | 60.19% | 5,886 |
| Beaufort | 9,284 | 60.66% | 5,987 | 39.12% | 27 | 0.18% | 6 | 0.04% | 3,297 | 21.54% | 15,304 |
| Bertie | 2,879 | 41.91% | 3,953 | 57.54% | 29 | 0.42% | 9 | 0.13% | -1,074 | -15.63% | 6,870 |
| Bladen | 4,701 | 48.07% | 5,064 | 51.78% | 12 | 0.12% | 2 | 0.02% | -363 | -3.71% | 9,779 |
| Brunswick | 9,673 | 58.67% | 6,774 | 41.08% | 35 | 0.21% | 6 | 0.04% | 2,899 | 17.59% | 16,488 |
| Buncombe | 37,698 | 61.62% | 23,337 | 38.14% | 122 | 0.20% | 26 | 0.04% | 14,361 | 23.48% | 61,183 |
| Burke | 18,766 | 64.32% | 10,353 | 35.48% | 51 | 0.17% | 8 | 0.03% | 8,413 | 28.84% | 29,178 |
| Cabarrus | 22,528 | 72.54% | 8,477 | 27.29% | 43 | 0.14% | 10 | 0.03% | 14,051 | 45.25% | 31,058 |
| Caldwell | 17,024 | 69.79% | 7,311 | 29.97% | 50 | 0.20% | 9 | 0.04% | 9,713 | 39.82% | 24,394 |
| Camden | 1,282 | 54.25% | 1,075 | 45.49% | 5 | 0.21% | 1 | 0.04% | 207 | 8.76% | 2,363 |
| Carteret | 11,637 | 66.28% | 5,882 | 33.50% | 35 | 0.20% | 3 | 0.02% | 5,755 | 32.78% | 17,557 |
| Caswell | 3,992 | 48.84% | 4,157 | 50.86% | 19 | 0.23% | 6 | 0.07% | -165 | -2.02% | 8,174 |
| Catawba | 31,476 | 72.78% | 11,700 | 27.05% | 61 | 0.14% | 13 | 0.03% | 19,776 | 45.73% | 43,250 |
| Chatham | 8,595 | 53.39% | 7,458 | 46.33% | 39 | 0.24% | 7 | 0.04% | 1,137 | 7.06% | 16,099 |
| Cherokee | 4,894 | 63.73% | 2,776 | 36.15% | 8 | 0.10% | 1 | 0.01% | 2,118 | 27.58% | 7,679 |
| Chowan | 2,171 | 55.41% | 1,736 | 44.31% | 9 | 0.23% | 2 | 0.05% | 435 | 11.10% | 3,918 |
| Clay | 2,259 | 62.42% | 1,340 | 37.03% | 19 | 0.53% | 1 | 0.03% | 919 | 25.39% | 3,619 |
| Cleveland | 17,095 | 62.23% | 10,288 | 37.45% | 82 | 0.30% | 7 | 0.03% | 6,807 | 24.78% | 27,472 |
| Columbus | 9,150 | 51.11% | 8,728 | 48.75% | 20 | 0.11% | 6 | 0.03% | 422 | 2.36% | 17,904 |
| Craven | 12,893 | 64.04% | 7,186 | 35.69% | 41 | 0.20% | 14 | 0.07% | 5,707 | 28.35% | 20,134 |
| Cumberland | 31,602 | 58.18% | 22,614 | 41.63% | 89 | 0.16% | 14 | 0.03% | 8,988 | 16.55% | 54,319 |
| Currituck | 2,885 | 63.24% | 1,668 | 36.56% | 8 | 0.18% | 1 | 0.02% | 1,217 | 26.68% | 4,562 |
| Dare | 4,738 | 71.83% | 1,839 | 27.88% | 16 | 0.24% | 3 | 0.05% | 2,899 | 43.95% | 6,596 |
| Davidson | 30,471 | 72.55% | 11,469 | 27.31% | 54 | 0.13% | 7 | 0.02% | 19,002 | 45.24% | 42,001 |
| Davie | 8,201 | 73.72% | 2,911 | 26.17% | 12 | 0.11% | 1 | 0.01% | 5,290 | 47.55% | 11,125 |
| Duplin | 7,708 | 52.96% | 6,830 | 46.93% | 13 | 0.09% | 4 | 0.03% | 878 | 6.03% | 14,555 |
| Durham | 29,185 | 47.39% | 32,244 | 52.36% | 134 | 0.22% | 21 | 0.03% | -3,059 | -4.97% | 61,584 |
| Edgecombe | 9,635 | 47.66% | 10,545 | 52.16% | 24 | 0.12% | 12 | 0.06% | -910 | -4.50% | 20,216 |
| Forsyth | 59,208 | 61.54% | 36,814 | 38.26% | 174 | 0.18% | 15 | 0.02% | 22,394 | 23.28% | 96,211 |
| Franklin | 5,984 | 55.57% | 4,766 | 44.26% | 10 | 0.09% | 8 | 0.07% | 1,218 | 11.31% | 10,768 |
| Gaston | 39,167 | 73.36% | 14,142 | 26.49% | 70 | 0.13% | 13 | 0.02% | 25,025 | 46.87% | 53,392 |
| Gates | 1,694 | 43.10% | 2,225 | 56.62% | 7 | 0.18% | 4 | 0.10% | -531 | -13.52% | 3,930 |
| Graham | 2,514 | 62.63% | 1,494 | 37.22% | 4 | 0.10% | 2 | 0.05% | 1,020 | 25.41% | 4,014 |
| Granville | 6,302 | 54.42% | 5,217 | 45.05% | 58 | 0.50% | 3 | 0.03% | 1,085 | 9.37% | 11,580 |
| Greene | 3,195 | 53.47% | 2,772 | 46.39% | 8 | 0.13% | 0 | 0.00% | 423 | 7.08% | 5,975 |
| Guilford | 73,096 | 61.25% | 46,027 | 38.57% | 186 | 0.16% | 27 | 0.02% | 27,069 | 22.68% | 119,336 |
| Halifax | 8,832 | 48.65% | 9,278 | 51.11% | 30 | 0.17% | 13 | 0.07% | -446 | -2.46% | 18,153 |
| Harnett | 11,198 | 61.11% | 7,106 | 38.78% | 15 | 0.08% | 4 | 0.02% | 4,092 | 22.33% | 18,323 |
| Haywood | 10,146 | 55.96% | 7,958 | 43.89% | 24 | 0.13% | 3 | 0.02% | 2,188 | 12.07% | 18,131 |
| Henderson | 19,369 | 72.55% | 7,222 | 27.05% | 80 | 0.30% | 26 | 0.10% | 12,147 | 45.50% | 26,697 |
| Hertford | 3,176 | 41.27% | 4,498 | 58.45% | 16 | 0.21% | 5 | 0.06% | -1,322 | -17.18% | 7,695 |
| Hoke | 2,449 | 43.14% | 3,214 | 56.61% | 11 | 0.19% | 3 | 0.05% | -765 | -13.47% | 5,677 |
| Hyde | 1,195 | 54.27% | 1,004 | 45.59% | 3 | 0.14% | 0 | 0.00% | 191 | 8.68% | 2,202 |
| Iredell | 23,641 | 70.14% | 9,999 | 29.67% | 55 | 0.16% | 9 | 0.03% | 13,642 | 40.47% | 33,704 |
| Jackson | 5,582 | 55.97% | 4,367 | 43.78% | 22 | 0.22% | 3 | 0.03% | 1,215 | 12.19% | 9,974 |
| Johnston | 16,210 | 67.32% | 7,833 | 32.53% | 24 | 0.10% | 13 | 0.05% | 8,377 | 34.79% | 24,080 |
| Jones | 2,062 | 50.30% | 2,025 | 49.40% | 8 | 0.20% | 4 | 0.10% | 37 | 0.90% | 4,099 |
| Lee | 8,198 | 67.47% | 3,925 | 32.30% | 25 | 0.21% | 3 | 0.02% | 4,273 | 35.17% | 12,151 |
| Lenoir | 13,321 | 60.79% | 8,556 | 39.04% | 27 | 0.12% | 10 | 0.05% | 4,765 | 21.75% | 21,914 |
| Lincoln | 12,621 | 67.64% | 5,996 | 32.13% | 38 | 0.20% | 4 | 0.02% | 6,625 | 35.51% | 18,659 |
| Macon | 6,661 | 64.95% | 3,570 | 34.81% | 21 | 0.20% | 4 | 0.04% | 3,091 | 30.14% | 10,256 |
| Madison | 3,666 | 54.81% | 2,988 | 44.67% | 10 | 0.15% | 25 | 0.37% | 678 | 10.14% | 6,689 |
| Martin | 4,266 | 52.32% | 3,870 | 47.47% | 12 | 0.15% | 5 | 0.06% | 396 | 4.85% | 8,153 |
| McDowell | 7,639 | 65.09% | 4,076 | 34.73% | 17 | 0.14% | 4 | 0.03% | 3,563 | 30.36% | 11,736 |
| Mecklenburg | 106,754 | 62.67% | 63,190 | 37.10% | 337 | 0.20% | 56 | 0.03% | 43,564 | 25.57% | 170,337 |
| Mitchell | 4,737 | 78.51% | 1,286 | 21.31% | 10 | 0.17% | 1 | 0.02% | 3,451 | 57.20% | 6,034 |
| Montgomery | 5,109 | 57.07% | 3,831 | 42.79% | 6 | 0.07% | 6 | 0.07% | 1,278 | 14.28% | 8,952 |
| Moore | 14,681 | 67.40% | 7,063 | 32.43% | 30 | 0.14% | 8 | 0.04% | 7,618 | 34.97% | 21,782 |
| Nash | 17,295 | 66.73% | 8,588 | 33.14% | 23 | 0.09% | 11 | 0.04% | 8,707 | 33.59% | 25,917 |
| New Hanover | 23,771 | 65.21% | 12,591 | 34.54% | 75 | 0.21% | 15 | 0.04% | 11,180 | 30.67% | 36,452 |
| Northampton | 3,198 | 38.39% | 5,094 | 61.15% | 24 | 0.29% | 14 | 0.17% | -1,896 | -22.76% | 8,330 |
| Onslow | 13,928 | 70.75% | 5,713 | 29.02% | 34 | 0.17% | 12 | 0.06% | 8,215 | 41.73% | 19,687 |
| Orange | 15,585 | 42.96% | 20,564 | 56.69% | 108 | 0.30% | 20 | 0.06% | -4,979 | -13.73% | 36,277 |
| Pamlico | 2,554 | 54.14% | 2,152 | 45.62% | 8 | 0.17% | 3 | 0.06% | 402 | 8.52% | 4,717 |
| Pasquotank | 4,646 | 54.58% | 3,854 | 45.27% | 6 | 0.07% | 7 | 0.08% | 792 | 9.31% | 8,513 |
| Pender | 5,079 | 53.73% | 4,354 | 46.06% | 16 | 0.17% | 4 | 0.04% | 725 | 7.67% | 9,453 |
| Perquimans | 1,939 | 57.28% | 1,441 | 42.57% | 4 | 0.12% | 1 | 0.03% | 498 | 14.71% | 3,385 |
| Person | 5,854 | 62.30% | 3,528 | 37.54% | 11 | 0.12% | 4 | 0.04% | 2,326 | 24.76% | 9,397 |
| Pitt | 18,983 | 58.36% | 13,481 | 41.45% | 48 | 0.15% | 14 | 0.04% | 5,502 | 16.91% | 32,526 |
| Polk | 4,046 | 64.73% | 2,169 | 34.70% | 34 | 0.54% | 2 | 0.03% | 1,877 | 30.03% | 6,251 |
| Randolph | 25,759 | 77.36% | 7,511 | 22.56% | 23 | 0.07% | 6 | 0.02% | 18,248 | 54.80% | 33,299 |
| Richmond | 6,807 | 47.50% | 7,494 | 52.30% | 26 | 0.18% | 3 | 0.02% | -687 | -4.80% | 14,330 |
| Robeson | 12,947 | 45.76% | 15,257 | 53.93% | 56 | 0.20% | 31 | 0.11% | -2,310 | -8.17% | 28,291 |
| Rockingham | 17,895 | 62.70% | 10,605 | 37.16% | 32 | 0.11% | 7 | 0.02% | 7,290 | 25.54% | 28,539 |
| Rowan | 25,207 | 70.20% | 10,643 | 29.64% | 52 | 0.14% | 5 | 0.01% | 14,564 | 40.56% | 35,907 |
| Rutherford | 11,369 | 62.23% | 6,862 | 37.56% | 33 | 0.18% | 4 | 0.02% | 4,507 | 24.67% | 18,268 |
| Sampson | 10,665 | 53.87% | 9,115 | 46.04% | 13 | 0.07% | 3 | 0.02% | 1,550 | 7.83% | 19,796 |
| Scotland | 4,077 | 50.23% | 4,028 | 49.62% | 11 | 0.14% | 1 | 0.01% | 49 | 0.61% | 8,117 |
| Stanly | 13,116 | 68.00% | 6,138 | 31.82% | 29 | 0.15% | 6 | 0.03% | 6,978 | 36.18% | 19,289 |
| Stokes | 9,515 | 65.63% | 4,950 | 34.14% | 28 | 0.19% | 5 | 0.03% | 4,565 | 31.49% | 14,498 |
| Surry | 13,340 | 64.88% | 7,188 | 34.96% | 26 | 0.13% | 8 | 0.04% | 6,152 | 29.92% | 20,562 |
| Swain | 2,012 | 50.02% | 2,000 | 49.73% | 9 | 0.22% | 1 | 0.02% | 12 | 0.29% | 4,022 |
| Transylvania | 6,956 | 64.91% | 3,733 | 34.83% | 25 | 0.23% | 3 | 0.03% | 3,223 | 30.08% | 10,717 |
| Tyrrell | 774 | 48.89% | 807 | 50.98% | 1 | 0.06% | 1 | 0.06% | -33 | -2.09% | 1,583 |
| Union | 16,885 | 70.45% | 7,048 | 29.41% | 27 | 0.11% | 8 | 0.03% | 9,837 | 41.04% | 23,968 |
| Vance | 6,836 | 53.68% | 5,880 | 46.18% | 15 | 0.12% | 3 | 0.02% | 956 | 7.50% | 12,734 |
| Wake | 81,251 | 61.61% | 50,323 | 38.16% | 267 | 0.20% | 30 | 0.02% | 30,928 | 23.45% | 131,871 |
| Warren | 2,664 | 40.25% | 3,946 | 59.63% | 3 | 0.05% | 5 | 0.08% | -1,282 | -19.38% | 6,618 |
| Washington | 2,731 | 46.67% | 3,114 | 53.21% | 7 | 0.12% | 0 | 0.00% | -383 | -6.54% | 5,852 |
| Watauga | 9,370 | 64.27% | 5,163 | 35.41% | 41 | 0.28% | 5 | 0.03% | 4,207 | 28.86% | 14,579 |
| Wayne | 17,961 | 64.13% | 10,011 | 35.74% | 30 | 0.11% | 6 | 0.02% | 7,950 | 28.39% | 28,008 |
| Wilkes | 18,670 | 73.03% | 6,852 | 26.80% | 40 | 0.16% | 2 | 0.01% | 11,818 | 46.23% | 25,564 |
| Wilson | 12,243 | 59.31% | 8,343 | 40.42% | 40 | 0.19% | 17 | 0.08% | 3,900 | 18.89% | 20,643 |
| Yadkin | 8,976 | 74.37% | 3,075 | 25.48% | 14 | 0.12% | 5 | 0.04% | 5,901 | 48.89% | 12,070 |
| Yancey | 4,296 | 53.96% | 3,651 | 45.86% | 9 | 0.11% | 5 | 0.06% | 645 | 8.10% | 7,961 |
| Totals | 1,346,481 | 61.90% | 824,287 | 37.89% | 3,794 | 0.17% | 799 | 0.04% | 522,194 | 24.01% | 2,175,361 |
Counties that flipped from Democratic to Republican edit
References edit
- ^ Sullivan, Robert David; ‘How the Red and Blue Map Evolved Over the Past Century’; America Magazine in The National Catholic Review; June 29, 2016
- ^ Ranney 1985, p. 54.
- ^ Black & Black 1992, p. 295.
- ^ Black & Black 1992, p. 335.
- ^ "1984 Presidential General Election Results – North Carolina". Dave Leip's U.S. Election Atlas. Retrieved August 25, 2008.
- ^ "NC US President Race, November 06, 1984". Our Campaigns.
Works cited edit
- Black, Earl; Black, Merle (1992). The Vital South: How Presidents Are Elected. Harvard University Press. ISBN 0674941306.
Works cited edit
- Ranney, Austin, ed. (1985). The American Elections of 1984. Duke University Press. ISBN 0822302306.