


Summary
The 1984 United States presidential election in Ohio took place on November 6, 1984. All 50 states and the District of Columbia were part of the election. State voters chose 23 electors to the Electoral College, which selected the president and vice president of the United States.
| ||||||||||||||||||||||||||
| ||||||||||||||||||||||||||
| ||||||||||||||||||||||||||
| ||||||||||||||||||||||||||


Ohio was won by incumbent United States President Ronald Reagan of California, who was running against former Vice President Walter Mondale of Minnesota. Reagan ran for a second time with incumbent Vice President and former C.I.A. Director George H. W. Bush of Texas, and Mondale ran with Representative Geraldine Ferraro of New York, the first major female candidate for the vice presidency.
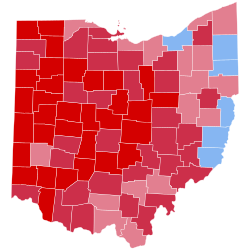
The presidential election of 1984 was a very partisan election for Ohio, with over 99% of the electorate voting only either Democratic or Republican, though several more parties did appear on the ballot.[1] Reagan won the election in Ohio by a decisive 18.76% margin, making Ohio just over half a percent more Republican than the nation overall. Reagan won all but six of Ohio's counties, but, amongst the state's population centers, scored particularly strong wins in Hamilton and Franklin Counties, home to Cincinnati and Columbus and their closer-in suburbs, respectively; he won over 60% in both and won each by a raw vote margin of over 100,000 votes. Mondale's wins were limited to Cuyahoga, which he won with less than 60% of the vote, and a series of counties in Appalachian Ohio, along the border with Pennsylvania and West Virginia: Mahoning, Trumbull, Jefferson, Belmont, and Monroe. Unlike Eisenhower in 1952 and 1956 and Nixon in 1972, Reagan was unable to capture the state's largest county, Cuyahoga; however, Mondale was unable to retain Athens County (home to Ohio University), despite that it had voted Democratic in the last three straight elections (including for McGovern).
While Pennsylvania and much of the Upper Midwest shifted more Democratic in this election, Ohio voted in line with the nation, presaging its role as the only large Midwestern state (and indeed as the only large state outside the South) to vote Republican in 2000, 2004, and 2020. However, Ohio's delegation in the United States House of Representatives switched from Republican to Democratic control despite Reagan's victory in the state.[2] As of the 2020 presidential election[update], this is the last election in which Lucas County, Athens County, and Summit County voted for a Republican presidential candidate, the last until 2016 that Ashtabula County voted for a Republican candidate and the last until 2020 that Lorain County voted for a Republican candidate.[3] It is also the last time to date that Ohio voted to the left of neighboring Michigan.
Campaign edit
Jesse Jackson's voters were 81% black, 18% white, and 1% were members of other groups.[4]
Results edit
| 1984 United States presidential election in Ohio | |||||
|---|---|---|---|---|---|
| Party | Candidate | Votes | Percentage | Electoral votes | |
| Republican | Ronald Reagan (incumbent) | 2,678,560 | 58.90% | 23 | |
| Democratic | Walter Mondale | 1,825,440 | 40.14% | 0 | |
| Not Designated | Dennis Serrette | 12,090 | 0.27% | 0 | |
| Not Designated | Lyndon LaRouche | 10,693 | 0.24% | 0 | |
| Not Designated | David Bergland | 5,886 | 0.13% | 0 | |
| Not Designated | Gus Hall | 4,438 | 0.10% | 0 | |
| Not Designated | Melvin Mason | 4,344 | 0.10% | 0 | |
| Not Designated | Edward Winn | 3,565 | 0.08% | 0 | |
| Not Designated | Larry Holmes | 2,565 | 0.06% | 0 | |
| Other write-ins | 34 | >0.01% | 0 | ||
| Prohibition | Earl Dodge(write-in) | 4 | >0.01% | 0 | |
| Totals | 4,547,619 | 100.0% | 23 | ||
Results by county edit
| County | Ronald Reagan Republican |
Walter Mondale Democratic |
Various candidates Other parties |
Margin | Total votes cast | ||||
|---|---|---|---|---|---|---|---|---|---|
| # | % | # | % | # | % | # | % | ||
| Adams | 6,113 | 62.83% | 3,534 | 36.32% | 82 | 0.84% | 2,579 | 26.51% | 9,729 |
| Allen | 33,506 | 72.98% | 12,176 | 26.52% | 229 | 0.50% | 21,330 | 46.46% | 45,911 |
| Ashland | 14,339 | 74.40% | 4,786 | 24.83% | 147 | 0.76% | 9,553 | 49.57% | 19,272 |
| Ashtabula | 21,669 | 52.34% | 19,344 | 46.73% | 384 | 0.93% | 2,325 | 5.61% | 41,397 |
| Athens | 11,548 | 52.59% | 10,201 | 46.46% | 209 | 0.95% | 1,347 | 6.13% | 21,958 |
| Auglaize | 14,766 | 77.72% | 4,102 | 21.59% | 132 | 0.69% | 10,664 | 56.13% | 19,000 |
| Belmont | 15,170 | 43.52% | 19,458 | 55.82% | 228 | 0.65% | -4,288 | -12.30% | 34,856 |
| Brown | 8,221 | 66.28% | 4,067 | 32.79% | 116 | 0.94% | 4,154 | 33.49% | 12,404 |
| Butler | 76,216 | 72.92% | 27,700 | 26.50% | 598 | 0.57% | 48,516 | 46.42% | 104,514 |
| Carroll | 6,703 | 63.33% | 3,771 | 35.63% | 110 | 1.04% | 2,932 | 27.70% | 10,584 |
| Champaign | 9,935 | 73.05% | 3,544 | 26.06% | 121 | 0.89% | 6,391 | 46.99% | 13,600 |
| Clark | 35,831 | 62.05% | 21,154 | 36.63% | 759 | 1.31% | 14,677 | 25.42% | 57,744 |
| Clermont | 35,316 | 74.63% | 11,713 | 24.75% | 290 | 0.61% | 23,603 | 49.88% | 47,319 |
| Clinton | 9,603 | 73.77% | 3,332 | 25.60% | 83 | 0.64% | 6,271 | 48.17% | 13,018 |
| Columbiana | 24,552 | 54.43% | 20,155 | 44.68% | 403 | 0.89% | 4,397 | 9.75% | 45,110 |
| Coshocton | 9,842 | 68.71% | 4,392 | 30.66% | 89 | 0.62% | 5,450 | 38.05% | 14,323 |
| Crawford | 14,682 | 74.08% | 4,932 | 24.88% | 206 | 1.04% | 9,750 | 49.20% | 19,820 |
| Cuyahoga | 284,094 | 43.60% | 362,626 | 55.65% | 4,913 | 0.75% | -78,532 | -12.05% | 651,633 |
| Darke | 16,379 | 72.81% | 5,904 | 26.25% | 211 | 0.94% | 10,475 | 46.56% | 22,494 |
| Defiance | 10,951 | 67.89% | 5,004 | 31.02% | 175 | 1.08% | 5,947 | 36.87% | 16,130 |
| Delaware | 19,050 | 76.23% | 5,773 | 23.10% | 166 | 0.66% | 13,277 | 53.13% | 24,989 |
| Erie | 19,174 | 57.83% | 13,508 | 40.74% | 472 | 1.42% | 5,666 | 17.09% | 33,154 |
| Fairfield | 30,843 | 75.17% | 9,817 | 23.92% | 373 | 0.91% | 21,026 | 51.25% | 41,033 |
| Fayette | 6,838 | 75.80% | 2,126 | 23.57% | 57 | 0.63% | 4,712 | 52.23% | 9,021 |
| Franklin | 250,360 | 64.12% | 131,530 | 33.68% | 8,584 | 2.20% | 118,830 | 30.44% | 390,474 |
| Fulton | 11,412 | 72.55% | 4,217 | 26.81% | 101 | 0.64% | 7,195 | 45.74% | 15,730 |
| Gallia | 8,194 | 65.27% | 4,251 | 33.86% | 109 | 0.87% | 3,943 | 31.41% | 12,554 |
| Geauga | 22,369 | 68.29% | 9,954 | 30.39% | 431 | 1.32% | 12,415 | 37.90% | 32,754 |
| Greene | 34,267 | 66.27% | 17,129 | 33.12% | 316 | 0.61% | 17,138 | 33.15% | 51,712 |
| Guernsey | 10,252 | 66.81% | 4,967 | 32.37% | 125 | 0.81% | 5,285 | 34.44% | 15,344 |
| Hamilton | 246,288 | 63.34% | 140,350 | 36.10% | 2,177 | 0.56% | 105,938 | 27.24% | 388,815 |
| Hancock | 22,169 | 78.34% | 5,758 | 20.35% | 370 | 1.31% | 16,411 | 57.99% | 28,297 |
| Hardin | 8,722 | 69.11% | 3,813 | 30.21% | 85 | 0.67% | 4,909 | 38.90% | 12,620 |
| Harrison | 4,276 | 55.45% | 3,370 | 43.70% | 66 | 0.86% | 906 | 11.75% | 7,712 |
| Henry | 9,317 | 76.54% | 2,779 | 22.83% | 77 | 0.63% | 6,538 | 53.71% | 12,173 |
| Highland | 9,000 | 69.90% | 3,784 | 29.39% | 91 | 0.71% | 5,216 | 40.51% | 12,875 |
| Hocking | 6,071 | 64.16% | 3,280 | 34.66% | 112 | 1.18% | 2,791 | 29.50% | 9,463 |
| Holmes | 5,146 | 74.11% | 1,737 | 25.01% | 61 | 0.88% | 3,409 | 49.10% | 6,944 |
| Huron | 14,388 | 67.96% | 6,609 | 31.22% | 174 | 0.82% | 7,779 | 36.74% | 21,171 |
| Jackson | 7,411 | 62.24% | 4,369 | 36.69% | 128 | 1.07% | 3,042 | 25.55% | 11,908 |
| Jefferson | 17,105 | 42.47% | 22,832 | 56.69% | 340 | 0.84% | -5,727 | -14.22% | 40,277 |
| Knox | 14,062 | 70.66% | 5,730 | 28.79% | 109 | 0.55% | 8,332 | 41.87% | 19,901 |
| Lake | 54,587 | 59.12% | 36,711 | 39.76% | 1,027 | 1.11% | 17,876 | 19.36% | 92,325 |
| Lawrence | 14,793 | 55.96% | 11,431 | 43.24% | 213 | 0.81% | 3,362 | 12.72% | 26,437 |
| Licking | 37,560 | 72.26% | 13,995 | 26.93% | 421 | 0.81% | 23,565 | 45.33% | 51,976 |
| Logan | 12,230 | 76.54% | 3,645 | 22.81% | 104 | 0.65% | 8,585 | 53.73% | 15,979 |
| Lorain | 57,379 | 50.77% | 52,970 | 46.87% | 2,672 | 2.36% | 4,409 | 3.90% | 113,021 |
| Lucas | 100,285 | 50.25% | 97,293 | 48.76% | 1,976 | 0.99% | 2,992 | 1.49% | 199,554 |
| Madison | 8,979 | 74.91% | 2,928 | 24.43% | 80 | 0.67% | 6,051 | 50.48% | 11,987 |
| Mahoning | 53,424 | 40.65% | 76,514 | 58.21% | 1,500 | 1.14% | -23,090 | -17.56% | 131,438 |
| Marion | 17,392 | 65.77% | 8,827 | 33.38% | 224 | 0.85% | 8,565 | 32.39% | 26,443 |
| Medina | 30,690 | 65.38% | 15,897 | 33.86% | 357 | 0.76% | 14,793 | 31.52% | 46,944 |
| Meigs | 6,307 | 63.52% | 3,549 | 35.74% | 73 | 0.74% | 2,758 | 27.78% | 9,929 |
| Mercer | 11,542 | 71.49% | 4,422 | 27.39% | 180 | 1.11% | 7,120 | 44.10% | 16,144 |
| Miami | 26,300 | 72.42% | 9,695 | 26.70% | 320 | 0.88% | 16,605 | 45.72% | 36,315 |
| Monroe | 3,302 | 47.32% | 3,611 | 51.75% | 65 | 0.93% | -309 | -4.43% | 6,978 |
| Montgomery | 137,053 | 58.97% | 94,016 | 40.45% | 1,333 | 0.57% | 43,037 | 18.52% | 232,402 |
| Morgan | 3,994 | 67.66% | 1,868 | 31.64% | 41 | 0.69% | 2,126 | 36.02% | 5,903 |
| Morrow | 8,116 | 73.50% | 2,839 | 25.71% | 87 | 0.79% | 5,277 | 47.79% | 11,042 |
| Muskingum | 21,821 | 67.98% | 10,037 | 31.27% | 243 | 0.76% | 11,784 | 36.71% | 32,101 |
| Noble | 3,853 | 67.70% | 1,777 | 31.22% | 61 | 1.07% | 2,076 | 36.48% | 5,691 |
| Ottawa | 10,920 | 60.41% | 7,053 | 39.02% | 102 | 0.56% | 3,867 | 21.39% | 18,075 |
| Paulding | 5,545 | 65.71% | 2,811 | 33.31% | 83 | 0.98% | 2,734 | 32.40% | 8,439 |
| Perry | 7,548 | 65.09% | 3,961 | 34.16% | 88 | 0.76% | 3,587 | 30.93% | 11,597 |
| Pickaway | 11,942 | 73.90% | 4,110 | 25.43% | 108 | 0.67% | 7,832 | 48.47% | 16,160 |
| Pike | 6,318 | 55.90% | 4,895 | 43.31% | 89 | 0.79% | 1,423 | 12.59% | 11,302 |
| Portage | 29,536 | 57.14% | 21,719 | 42.02% | 432 | 0.84% | 7,817 | 15.12% | 51,687 |
| Preble | 11,065 | 71.84% | 4,198 | 27.25% | 140 | 0.91% | 6,867 | 44.59% | 15,403 |
| Putnam | 11,936 | 78.26% | 3,194 | 20.94% | 121 | 0.79% | 8,742 | 57.32% | 15,251 |
| Richland | 35,299 | 68.10% | 16,141 | 31.14% | 396 | 0.76% | 19,158 | 36.96% | 51,836 |
| Ross | 17,015 | 66.60% | 8,020 | 31.39% | 513 | 2.01% | 8,995 | 35.21% | 25,548 |
| Sandusky | 17,214 | 66.16% | 8,564 | 32.91% | 242 | 0.93% | 8,650 | 33.25% | 26,020 |
| Scioto | 18,818 | 56.65% | 14,120 | 42.51% | 281 | 0.85% | 4,698 | 14.14% | 33,219 |
| Seneca | 16,520 | 67.04% | 7,905 | 32.08% | 217 | 0.88% | 8,615 | 34.96% | 24,642 |
| Shelby | 13,509 | 75.12% | 4,315 | 23.99% | 159 | 0.88% | 9,194 | 51.13% | 17,983 |
| Stark | 98,434 | 59.69% | 65,157 | 39.51% | 1,325 | 0.80% | 33,277 | 20.18% | 164,916 |
| Summit | 115,637 | 50.99% | 109,569 | 48.32% | 1,574 | 0.69% | 6,068 | 2.67% | 226,780 |
| Trumbull | 45,623 | 44.18% | 56,902 | 55.11% | 734 | 0.71% | -11,279 | -10.93% | 103,259 |
| Tuscarawas | 19,366 | 59.13% | 13,149 | 40.14% | 239 | 0.73% | 6,217 | 18.99% | 32,754 |
| Union | 9,336 | 77.79% | 2,579 | 21.49% | 86 | 0.72% | 6,757 | 56.30% | 12,001 |
| Van Wert | 9,570 | 73.68% | 3,338 | 25.70% | 80 | 0.62% | 6,232 | 47.98% | 12,988 |
| Vinton | 3,041 | 59.80% | 1,990 | 39.13% | 54 | 1.06% | 1,051 | 20.67% | 5,085 |
| Warren | 29,848 | 76.40% | 9,031 | 23.11% | 191 | 0.49% | 20,817 | 53.29% | 39,070 |
| Washington | 16,529 | 66.13% | 7,920 | 31.69% | 544 | 2.18% | 8,609 | 34.44% | 24,993 |
| Wayne | 24,475 | 67.79% | 11,323 | 31.36% | 305 | 0.84% | 13,152 | 36.43% | 36,103 |
| Williams | 10,804 | 74.11% | 3,624 | 24.86% | 150 | 1.03% | 7,180 | 49.25% | 14,578 |
| Wood | 29,750 | 64.74% | 15,907 | 34.62% | 297 | 0.65% | 13,843 | 30.12% | 45,954 |
| Wyandot | 7,204 | 74.81% | 2,342 | 24.32% | 84 | 0.87% | 4,862 | 50.49% | 9,630 |
| Totals | 2,678,560 | 58.90% | 1,825,440 | 40.14% | 43,619 | 0.96% | 853,119 | 18.76% | 4,547,619 |
Counties that flipped from Democratic to Republican edit
See also edit
References edit
- ^ "1984 Presidential General Election Results – Ohio". Dave Leip's Atlas of U.S. Presidential Elections. Retrieved February 7, 2018.
- ^ "Dems take lead in the U.S. House". Chillicothe Gazette. November 7, 1984. p. 8. Archived from the original on January 7, 2022. Retrieved January 7, 2022 – via Newspapers.com.
- ^ Sullivan, Robert David; ‘How the Red and Blue Map Evolved Over the Past Century’; America Magazine in The National Catholic Review; June 29, 2016
- ^ Ranney 1985, p. 54.
Works cited edit
- Ranney, Austin, ed. (1985). The American Elections of 1984. Duke University Press. ISBN 0822302306.