
KNOWPIA
WELCOME TO KNOWPIA

1993 Australian Senate election 
Summary
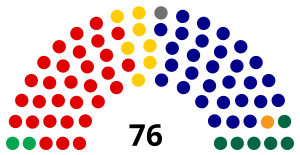
The following tables show state-by-state results in the Australian Senate at the 1993 federal election. Senators total 34 coalition (29 Liberal, four coalition National, one CLP), 30 Labor, two Green, two non-coalition National, seven Democrats, and one Independent.[1] Senator terms are six years (three for territories), and took their seats from 1 July 1993, except the territories who took their seats immediately.
| ||||||||||||||||||||||||||||||||||||||||||||||||||||||||||||||||||||||||||
40 of the 76 seats in the Australian Senate 39 seats needed for a majority | ||||||||||||||||||||||||||||||||||||||||||||||||||||||||||||||||||||||||||
|---|---|---|---|---|---|---|---|---|---|---|---|---|---|---|---|---|---|---|---|---|---|---|---|---|---|---|---|---|---|---|---|---|---|---|---|---|---|---|---|---|---|---|---|---|---|---|---|---|---|---|---|---|---|---|---|---|---|---|---|---|---|---|---|---|---|---|---|---|---|---|---|---|---|---|
| ||||||||||||||||||||||||||||||||||||||||||||||||||||||||||||||||||||||||||
 Senators elected in the 1993 federal election | ||||||||||||||||||||||||||||||||||||||||||||||||||||||||||||||||||||||||||
| ||||||||||||||||||||||||||||||||||||||||||||||||||||||||||||||||||||||||||


Australia edit
| Party | Votes | % | Swing | Seats won | Seats held | Change | ||
|---|---|---|---|---|---|---|---|---|
| Labor | 4,643,871 | 43.50 | +5.09 | 17 | 30 | |||
| Liberal–National joint ticket | 2,605,157 | 24.40 | –0.07 | 6 | N/A | N/A | ||
| Liberal | 1,664,204 | 15.59 | +1.03 | 11 | 29 | |||
| National | 290,382 | 2.72 | +0.12 | 1 | 6 | |||
| Country Liberal | 35,405 | 0.33 | +0.04 | 1 | 1 | |||
| Liberal–National coalition | 4,595,148 | 43.05 | +1.13 | 19 | 36 | |||
| Democrats | 566,944 | 5.31 | –7.32 | 2 | 7 | |||
| Greens [a] | 314,845 | 2.95 | +0.85 | 1 | 2 | |||
| Call to Australia | 108,945 | 1.02 | –0.35 | |||||
| Shooters | 63,691 | 0.60 | +0.60 | |||||
| Confederate Action | 59,875 | 0.56 | +0.56 | |||||
| Against Further Immigration | 46,857 | 0.44 | +0.24 | |||||
| Democratic Labor | 38,317 | 0.36 | +0.21 | |||||
| Natural Law | 38,054 | 0.36 | +0.36 | |||||
| Pensioner and CIR | 22,209 | 0.21 | +0.03 | |||||
| Grey Power | 17,595 | 0.16 | –0.11 | |||||
| Republican | 15,187 | 0.14 | +0.14 | |||||
| Indigenous Peoples | 6,422 | 0.06 | +0.06 | |||||
| Independent EFF | 6,031 | 0.06 | –0.58 | |||||
| Citizens Electoral Council | 5,578 | 0.05 | –0.02 | |||||
| Tasmania First | 2,815 | 0.03 | +0.03 | |||||
| Abolish Self Govt | 1,708 | 0.02 | +0.02 | |||||
| Others [b] | 120,713 | 1.13 | –1.11 | 1 | 1 | |||
| Total | 10,674,805 | 40 | 76 | |||||
| Invalid/blank votes | 279,453 | 2.55 | ||||||
| Turnout | 10,954,258 | 96.22 | ||||||
| Registered voters | 11,384,638 | |||||||
| Source: Federal Elections 1993 | ||||||||
New South Wales edit
| Elected | # | Senator | Party | |
|---|---|---|---|---|
| 1993 | 1 | Graham Richardson | Labor | |
| 2 | Michael Baume | Liberal | ||
| 3 | John Faulkner | Labor | ||
| 4 | John Tierney | Liberal | ||
| 5 | Kerry Sibraa | Labor | ||
| 6 | Sandy Macdonald | National | ||
| 1990 | 1 | Stephen Loosley | Labor | |
| 2 | Bronwyn Bishop | Liberal | ||
| 3 | Bruce Childs | Labor | ||
| 4 | David Brownhill | National | ||
| 5 | Vicki Bourne | Democrats | ||
| 6 | Suzanne West | Labor | ||
| Party | Candidate | Votes | % | ±% | |
|---|---|---|---|---|---|
| Quota | 512,012 | ||||
| Labor | 1. Graham Richardson (elected 1) 2. John Faulkner (elected 3) 3. Kerry Sibraa (elected 5) 4. Mary-Anne Armstrong |
1,681,528 | 46.9 | +6.2 | |
| Coalition | 1. Michael Baume (Lib) (elected 2) 2. John Tierney (Lib) (elected 4) 3. Sandy Macdonald (Nat) (elected 6) 4. Marise Payne (Lib) |
1,394,111 | 38.9 | +0.6 | |
| Democrats | 1. Karin Sowada 2. Ray Griffiths 3. Arthur Chesterfield-Evans |
176,324 | 4.9 | -6.9 | |
| Greens | 1. Steve Brigham 2. Joy Wallace 3. Ian Cohen 4. Cecily Stead |
74,620 | 2.1 | +2.0 | |
| Shooters | 1. Michael Ascher 2. Ted Orr 3. Jeff Wilkie 4. Suzanne O'Connell 5. Robyn Bourke |
63,691 | 1.8 | +1.8 | |
| Call to Australia | 1. Bruce Coleman 2. Graham McLennan 3. Shirley Grigg 4. Glen Ryan |
53,445 | 1.5 | -0.6 | |
| Green Alliance | 1. Jane Beckmann 2. Bernie Brian |
46,971 | 1.3 | -0.6 | |
| Against Further Immigration | 1. David Kitson 2. Ian Watherlake |
23,941 | 0.7 | +0.7 | |
| Group E | 1. Leonard Teale 2. Colin Ward |
14,883 | 0.4 | +0.4 | |
| Grey Power | 1. Frances Roylance 2. Gay Grounds |
10,428 | 0.3 | -0.2 | |
| Natural Law | 1. Doreen Kerr 2. Mike Smith 3. Ines Judd |
10,404 | 0.3 | +0.3 | |
| Confederate Action | 1. John Uebergang 2. Doug Hawkins |
6,725 | 0.2 | +0.2 | |
| Independent | Milorad Gajin | 5,208 | 0.1 | +0.1 | |
| Republican | 1. Peter Consadine 2. Gennie Klein |
4,717 | 0.1 | +0.1 | |
| Citizens Electoral Council | 1. Leone Hay 2. Robert Butler 3. Gloria Wood |
3,813 | 0.1 | -0.1 | |
| Group J | 1. O Santa Claus 2. Lord Rolo |
3,648 | 0.1 | +0.1 | |
| Group H | 1. Patricia Poulos 2. Peter Archer 3. John Holley |
2,127 | 0.1 | +0.1 | |
| Group S | 1. Walter Bass 2. Paul Hales |
2,054 | 0.1 | +0.1 | |
| Group M | 1. David Stevens 2. Yvonne Harrison |
1,384 | 0.1 | +0.1 | |
| Group U | 1. Robert Schollbach 2. Karen Stirling |
1,133 | 0.0 | 0.0 | |
| Group Q | 1. Rosemary Lavery 2. Robert John 3. Priscilla Lavery |
670 | 0.0 | 0.0 | |
| Independent | Michael Anderson | 533 | 0.0 | 0.0 | |
| Independent | Dianne Decker | 528 | 0.0 | 0.0 | |
| Group T | 1. Michael Vescio 2. Pamela Wheatley |
386 | 0.0 | 0.0 | |
| Independent | Argy Beletich | 317 | 0.0 | 0.0 | |
| Independent | Malcolm Milton | 168 | 0.0 | 0.0 | |
| Independent | Katherine De Bry | 150 | 0.0 | 0.0 | |
| Independent | Ron Poulsen | 86 | 0.0 | 0.0 | |
| Independent | Bryan Ellis | 86 | 0.0 | 0.0 | |
| Total formal votes | 3,584,079 | 97.3 | +1.6 | ||
| Informal votes | 97,534 | 2.7 | -1.6 | ||
| Turnout | 3,681,613 | 96.5 | +0.6 | ||
Victoria edit
| Elected | # | Senator | Party | |
|---|---|---|---|---|
| 1993 | 1 | Gareth Evans | Labor | |
| 2 | Jim Short | Liberal | ||
| 3 | Kim Carr | Labor | ||
| 4 | Julian McGauran | National | ||
| 5 | Olive Zakharov | Labor | ||
| 6 | Judith Troeth | Liberal | ||
| 1990 | 1 | Richard Alston | Liberal | |
| 2 | Robert Ray | Labor | ||
| 3 | Kay Patterson | Liberal | ||
| 4 | Barney Cooney | Labor | ||
| 5 | Rod Kemp | Liberal | ||
| 6 | Sid Spindler | Democrats | ||
| Party | Candidate | Votes | % | ±% | |
|---|---|---|---|---|---|
| Quota | 392,370 | ||||
| Labor | 1. Gareth Evans (elected 1) 2. Kim Carr (elected 3) 3. Olive Zakharov (elected 5) 4. David McKenzie |
1,235,344 | 45.0 | +8.6 | |
| Coalition | 1. Jim Short (Lib) (elected 2) 2. Julian McGauran (Nat) (elected 4) 3. Judith Troeth (Lib) (elected 6) 4. Tsebin Tchen (Lib) 5. Ian Curtis (Lib) 6. Bill Wall (Lib) |
1,211,046 | 44.0 | -0.5 | |
| Democrats | 1. Robert Wood 2. Maria Kayak 3. Marj White 4. John Pinniger 5. Diane Casbolt 6. Kathryn Stear |
109,223 | 4.0 | -10.1 | |
| Democratic Labor | 1. John Mulholland 2. Michael Rowe 3. Pat Crea 4. Christine Dodd 5. Matthew Cody |
38,317 | 1.4 | +0.8 | |
| Group B | 1. Janet Powell 2. Michael Hamel-Green 3. Anne O'Rourke 4. Laurie Levy |
33,710 | 1.2 | +1.2 | |
| Greens | 1. Francesca Davidson 2. Loretta Asquini |
32,472 | 1.2 | +0.3 | |
| Pensioner and CIR | 1. Neil McKay 2. Alistair McKay |
22,209 | 0.8 | +0.8 | |
| Call to Australia | 1. Ken Cook 2. Murray Graham |
20,105 | 0.7 | +0.7 | |
| Against Further Immigration | 1. Denis McCormack 2. Robyn Spencer |
18,926 | 0.7 | +0.7 | |
| Natural Law | 1. Steve Griffith 2. Lorna Scurfield 3. Ngaire Mason |
12,347 | 0.4 | +0.4 | |
| Republican | 1. Brian Buckley 2. Brendan Gidley |
4,760 | 0.2 | +0.2 | |
| Independent | Frank Hardy | 3,523 | 0.1 | +0.1 | |
| Independent | Toma Banjanin | 2,216 | 0.1 | +0.1 | |
| Independent | Tim Petherbridge | 790 | 0.0 | 0.0 | |
| Independent | Abdul Fazal | 565 | 0.0 | 0.0 | |
| Independent | Gordon Moffatt | 365 | 0.0 | 0.0 | |
| Group K | 1. Joe Toscano 2. Stephen Roper |
199 | 0.0 | 0.0 | |
| Independent | Michael Good | 167 | 0.0 | 0.0 | |
| Independent | Steve Florin | 90 | 0.0 | 0.0 | |
| Independent | Ivan Pavlekovich-Smith | 64 | 0.0 | 0.0 | |
| Citizens Electoral Council | Noelene Isherwood | 52 | 0.0 | 0.0 | |
| Independent | Laurie Bell | 49 | 0.0 | 0.0 | |
| Citizens Electoral Council | Alex Rotaru | 45 | 0.0 | 0.0 | |
| Total formal votes | 2,746,584 | 96.9 | +0.5 | ||
| Informal votes | 86,634 | 3.1 | -0.5 | ||
| Turnout | 2,833,218 | 96.6 | +0.4 | ||
Queensland edit
| Elected | # | Senator | Party | |
|---|---|---|---|---|
| 1993 | 1 | Margaret Reynolds | Labor | |
| 2 | David MacGibbon | Liberal | ||
| 3 | Bill O'Chee | National | ||
| 4 | Mal Colston | Labor | ||
| 5 | Warwick Parer | Liberal | ||
| 6 | John Woodley | Democrats | ||
| 1990 | 1 | Gerry Jones | Labor | |
| 2 | Ian Macdonald | Liberal | ||
| 3 | Gerry Jones | Labor | ||
| 4 | John Herron | Liberal | ||
| 5 | Ron Boswell | National | ||
| 6 | Cheryl Kernot | Democrats | ||
| Party | Candidate | Votes | % | ±% | |
|---|---|---|---|---|---|
| Quota | 264,381 | ||||
| Labor | 1. Margaret Reynolds (elected 1) 2. Mal Colston (elected 4) 3. John Bird 4. Ian McLean |
729,265 | 39.4 | +0.3 | |
| Liberal | 1. David MacGibbon (elected 2) 2. Warwick Parer (elected 5) 3. Ross Cunningham 4. Ann Buchanan 5. Henry Bird 6. Owen Davies |
582,766 | 31.5 | +2.2 | |
| National | 1. Bill O'Chee (elected 3) 2. De-Anne Kelly 3. Teresa Cobb |
268,809 | 14.5 | +0.9 | |
| Democrats | 1. John Woodley (elected 6) 2. Jonathan Cornish 3. Gayle Woodrow 4. Tony Walters |
130,405 | 7.1 | -5.4 | |
| Greens | 1. Drew Hutton 2. Colin Hunt 3. Naomi Spencer |
59,303 | 3.2 | +3.2 | |
| Confederate Action | 1. Perry Jewell 2. Tony Pitt 3. Sandra Hill 4. Mark Geissmann 5. Ryland Gill 6. Richard Teague |
52,942 | 2.9 | +2.9 | |
| Call to Australia | 1. Alan Sims 2. Rona Joyner |
11,546 | 0.6 | -0.5 | |
| Indigenous Peoples | 1. Darby McCarthy 2. Una Branfield |
6,422 | 0.3 | +0.3 | |
| Natural Law | 1. Geoff Wilson 2. Peter Jackson |
3,575 | 0.2 | +0.2 | |
| Group E | 1. Barry Weedon 2. Margaret Crompton |
2,030 | 0.1 | +0.1 | |
| Group H | 1. Ronald Alford 2. Sylvia Smith |
1,272 | 0.1 | +0.1 | |
| Independent | Steve Dimitriou | 1,043 | 0.1 | +0.1 | |
| Citizens Electoral Council | John Koehler | 538 | 0.0 | 0.0 | |
| Citizens Electoral Council | Julie Warner | 254 | 0.0 | 0.0 | |
| Independent | Joe Sherlock | 236 | 0.0 | 0.0 | |
| Independent | Barry Garvey | 150 | 0.0 | 0.0 | |
| Independent | Christopher Beilby | 105 | 0.0 | 0.0 | |
| Total formal votes | 1,850,661 | 98.0 | +0.5 | ||
| Informal votes | 38,491 | 2.0 | -0.5 | ||
| Turnout | 1,889,152 | 95.8 | +0.7 | ||
Western Australia edit
| Elected | # | Senator | Party | |
|---|---|---|---|---|
| 1993 | 1 | Sue Knowles | Liberal | |
| 2 | Peter Cook | Labor | ||
| 3 | Ian Campbell | Liberal | ||
| 4 | Chris Evans | Labor | ||
| 5 | Chris Ellison | Liberal | ||
| 6 | Dee Margetts | Greens | ||
| 1990 | 1 | Noel Crichton-Browne | Liberal | |
| 2 | Jim McKiernan | Labor | ||
| 3 | John Panizza | Liberal | ||
| 4 | Michael Beahan | Labor | ||
| 5 | Winston Crane | Liberal | ||
| 6 | Jo Vallentine | Greens | ||
| Party | Candidate | Votes | % | ±% | |
|---|---|---|---|---|---|
| Quota | 139,397 | ||||
| Liberal | 1. Sue Knowles (elected 1) 2. Ian Campbell (elected 3) 3. Chris Ellison (elected 5) 4. Maurice Brockwell 5. Enzo Sirna 6. John McCausland |
472,131 | 48.3 | +5.0 | |
| Labor | 1. Peter Cook (elected 2) 2. Chris Evans (elected 4) 3. Mark Bishop 4. Neil Roberts |
373,247 | 38.3 | +4.7 | |
| Greens | 1. Dee Margetts (elected 6) 2. Chris Williams |
53,757 | 5.6 | -2.8 | |
| Democrats | 1. Jean Jenkins 2. Helen Hodgson |
39,849 | 4.0 | -5.3 | |
| National | 1. Michael Jardine 2. Paul Clune 3. David Lee |
17,075 | 1.7 | -1.2 | |
| Call to Australia | 1. Don Rogers 2. Beryl Rogers |
11,568 | 1.2 | +1.2 | |
| Natural Law | 1. Michael King 2. Philip Jackson 3. Jody Fitzhardinge 4. Peter Coppin |
3,569 | 0.3 | +0.3 | |
| Republican | 1. David Langley 2. Rodney Stratton |
1,519 | 0.2 | +0.2 | |
| Group J | 1. Frank Nesci 2. Paul Nesci |
953 | 0.1 | +0.1 | |
| Citizens Electoral Council | 1. John Seale 2. Laurence Molloy |
876 | 0.1 | +0.1 | |
| Independent | Rick Finney | 549 | 0.1 | +0.1 | |
| Grey Power | Salli Vaughan | 245 | 0.0 | -1.0 | |
| Independent | John Tucak | 226 | 0.0 | 0.0 | |
| Confederate Action | Roland Richardson | 208 | 0.0 | 0.0 | |
| Total formal votes | 975,772 | 97.9 | +0.8 | ||
| Informal votes | 20,983 | 2.1 | -0.8 | ||
| Turnout | 996,755 | 95.9 | +0.8 | ||
South Australia edit
| Elected | # | Senator | Party | |
|---|---|---|---|---|
| 1993 | 1 | Amanda Vanstone | Liberal | |
| 2 | Nick Bolkus | Labor | ||
| 3 | Nick Minchin | Liberal | ||
| 4 | Dominic Foreman | Labor | ||
| 5 | Alan Ferguson | Liberal | ||
| 6 | Meg Lees | Democrats | ||
| 1990 | 1 | Robert Hill | Liberal | |
| 2 | Rosemary Crowley | Labor | ||
| 3 | John Coulter | Democrats | ||
| 4 | Baden Teague | Liberal | ||
| 5 | Chris Schacht | Labor | ||
| 6 | Grant Chapman | Liberal | ||
| Party | Candidate | Votes | % | ±% | |
|---|---|---|---|---|---|
| Quota | 135,140 | ||||
| Liberal | 1. Amanda Vanstone (elected 1) 2. Nick Minchin (elected 3) 3. Alan Ferguson (elected 5) 4. Satish Gupta |
431,642 | 45.6 | +4.1 | |
| Labor | 1. Nick Bolkus (elected 2) 2. Dominic Foreman (elected 4) 3. Graham Maguire 4. Rosalie McDonald |
359,491 | 38.0 | +0.9 | |
| Democrats | 1. Meg Lees (elected 6) 2. Stephen Swift 3. Natasha Stott Despoja 4. Patricia Tickle |
93,325 | 9.8 | -6.5 | |
| Greens | 1. Ally Fricker 2. Gerhard Weissmann |
15,467 | 1.6 | -0.5 | |
| Call to Australia | 1. David Rodway 2. David Squirrell |
10,762 | 1.1 | -1.0 | |
| Natural Law | 1. Geoff Wells 2. Anne Martin 3. Dulcie Morris |
6,936 | 0.7 | +0.7 | |
| Grey Power | 1. Jack Holder 2. Betty Preston 3. Glen Bottam |
6,922 | 0.6 | +0.6 | |
| Independent EFF | 1. David Dwyer 2. Douglas Giddings 3. Vanessa Giddings |
6,031 | 0.6 | +0.6 | |
| National | 1. Nola McCallum 2. Michael Bradshaw |
4,498 | 0.5 | +0.1 | |
| Republican | 1. Bilal Nasrullah 2. Peter Hill |
4,191 | 0.4 | +0.4 | |
| Against Further Immigration | 1. Evonne Moore 2. Joe Smith |
3,597 | 0.3 | +0.3 | |
| Group F | 1. Alex Liew 2. Douglas Schirripa |
2,716 | 0.3 | +0.3 | |
| Independent | Mark Rice | 313 | 0.0 | 0.0 | |
| Independent | Ean Smith | 53 | 0.0 | 0.0 | |
| Independent | Bernard Broom | 31 | 0.0 | 0.0 | |
| Total formal votes | 945,975 | 97.7 | +0.2 | ||
| Informal votes | 22,390 | 2.3 | -0.2 | ||
| Turnout | 968,365 | 95.5 | -0.9 | ||
Tasmania edit
| Elected | # | Senator | Party | |
|---|---|---|---|---|
| 1993 | 1 | Michael Tate | Labor | |
| 2 | Brian Archer | Liberal | ||
| 3 | John Coates | Labor | ||
| 4 | Brian Gibson | Liberal | ||
| 5 | Brian Harradine | Independent | ||
| 6 | Shayne Murphy | Labor | ||
| 1990 | 1 | Jocelyn Newman | Liberal | |
| 2 | Nick Sherry | Labor | ||
| 3 | John Watson | Liberal | ||
| 4 | John Devereux | Labor | ||
| 5 | Paul Calvert | Liberal | ||
| 6 | Robert Bell | Democrat | ||
| Party | Candidate | Votes | % | ±% | |
|---|---|---|---|---|---|
| Quota | 44,110 | ||||
| Labor | 1. Michael Tate (elected 1) 2. John Coates (elected 3) 3. Shayne Murphy (elected 6) 4. Terry Aulich |
131,876 | 42.7 | +1.4 | |
| Liberal | 1. Brian Archer (elected 2) 2. Brian Gibson (elected 4) 3. Eric Abetz |
113,347 | 36.7 | -7.4 | |
| Independent | Brian Harradine (elected 5) | 32,202 | 10.4 | +10.4 | |
| Greens | 1. Judy Henderson 2. Peter Jones 3. Marion Fry |
21,087 | 6.9 | +6.9 | |
| Democrats | 1. Patsy Harmsen 2. David Stephen |
5,162 | 1.6 | -5.7 | |
| Tasmania First | 1. Alan Sproule 2. Frances McShane |
2,815 | 0.9 | +0.9 | |
| Call to Australia | 1. Philip Hopson 2. Janelle Hopson |
1,512 | 0.5 | +0.5 | |
| Natural Law | 1. Greg Broszczyk 2. Caroline Davies |
490 | 0.1 | +0.1 | |
| Independent | Ian Jamieson | 265 | 0.1 | +0.1 | |
| Total formal votes | 308,763 | 97.4 | +0.5 | ||
| Informal votes | 8,121 | 2.6 | -0.5 | ||
| Turnout | 316,884 | 96.6 | -0.3 | ||
Australian Capital Territory edit
| Elected | # | Senator | Party | |
|---|---|---|---|---|
| 1993 | 1 | Bob McMullan | Labor | |
| 2 | Margaret Reid | Liberal | ||
| Party | Candidate | Votes | % | ±% | |
|---|---|---|---|---|---|
| Quota | 61,276 | ||||
| Labor | 1. Bob McMullan (elected 1) 2. Maureen Sheehan |
89,380 | 48.6 | +7.5 | |
| Liberal | 1. Margaret Reid (elected 2) 2. Lucinda Spier |
64,318 | 35.0 | -1.0 | |
| Democrats | 1. Domenic Mico 2. Peter Main |
12,656 | 6.9 | -0.7 | |
| Greens | 1. Kerrie Tucker 2. David Turbayne |
11,168 | 6.0 | +2.7 | |
| Independent | Bernard Collaery | 3,470 | 1.9 | +1.9 | |
| Abolish Self Govt | 1. Helen Miller 2. Ute Ernst |
1,708 | 0.9 | +0.9 | |
| Natural Law | 1. David Seaton 2. Nanette Kerrison |
733 | 0.4 | +0.4 | |
| Independent | Arthur Burns | 393 | 0.2 | +0.2 | |
| Total formal votes | 183,826 | 98.4 | +0.8 | ||
| Informal votes | 2,988 | 1.6 | -0.8 | ||
| Turnout | 186,814 | 97.1 | +0.9 | ||
Northern Territory edit
| Elected | # | Senator | Party | |
|---|---|---|---|---|
| 1993 | 1 | Bob Collins | Labor | |
| 2 | Grant Tambling | CLP | ||
| Party | Candidate | Votes | % | ±% | |
|---|---|---|---|---|---|
| Quota | 26,382 | ||||
| Labor | 1. Bob Collins (elected 1) 2. Patty Ring |
43,740 | 55.3 | +1.0 | |
| Country Liberal | 1. Grant Tambling (elected 2) 2. Bob Truman |
35,405 | 44.7 | +2.5 | |
| Total formal votes | 79,145 | 97.2 | 0.0 | ||
| Informal votes | 2,312 | 2.8 | 0.0 | ||
| Turnout | 81,457 | 89.0 | -0.5 | ||
See also edit
Notes edit
- ^ The Australian Greens were founded in 1992, but not all state and territory organisations immediately affiliated to the new federal party. The Greens Senate total includes Queensland Greens (59,303), Greens Western Australia (53,757), New South Wales Green Alliance (46,971), ACT Green Democratic Alliance (46,971), Tasmanian Greens (21,087) and Greens South Australia (15,467).
- ^ The independent senator was Brian Harradine (Tasmania).
References edit
- ^ "Federal Election Results 1949-1993" (PDF). Parliament of Australia. Retrieved 3 March 2017.
External links edit
- Adam Carr's Election Archive