


Summary
General elections were held in Sweden on 20 September 1998.[1] The Swedish Social Democratic Party remained the largest party in the Riksdag, winning 131 of the 349 seats.[2]
| ||||||||||||||||||||||||||||||||||||||||||||||||||||||||||||||||||||||||||||||||||||||||||||||||||||||||||||
All 349 seats in the Riksdag 175 seats needed for a majority | ||||||||||||||||||||||||||||||||||||||||||||||||||||||||||||||||||||||||||||||||||||||||||||||||||||||||||||
|---|---|---|---|---|---|---|---|---|---|---|---|---|---|---|---|---|---|---|---|---|---|---|---|---|---|---|---|---|---|---|---|---|---|---|---|---|---|---|---|---|---|---|---|---|---|---|---|---|---|---|---|---|---|---|---|---|---|---|---|---|---|---|---|---|---|---|---|---|---|---|---|---|---|---|---|---|---|---|---|---|---|---|---|---|---|---|---|---|---|---|---|---|---|---|---|---|---|---|---|---|---|---|---|---|---|---|---|---|
| ||||||||||||||||||||||||||||||||||||||||||||||||||||||||||||||||||||||||||||||||||||||||||||||||||||||||||||
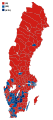
 Map of the election, showing the distribution of constituency and levelling seats, as well as the largest political bloc within each constituency. | ||||||||||||||||||||||||||||||||||||||||||||||||||||||||||||||||||||||||||||||||||||||||||||||||||||||||||||
| ||||||||||||||||||||||||||||||||||||||||||||||||||||||||||||||||||||||||||||||||||||||||||||||||||||||||||||


The incumbent Social Democratic minority government, led by Göran Persson, was returned to power despite losing seats and receiving fewer votes than in their 1991 defeat. They remained in power with support from the Left Party and the Green Party. While the three left-wing parties saw a net loss of 11 seats, the Left Party nearly doubled its representation in the Riksdag. This reflected how many Social Democratic voters were dissatisfied with the policies of the government, which had implemented austerity measures to reduce the budget deficit.
The Social Democrats were able to form a government in spite of the sizeable decline of the vote, since the centre-right parties failed to recover more than a net share of 11 seats out of the required 27. The most notable gain was that the capital Stockholm going blue in spite of a stable nationwide left-leaning majority, something that previously had been unlikely. In suburban areas around the two largest cities several municipalities also flipped blue. Other gains were in the blue heartlands of Southern Sweden, with Jönköping and Linköping being major pickups. Even so, 23 out of 29 constituencies voted for the leftist parties. Gothenburg remained in the red column in spite of a large net swing towards the opposition.
Even so, smaller municipalities away from the bigger cities gave the red-green bloc a sizeable edge, with the Left Party getting into double-digits nationwide. Even though there was a drop of support in major cities, many areas that had previously voted blue remained with the red-green bloc. For the Social Democrats, the steep drop of the party's nationwide vote share was still felt in many of its historically strong industrial areas. The party's vote share had dropped to a 70-year low and many absolute majorities from 1994 election were lost.[3]
Besides from the Left Party, the other party that made major gains were the Christian Democrats. The party had been on the verge of falling out of the Riksdag in 1994, yet almost tripled its vote share to end up at 11.8%, even being the largest centre-right party in its stronghold of Jönköping County.[3] The former heads of government, the Centre Party, continued its decline and recorded 5.1% of the vote, more than a million fewer overall votes than in the 1970s elections.[3] The People's Party fared even worse at 4.7%.
Debates edit
| 1998 Swedish general election debates | |||||||||||
|---|---|---|---|---|---|---|---|---|---|---|---|
| Date | Time | Organizers | Moderators | P Present I Invitee N Non-invitee | |||||||
| S | M | C | L | V | MP | KD | Refs | ||||
| Sveriges Television | Claes Elfsberg
Inga-Lill Usterud |
P Göran Persson |
P Carl Bildt |
P Lennart Daléus |
P Lars Leijonborg |
P Gudrun Schyman |
P Birger Schlaug |
P Alf Svensson |
[4] | ||
Results edit
There were 5,261,109 valid ballots cast, a sizeable decrease in turnout from the 1994 election, with turnout dropping from 86.8% to 81.4%.[3]
 | |||||
|---|---|---|---|---|---|
| Party | Votes | % | Seats | +/– | |
| Swedish Social Democratic Party | 1,914,426 | 36.40 | 131 | –30 | |
| Moderate Party | 1,204,926 | 22.91 | 82 | +2 | |
| Left Party | 631,011 | 12.00 | 43 | +21 | |
| Christian Democrats | 618,033 | 11.75 | 42 | +27 | |
| Centre Party | 269,762 | 5.13 | 18 | –9 | |
| Liberal People's Party | 248,076 | 4.72 | 17 | –9 | |
| Green Party | 236,699 | 4.50 | 16 | –2 | |
| Swedish Senior Citizen Interest Party | 52,869 | 1.01 | 0 | 0 | |
| The New Party | 25,276 | 0.48 | 0 | 0 | |
| Sweden Democrats | 19,624 | 0.37 | 0 | 0 | |
| New Future | 9,171 | 0.17 | 0 | 0 | |
| New Democracy | 8,297 | 0.16 | 0 | 0 | |
| Senior Citizen Party | 6,865 | 0.13 | 0 | 0 | |
| Socialist Justice Party | 3,044 | 0.06 | 0 | 0 | |
| Communist Party | 1,868 | 0.04 | 0 | 0 | |
| Unity | 1,725 | 0.03 | 0 | 0 | |
| Socialist Party | 1,466 | 0.03 | 0 | 0 | |
| Other parties | 6,971 | 0.13 | 0 | 0 | |
| Total | 5,260,109 | 100.00 | 349 | 0 | |
| Valid votes | 5,260,109 | 97.89 | |||
| Invalid/blank votes | 113,466 | 2.11 | |||
| Total votes | 5,373,575 | 100.00 | |||
| Registered voters/turnout | 6,603,129 | 81.38 | |||
| Source: Statistical Central Bureau | |||||
Seat distribution edit
| Constituency | Total seats |
Seats won | |||||||||
|---|---|---|---|---|---|---|---|---|---|---|---|
| By party | By coalition | ||||||||||
| S | M | V | KD | C | F | MP | Red-green | Right | |||
| Blekinge | 6 | 3 | 1 | 1 | 1 | 4 | 2 | ||||
| Dalarna | 11 | 4 | 2 | 2 | 1 | 1 | 1 | 7 | 4 | ||
| Gävleborg | 12 | 5 | 2 | 2 | 1 | 1 | 1 | 8 | 4 | ||
| Gothenburg | 17 | 5 | 5 | 3 | 2 | 1 | 1 | 9 | 8 | ||
| Gotland | 2 | 1 | 1 | 1 | 1 | ||||||
| Halland | 12 | 4 | 3 | 1 | 2 | 1 | 1 | 5 | 7 | ||
| Jämtland | 5 | 2 | 1 | 1 | 1 | 3 | 2 | ||||
| Jönköping | 13 | 5 | 2 | 1 | 3 | 1 | 1 | 7 | 6 | ||
| Kalmar | 9 | 4 | 2 | 1 | 1 | 1 | 5 | 4 | |||
| Kronoberg | 7 | 3 | 1 | 1 | 1 | 1 | 4 | 3 | |||
| Malmö | 9 | 4 | 3 | 1 | 1 | 5 | 4 | ||||
| Norrbotten | 9 | 5 | 1 | 2 | 1 | 7 | 2 | ||||
| Örebro | 13 | 5 | 2 | 2 | 1 | 1 | 1 | 1 | 8 | 5 | |
| Östergötland | 17 | 6 | 4 | 2 | 2 | 1 | 1 | 1 | 9 | 8 | |
| Skåne North and East | 12 | 4 | 3 | 1 | 2 | 1 | 1 | 5 | 7 | ||
| Skåne South | 13 | 5 | 4 | 1 | 1 | 1 | 1 | 7 | 6 | ||
| Skåne West | 9 | 4 | 3 | 1 | 1 | 5 | 4 | ||||
| Södermanland | 10 | 5 | 2 | 1 | 1 | 1 | 7 | 3 | |||
| Stockholm County | 38 | 11 | 13 | 3 | 5 | 1 | 3 | 2 | 16 | 22 | |
| Stockholm Municipality | 28 | 7 | 10 | 4 | 3 | 2 | 2 | 13 | 15 | ||
| Uppsala | 12 | 4 | 3 | 1 | 1 | 1 | 1 | 1 | 6 | 6 | |
| Värmland | 12 | 5 | 2 | 2 | 1 | 1 | 1 | 7 | 5 | ||
| Västerbotten | 12 | 5 | 1 | 2 | 1 | 1 | 1 | 1 | 8 | 4 | |
| Västernorrland | 10 | 5 | 1 | 2 | 1 | 1 | 7 | 3 | |||
| Västmanland | 10 | 5 | 2 | 1 | 1 | 1 | 6 | 4 | |||
| Västra Götaland East | 10 | 4 | 2 | 1 | 2 | 1 | 5 | 5 | |||
| Västra Götaland North | 12 | 4 | 2 | 1 | 2 | 1 | 1 | 1 | 6 | 6 | |
| Västra Götaland South | 6 | 3 | 1 | 1 | 1 | 4 | 2 | ||||
| Västra Götaland West | 13 | 4 | 3 | 1 | 2 | 1 | 1 | 1 | 6 | 7 | |
| Total | 349 | 131 | 82 | 43 | 42 | 18 | 17 | 16 | 190 | 159 | |
| Source: Statistics Sweden | |||||||||||
By municipality edit
-
 Votes by municipality. The municipalities are the color of the party that got the most votes within the coalition that won relative majority.
 -
 Cartogram of the map to the left with each municipality rescaled to the number of valid votes cast.
 -
 Map showing the voting shifts from the 1994 to the 1998 election. Darker blue indicates a municipality voted more towards the parties that formed the centre-right bloc. Darker red indicates a municipality voted more towards the parties that form the left-wing bloc.
 -
 Votes by municipality as a scale from red/Left-wing bloc to blue/Centre-right bloc.
 -
 Cartogram of vote with each municipality rescaled in proportion to number of valid votes cast. Deeper blue represents a relative majority for the centre-right coalition, brighter red represents a relative majority for the left-wing coalition.


References edit
- ^ Dieter Nohlen & Philip Stöver (2010) Elections in Europe: A data handbook, p1858 ISBN 978-3-8329-5609-7
- ^ Nohlen & Stöver, p1873
- ^ a b c d "Allmänna valen 1998. Del 1, Riksdagen den 20 september 1998" (PDF) (in Swedish). Statistical Central Bureau. Retrieved 19 November 2019.
- ^ Sweden, Sveriges Television AB, Stockholm, Slutdebatter – Val-98: Partiledarnas slutdebatt (in Swedish), retrieved 2024-02-01
{{citation}}: CS1 maint: multiple names: authors list (link)