
KNOWPIA
WELCOME TO KNOWPIA

1998 elections in India 
Summary
Legislative Assembly elections edit
Delhi edit
 | |||||
|---|---|---|---|---|---|
| Party | Votes | % | Seats | +/– | |
| Indian National Congress | 1,952,071 | 47.75 | 52 | +38 | |
| Bharatiya Janata Party | 1,390,689 | 34.02 | 15 | –34 | |
| Janata Dal | 73,385 | 1.80 | 1 | –3 | |
| Others | 316,346 | 7.74 | 0 | 0 | |
| Independents | 355,773 | 8.70 | 2 | –1 | |
| Total | 4,088,264 | 100.00 | 70 | 0 | |
| Valid votes | 4,088,264 | 99.11 | |||
| Invalid/blank votes | 36,722 | 0.89 | |||
| Total votes | 4,124,986 | 100.00 | |||
| Registered voters/turnout | 8,420,141 | 48.99 | |||
| Source: ECI[1] | |||||
Gujarat edit
| Party | Votes | % | +/– | Seats | |
|---|---|---|---|---|---|
| Bharatiya Janata Party | 7,300,826 | 44.88 | -4 | 117 | |
| Indian National Congress | 5,677,386 | 34.90 | +8 | 53 | |
| AIRJP | 1,902,171 | 11.69 | 4 | ||
| Janata Dal | 429,283 | 2.64 | 4 | ||
| Independent | 854,142 | 5.25 | 3 | ||
| SP | 64,913 | 0.40 | 1 | ||
| Bahujan Samaj Party | 12,742 | 0.08 | 0 | 0 | |
| CPI | 10,292 | 0.06 | 0 | 0 | |
| SAP | 7,512 | 0.05 | – | ||
| Republican Party of India | 4,642 | 0.03 | – | ||
| Shiv Sena | 2,800 | 0.02 | – | ||
| RJD | 1,884 | 0.01 | – | ||
| Total | 16,268,593 | 100.00 | – | 182 | |
| Valid votes | 16,268,593 | 95.53 | |||
| Invalid/blank votes | 761,449 | 4.47 | |||
| Total votes | 17,030,042 | 100.00 | |||
| Registered voters/turnout | 28,774,443 | 59.18 | |||
| Source: ECI[2] | |||||
Himachal Pradesh edit
| Party | Votes | % | Seats | |
|---|---|---|---|---|
| Indian National Congress | 1,110,055 | 43.51 | 31 | |
| Bharatiya Janata Party | 995,482 | 39.02 | 31 | |
| Himachal Vikas Congress | 245,584 | 9.63 | – | |
| Independents and Others | 200,248 | 7.85 | 1 | |
| Total | 2,551,369 | 100.00 | 63 | |
| Source: [3] | ||||
Madhya Pradesh edit
Source:[4]
| SN | Party | Seats Contested |
Seats won |
Seats Changed |
% Votes |
|---|---|---|---|---|---|
| 1 | Indian National Congress | 316 | 172 | -2 | 40.59 |
| 2 | Bharatiya Janata Party | 320 | 119 | +2 | 39.28 |
| 3 | Bahujan Samaj Party | 221 | 11 | 0 | 6.15 |
| 4 | Janata Dal | 144 | 4 | + 3 | 1.87 |
| 5 | Samajwadi Party | 228 | 4 | + 4 | 1.58 |
| 6 | Gondvana Gantantra Party | 81 | 1 | 0 | 0.82 |
| 7 | Ajeya Bharat Party | 78 | 1 | + 1 | 0.55 |
| 8 | Janata Party | 14 | 1 | + 1 | 0.20 |
| 9 | Republican Party of India | 20 | 1 | + 1 | 0.13 |
| 10 | Independent | 320 | 8 | - 1 | 6.49 |
| Total | 320 |
Meghalaya edit
| Parties and coalitions | Popular vote | Seats | ||||
|---|---|---|---|---|---|---|
| Votes | % | ±pp | Won | +/− | ||
| Indian National Congress (INC) | 293,346 | 35.03 | 0.41 |
25 | 1 | |
| United Democratic Party (UDP)[a] | 226,026 | 26.99 | 6.48 |
20 | 1 | |
| People's Democratic Movement (PDM) | 58,225 | 6.95 | 3 | |||
| Hill State People's Democratic Party | 56,682 | 6.77 | 3 | |||
| Bharatiya Janata Party (BJP) | 41,924 | 5.01 | 1.33 |
3 | 3 | |
| Garo National Council (GNC) | 17,650 | 2.11 | 1 | |||
| Hindu Samaj Party (HSP) | 4,754 | 0.57 | 0 | |||
| Communist Party of India (CPI) | 1,387 | 0.17 | 0.03 |
0 | ||
| Rashtriya Janata Dal | 1,253 | 0.15 | 0 | |||
| Samajwadi Party | 742 | 0.09 | 0 | |||
| Janata Dal | 38 | 0.0 | 0 | |||
| Independents (IND) | 135,356 | 17.28 | 1.12 |
5 | 5 | |
| Total | 837,383 | 100.00 | 60 | ±0 | ||
| Source: Election Commission of India[5] | ||||||
a The UDP was formed in 1997 through a merger of the Hill People's Union (HPU), some members of the Hill State People's Democratic Party (HDP) and the Public Demands Implementation Convention (PDIC). Previous results presented in the table are the combined totals of parties' results from the 1993 election.
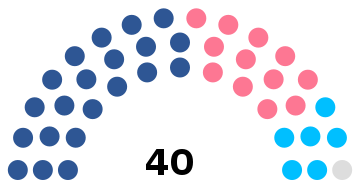
Mizoram edit
 | |||||
|---|---|---|---|---|---|
| Party | Votes | % | Seats | +/– | |
| Mizo National Front | 84,444 | 24.99 | 21 | ||
| Mizoram People's Conference | 69,078 | 20.44 | 12 | New | |
| Indian National Congress | 100,608 | 29.77 | 6 | ||
| Bharatiya Janata Party | 8,448 | 2.50 | 0 | 0 | |
| Janata Dal | 947 | 0.28 | 0 | New | |
| Samata Party | 940 | 0.28 | 0 | New | |
| Lok Shakti | 774 | 0.23 | 0 | New | |
| Rashtriya Janata Dal | 588 | 0.17 | 0 | New | |
| Maraland Democratic Front | 7,721 | 2.28 | 0 | New | |
| Mizo National Front (Nationalist) | 31,190 | 9.23 | 0 | New | |
| Independents | 33,200 | 9.82 | 1 | ||
| Total | 337,938 | 100.00 | 40 | 0 | |
| Valid votes | 337,938 | 99.44 | |||
| Invalid/blank votes | 1,913 | 0.56 | |||
| Total votes | 339,851 | 100.00 | |||
| Registered voters/turnout | 445,366 | 76.31 | |||
| Source: ECI[6] | |||||
Nagaland edit
 | |||||
|---|---|---|---|---|---|
| Party | Votes | % | Seats | +/– | |
| Indian National Congress | 103,206 | 50.73 | 53 | +18 | |
| Independents | 100,226 | 49.27 | 7 | 0 | |
| Total | 203,432 | 100.00 | 60 | 0 | |
| Valid votes | 203,432 | 98.86 | |||
| Invalid/blank votes | 2,356 | 1.14 | |||
| Total votes | 205,788 | 100.00 | |||
| Registered voters/turnout | 260,646 | 78.95 | |||
| Source: ECI[7] | |||||
Rajasthan edit
| Party | Seats | +/– | |
|---|---|---|---|
| Indian National Congress | 153 | ||
| Bharatiya Janata Party | 33 | ||
| Janata Dal | 3 | ||
| Bahujan Samaj Party | 2 | ||
| Rashtriya Janata Dal | 1 | New | |
| Communist Party of India (Marxist) | 1 | 0 | |
| Independents | 7 | ||
| Total | 200 | +1 | |
Tripura edit
Source:[8]
| Party | Seats Contested | Seats Won | No. of Votes | % of Votes | 1993 Seats |
|---|---|---|---|---|---|
| Bharatiya Janata Party | 60 | 0 | 80,272 | 5.87% | 0 |
| Communist Party of India | 2 | 1 | 18,802 | 1.38% | 0 |
| Communist Party of India (Marxist) | 55 | 38 | 621,804 | 45.49% | 44 |
| Indian National Congress | 45 | 13 | 464,171 | 33.96% | 10 |
| Janata Dal | 3 | 0 | 3,294 | 0.24% | 1 |
| Tripura Upajati Juba Samiti | 10 | 4 | 98,271 | 7.19% | 1 |
| Revolutionary Socialist Party | 2 | 2 | 22,526 | 1.65% | 2 |
| Independents | 60 | 2 | 44,940 | 3.29% | 1 |
| Total | 270 | 60 | 1,366,966 |
Rajya Sabha edit
References edit
- ^ "Statistical Report on General Election, 1998 to the Legislative Assembly of Delhi". Election Commission of India. Retrieved 14 February 2022.
- ^ "Gujarat Assembly elections on 1998".
- ^ Adam Carr's Election Archive
- ^ "STATISTICAL REPORT ON GENERAL ELECTION, 1998 TO THE LEGISLATIVE ASSEMBLY OF MADHYA PRADESH" (PDF). eci.nic.in. Election Commission of India. Retrieved 25 May 2018.
- ^ "Meghalaya 1998". Election Commission of India. Retrieved 15 May 2020.
- ^ "Statistical Report on General Election, 1998 to the Legislative Assembly of Mizoram". Election Commission of India. Retrieved 17 July 2021.
- ^ "Statistical Report on General Election, 1998 to the Legislative Assembly of Nagaland". Election Commission of India. Retrieved 29 August 2021.
- ^ "1998 Tripura Election result".
External links edit
Wikimedia Commons has media related to 1998 elections in India.
- Election Commission of India