


Summary
The 2000 United States presidential election in North Dakota took place on November 7, 2000, and was part of the 2000 United States presidential election. Voters chose three representatives, or electors to the Electoral College, who voted for president and vice president.
| ||||||||||||||||||||||||||
| ||||||||||||||||||||||||||
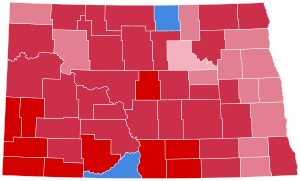 County Results
| ||||||||||||||||||||||||||
| ||||||||||||||||||||||||||
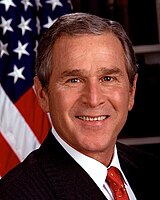
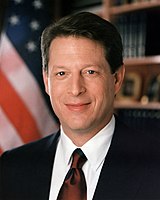
North Dakota was won by Governor George W. Bush with a double-digit margin of victory of 27.6%. Bush won most of the counties of the state. He won all but two counties: Rolette County, which Gore won with 61% of the vote and Sioux County, which Gore won with 70% of the vote. North Dakota gave Pat Buchanan his best performance in the nation with 2.5% of the vote,[1] whilst third-party candidates performed very well overall, obtaining a total of 6.6% of the vote.[2]
Winning 60.66% of the popular vote, North Dakota proved to be Bush's fifth strongest state in the 2000 election after Wyoming, Idaho, Utah and Nebraska.[3]
Results edit
| 2000 United States presidential election in North Dakota[4] | |||||
|---|---|---|---|---|---|
| Party | Candidate | Votes | Percentage | Electoral votes | |
| Republican | George W. Bush | 174,852 | 60.66% | 3 | |
| Democratic-NPL | Al Gore | 95,284 | 33.06% | 0 | |
| Independent | Ralph Nader | 9,486 | 3.29% | 0 | |
| Reform | Patrick Buchanan | 7,288 | 2.53% | 0 | |
| Libertarian | Harry Browne | 660 | 0.23% | 0 | |
| Independent | Howard Phillips | 373 | 0.13% | 0 | |
| Independent | John Hagelin | 313 | 0.11% | 0 | |
| Totals | 288,256 | 100.00% | 3 | ||
| Voter turnout | 60% | ||||
Results by county edit
| County[5] | George W. Bush Republican |
Al Gore Democratic-NPL |
Ralph Nader Independent |
Pat Buchanan Reform |
Various candidates Other parties |
Margin | Total votes cast | ||||||
|---|---|---|---|---|---|---|---|---|---|---|---|---|---|
| # | % | # | % | # | % | # | % | # | % | # | % | ||
| Adams | 826 | 71.21% | 286 | 24.66% | 23 | 1.98% | 21 | 1.81% | 4 | 0.34% | 540 | 46.55% | 1,160 |
| Barnes | 3,452 | 60.06% | 1,933 | 33.63% | 160 | 2.78% | 181 | 3.15% | 22 | 0.38% | 1,519 | 26.43% | 5,748 |
| Benson | 1,055 | 48.98% | 952 | 44.20% | 50 | 2.32% | 90 | 4.18% | 7 | 0.32% | 103 | 4.78% | 2,154 |
| Billings | 394 | 75.05% | 82 | 15.62% | 15 | 2.86% | 32 | 6.10% | 2 | 0.38% | 312 | 59.43% | 525 |
| Bottineau | 2,349 | 63.66% | 1,173 | 31.79% | 95 | 2.57% | 67 | 1.82% | 6 | 0.16% | 1,176 | 31.87% | 3,690 |
| Bowman | 1,080 | 73.42% | 330 | 22.43% | 40 | 2.72% | 19 | 1.29% | 2 | 0.14% | 750 | 50.99% | 1,471 |
| Burke | 698 | 67.18% | 296 | 28.49% | 20 | 1.92% | 24 | 2.31% | 1 | 0.10% | 402 | 38.69% | 1,039 |
| Burleigh | 22,467 | 65.16% | 9,842 | 28.54% | 1,142 | 3.31% | 875 | 2.54% | 156 | 0.45% | 12,625 | 36.62% | 34,482 |
| Cass | 33,536 | 56.85% | 21,451 | 36.36% | 2,560 | 4.34% | 1,100 | 1.86% | 348 | 0.59% | 12,085 | 20.49% | 58,995 |
| Cavalier | 1,513 | 63.81% | 618 | 26.06% | 73 | 3.08% | 154 | 6.50% | 13 | 0.55% | 895 | 37.75% | 2,371 |
| Dickey | 1,853 | 66.51% | 806 | 28.93% | 52 | 1.87% | 58 | 2.08% | 17 | 0.61% | 1,047 | 37.58% | 2,786 |
| Divide | 443 | 55.79% | 306 | 38.54% | 24 | 3.02% | 15 | 1.89% | 6 | 0.76% | 137 | 17.25% | 794 |
| Dunn | 1,124 | 65.05% | 474 | 27.43% | 54 | 3.13% | 63 | 3.65% | 13 | 0.75% | 650 | 37.62% | 1,728 |
| Eddy | 703 | 55.44% | 458 | 36.12% | 36 | 2.84% | 71 | 5.60% | 0 | 0.00% | 245 | 19.32% | 1,268 |
| Emmons | 1,430 | 71.79% | 405 | 20.33% | 42 | 2.11% | 103 | 5.17% | 12 | 0.60% | 1,025 | 51.46% | 1,992 |
| Foster | 1,172 | 67.24% | 474 | 27.19% | 46 | 2.64% | 40 | 2.29% | 11 | 0.63% | 698 | 40.05% | 1,743 |
| Golden Valley | 611 | 75.25% | 156 | 19.21% | 26 | 3.20% | 17 | 2.09% | 2 | 0.25% | 455 | 56.04% | 812 |
| Grand Forks | 15,875 | 55.93% | 10,593 | 37.32% | 1,367 | 4.82% | 416 | 1.47% | 134 | 0.47% | 5,282 | 18.61% | 28,385 |
| Grant | 1,077 | 75.47% | 235 | 16.47% | 27 | 1.89% | 80 | 5.61% | 8 | 0.56% | 842 | 59.00% | 1,427 |
| Griggs | 920 | 62.63% | 484 | 32.95% | 19 | 1.29% | 43 | 2.93% | 3 | 0.20% | 436 | 29.68% | 1,469 |
| Hettinger | 1,057 | 69.59% | 353 | 23.24% | 44 | 2.90% | 57 | 3.75% | 8 | 0.53% | 704 | 46.35% | 1,519 |
| Kidder | 837 | 65.60% | 283 | 22.18% | 29 | 2.27% | 120 | 9.40% | 7 | 0.55% | 554 | 43.42% | 1,276 |
| LaMoure | 1,590 | 64.42% | 689 | 27.92% | 50 | 2.03% | 125 | 5.06% | 14 | 0.57% | 901 | 36.50% | 2,468 |
| Logan | 812 | 70.92% | 223 | 19.48% | 14 | 1.22% | 87 | 7.60% | 9 | 0.79% | 589 | 51.44% | 1,145 |
| McHenry | 1,682 | 61.45% | 888 | 32.44% | 79 | 2.89% | 68 | 2.48% | 20 | 0.73% | 794 | 29.01% | 2,737 |
| McIntosh | 1,178 | 71.96% | 350 | 21.38% | 36 | 2.20% | 64 | 3.91% | 9 | 0.55% | 828 | 50.58% | 1,637 |
| McKenzie | 1,634 | 69.12% | 653 | 27.62% | 45 | 1.90% | 24 | 1.02% | 8 | 0.34% | 981 | 41.50% | 2,364 |
| McLean | 2,891 | 62.23% | 1,465 | 31.53% | 117 | 2.52% | 154 | 3.31% | 19 | 0.41% | 1,426 | 30.70% | 4,646 |
| Mercer | 2,984 | 68.55% | 1,011 | 23.23% | 157 | 3.61% | 168 | 3.86% | 33 | 0.76% | 1,973 | 45.32% | 4,353 |
| Morton | 6,993 | 62.31% | 3,439 | 30.64% | 341 | 3.04% | 418 | 3.72% | 32 | 0.29% | 3,554 | 31.67% | 11,223 |
| Mountrail | 1,466 | 50.62% | 1,256 | 43.37% | 105 | 3.63% | 58 | 2.00% | 11 | 0.38% | 210 | 7.25% | 2,896 |
| Nelson | 1,031 | 56.03% | 687 | 37.34% | 49 | 2.66% | 63 | 3.42% | 10 | 0.54% | 344 | 18.69% | 1,840 |
| Oliver | 709 | 67.46% | 244 | 23.22% | 36 | 3.43% | 44 | 4.19% | 18 | 1.71% | 465 | 44.24% | 1,051 |
| Pembina | 2,430 | 64.30% | 1,093 | 28.92% | 110 | 2.91% | 134 | 3.55% | 12 | 0.32% | 1,337 | 35.38% | 3,779 |
| Pierce | 1,348 | 68.39% | 500 | 25.37% | 54 | 2.74% | 65 | 3.30% | 4 | 0.20% | 848 | 43.02% | 1,971 |
| Ramsey | 3,005 | 60.38% | 1,658 | 33.31% | 161 | 3.23% | 133 | 2.67% | 20 | 0.40% | 1,347 | 27.07% | 4,977 |
| Ransom | 1,488 | 54.73% | 1,080 | 39.72% | 67 | 2.46% | 75 | 2.76% | 9 | 0.33% | 408 | 15.01% | 2,719 |
| Renville | 820 | 61.56% | 443 | 33.26% | 37 | 2.78% | 26 | 1.95% | 6 | 0.45% | 377 | 28.30% | 1,332 |
| Richland | 4,999 | 62.37% | 2,490 | 31.07% | 240 | 2.99% | 258 | 3.22% | 28 | 0.35% | 2,509 | 31.30% | 8,015 |
| Rolette | 1,416 | 32.20% | 2,681 | 60.96% | 137 | 3.12% | 134 | 3.05% | 30 | 0.68% | -1,265 | -28.76% | 4,398 |
| Sargent | 1,103 | 50.50% | 959 | 43.91% | 48 | 2.20% | 68 | 3.11% | 6 | 0.27% | 144 | 6.59% | 2,184 |
| Sheridan | 707 | 76.19% | 161 | 17.35% | 13 | 1.40% | 41 | 4.42% | 6 | 0.65% | 546 | 58.84% | 928 |
| Sioux | 269 | 25.84% | 724 | 69.55% | 16 | 1.54% | 25 | 2.40% | 7 | 0.67% | -455 | -43.71% | 1,041 |
| Slope | 316 | 71.49% | 85 | 19.23% | 17 | 3.85% | 22 | 4.98% | 2 | 0.45% | 231 | 52.26% | 442 |
| Stark | 6,387 | 65.33% | 2,784 | 28.47% | 301 | 3.08% | 265 | 2.71% | 40 | 0.41% | 3,603 | 36.86% | 9,777 |
| Steele | 655 | 54.13% | 475 | 39.26% | 28 | 2.31% | 49 | 4.05% | 3 | 0.25% | 180 | 14.87% | 1,210 |
| Stutsman | 5,488 | 60.19% | 3,067 | 33.64% | 256 | 2.81% | 270 | 2.96% | 37 | 0.41% | 2,421 | 26.55% | 9,118 |
| Towner | 694 | 58.37% | 410 | 34.48% | 31 | 2.61% | 52 | 4.37% | 2 | 0.17% | 284 | 23.89% | 1,189 |
| Traill | 2,392 | 58.17% | 1,512 | 36.77% | 95 | 2.31% | 92 | 2.24% | 21 | 0.51% | 880 | 21.40% | 4,112 |
| Walsh | 3,099 | 59.80% | 1,743 | 33.64% | 107 | 2.06% | 211 | 4.07% | 22 | 0.42% | 1,356 | 26.16% | 5,182 |
| Ward | 13,997 | 62.26% | 7,533 | 33.51% | 598 | 2.66% | 280 | 1.25% | 74 | 0.33% | 6,464 | 28.75% | 22,482 |
| Wells | 1,610 | 66.80% | 661 | 27.43% | 51 | 2.12% | 78 | 3.24% | 10 | 0.41% | 949 | 39.37% | 2,410 |
| Williams | 5,187 | 66.44% | 2,330 | 29.85% | 157 | 2.01% | 91 | 1.17% | 42 | 0.54% | 2,857 | 36.59% | 7,807 |
| Totals | 174,852 | 60.66% | 95,284 | 33.05% | 9,497 | 3.29% | 7,288 | 2.53% | 1,346 | 0.47% | 79,568 | 27.60% | 288,267 |
Counties that flipped from Democratic to Republican edit
- Benson (Largest CDP: Fort Totten)
- Divide (Largest city: Crosby)
- Eddy (Largest city: New Rockford)
- Name (Largest city: Stanley)
- Nelson (Largest city: Lakota)
- Ramsey (Largest city: Devils Lake)
- Ransom (Largest city: Lisbon)
- Sargent (Largest city: Gwinner)
- Steele (Largest city: Finley)
- Towner (Largest city: Cando)
- Traill (Largest city: Mayville)
By congressional district edit
Due to the state's low population, only one congressional district is allocated. This district is called the At-Large district, because it covers the entire state, and thus is equivalent to the statewide election results.
| District | Bush | Gore | Representative |
|---|---|---|---|
| At-large | 60.7% | 33.1% | Earl Pomeroy |
Electors edit
Technically the voters of North Dakota cast their ballots for electors: representatives to the Electoral College. North Dakota is allocated 3 electors because it has 1 congressional districts and 2 senators. All candidates who appear on the ballot or qualify to receive write-in votes must submit a list of 3 electors, who pledge to vote for their candidate and his or her running mate. Whoever wins the majority of votes in the state is awarded all 3 electoral votes. Their chosen electors then vote for president and vice president. Although electors are pledged to their candidate and running mate, they are not obligated to vote for them. An elector who votes for someone other than his or her candidate is known as a faithless elector.
The electors of each state and the District of Columbia met on December 18, 2000[6] to cast their votes for president and vice president. The Electoral College itself never meets as one body. Instead the electors from each state and the District of Columbia met in their respective capitols.
The following were the members of the Electoral College from the state. All were pledged to and voted for George W. Bush and Dick Cheney:[7]
- Rosemarie Myrdal
- Edward T. Schafer
- Bryce Streibel
See also edit
References edit
- ^ "2000 Presidential Election Statistics". U.S. Election Atlas. David Leip. Retrieved January 10, 2017.
- ^ "Dave Leip's Atlas of U.S. Presidential Elections".
- ^ "2000 Presidential Election Statistics". Dave Leip’s Atlas of U.S. Presidential Elections. Retrieved March 5, 2018.
- ^ "2000 Presidential General Election Results - North Dakota".
- ^ "ND US President Race, November 07, 2000". Our Campaigns.
- ^ "2000 Post-Election Timeline of Events".
- ^ "President Elect - 2000". Archived from the original on February 12, 2012. Retrieved November 8, 2009.