
KNOWPIA
WELCOME TO KNOWPIA

2001 Northamptonshire County Council election 
Summary
The 2001 Northamptonshire County Council election took place on 7 June 2001 to elect members of Northamptonshire County Council, England. The whole council was up for election and the Labour Party retained overall control of the council, which it had held since 1993.[2]
| |||||||||||||||||||||
All 73 seats in the Northamptonshire County Council 37 seats needed for a majority | |||||||||||||||||||||
|---|---|---|---|---|---|---|---|---|---|---|---|---|---|---|---|---|---|---|---|---|---|
| |||||||||||||||||||||
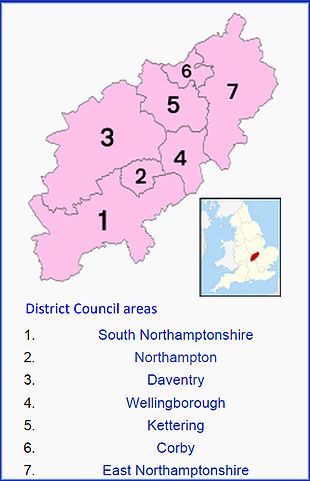
 Map showing the results of the 2001 Northamptonshire County Council elections. | |||||||||||||||||||||
| |||||||||||||||||||||
Division by Division Results by County Borough edit
- In order of number of votes with the winning candidate first
Corby Borough edit
| Party | Candidate | Votes | % | |
|---|---|---|---|---|
| Labour | M. Bullock | 2,446 | 69.3 | |
| Conservative | R. Tustin | 667 | 18.9 | |
| Liberal Democrats | P. McGowan | 418 | 11.8 | |
| Majority | 1,779 | 50.4 | ||
| Turnout | 3,531 | 57.2 | ||
| Party | Candidate | Votes | % | |
|---|---|---|---|---|
| Labour | J.Wade | 2,523 | 56.6 | |
| Conservative | S. Heggs | 1,938 | 43.4 | |
| Majority | 585 | 13.1 | ||
| Turnout | 4,461 | 65.6 | ||
| Party | Candidate | Votes | % | |
|---|---|---|---|---|
| Labour | J. McKellar | 2,090 | 55.6 | |
| Conservative | B. Howard | 937 | 24.9 | |
| Liberal Democrats | C. Stanbra | 730 | 19.4 | |
| Majority | 1,153 | 30.7 | ||
| Turnout | 3,757 | 60.9 | ||
| Party | Candidate | Votes | % | |
|---|---|---|---|---|
| Labour | A. Bell | 2,659 | 72.6 | |
| Conservative | A. Girvin | 1,002 | 27.4 | |
| Majority | 1,657 | 45.3 | ||
| Turnout | 3,661 | 53.7 | ||
| Party | Candidate | Votes | % | |
|---|---|---|---|---|
| Labour | J. Kane | 3,035 | 73.8 | |
| Conservative | G. Ellenton | 1,075 | 26.2 | |
| Majority | 1,960 | 47.7 | ||
| Turnout | 4,110 | 64.4 | ||
| Party | Candidate | Votes | % | |
|---|---|---|---|---|
| Labour | J. Forshaw | 3,139 | 72.5 | |
| Conservative | C. Woolmer | 1,190 | 27.5 | |
| Majority | 1,949 | 45.0 | ||
| Turnout | 4,329 | 60.6 | ||
Daventry District edit
| Party | Candidate | Votes | % | |
|---|---|---|---|---|
| Conservative | E. Williams | 2,829 | 58.7 | |
| Labour | K. Ritchie | 1,994 | 41.3 | |
| Majority | 835 | 17.3 | ||
| Turnout | 4,823 | 66.7 | ||
| Party | Candidate | Votes | % | |
|---|---|---|---|---|
| Conservative | J. Millar | 2,632 | 51.9 | |
| Labour | M. Davenport | 1,223 | 24.1 | |
| Liberal Democrats | M. Nice | 1,216 | 24.0 | |
| Majority | 1,409 | 27.8 | ||
| Turnout | 5,071 | 68.5 | ||
| Party | Candidate | Votes | % | |
|---|---|---|---|---|
| Labour | J. Penrose | 2,005 | 53.7 | |
| Conservative | S. Osborne | 1,731 | 46.3 | |
| Majority | 274 | 7.3 | ||
| Turnout | 3,736 | 53.7 | ||
| Party | Candidate | Votes | % | |
|---|---|---|---|---|
| Labour | O. Loud | 2,355 | 60.8 | |
| Conservative | Annette Dunn | 1,521 | 39.2 | |
| Majority | 834 | 21.5 | ||
| Turnout | 3,876 | 51.6 | ||
| Party | Candidate | Votes | % | |
|---|---|---|---|---|
| Conservative | J. Shephard | 2,310 | 55.0 | |
| Labour | M. Hanly | 1,113 | 26.5 | |
| Labour | B. Luck | 774 | 18.4 | |
| Majority | 1,197 | 28.5 | ||
| Turnout | 4,197 | 69.5 | ||
| Party | Candidate | Votes | % | |
|---|---|---|---|---|
| Conservative | A. Tebbutt | 3,004 | 58.2 | |
| Labour | J. Corkill | 1,313 | 25.4 | |
| Green | J. Hurst | 844 | 16.4 | |
| Majority | 1,691 | 32.8 | ||
| Turnout | 5,161 | 71.2 | ||
| Party | Candidate | Votes | % | |
|---|---|---|---|---|
| Conservative | Gina Ogden | 2,531 | 60.5 | |
| Labour | Malcolm Adcock | 1,650 | 39.5 | |
| Majority | 881 | 21.1 | ||
| Turnout | 4,181 | 62.9 | ||
East Northamptonshire District edit
| Party | Candidate | Votes | % | |
|---|---|---|---|---|
| Conservative | D. Lawson | 2,549 | 55.5 | |
| Labour | A. Dunn | 2,046 | 44.5 | |
| Majority | 503 | 10.9 | ||
| Turnout | 4,595 | 67.3 | ||
| Party | Candidate | Votes | % | |
|---|---|---|---|---|
| Labour | D. Lee | 2,141 | 50.2 | |
| Conservative | S. Hobbs | 2,123 | 49.8 | |
| Majority | 18 | 0.4 | ||
| Turnout | 4,264 | 61.2 | ||
| Party | Candidate | Votes | % | |
|---|---|---|---|---|
| Conservative | C. Reichhold | 2,452 | 51.1 | |
| Labour | J. Brookfield | 1,845 | 38.5 | |
| Independent | J. Smoker | 497 | 10.4 | |
| Majority | 607 | 12.7 | ||
| Turnout | 4,794 | 70.3 | ||
| Party | Candidate | Votes | % | |
|---|---|---|---|---|
| Conservative | P. Padley | 2,920 | 70.3 | |
| Labour | R. Whitehad | 1,233 | 29.7 | |
| Majority | 1,687 | 71.4 | ||
| Turnout | 4,153 | 40.6 | ||
| Party | Candidate | Votes | % | |
|---|---|---|---|---|
| Labour | G. Sharman | 2,011 | 50.9 | |
| Conservative | S. Roberts | 1,937 | 49.1 | |
| Majority | 74 | 1.9 | ||
| Turnout | 3,948 | 61.2 | ||
| Party | Candidate | Votes | % | |
|---|---|---|---|---|
| Labour | L. Cox | 1,703 | 44.0 | |
| Conservative | C. Wood | 1,641 | 42.4 | |
| Liberal Democrats | David Hooton | 529 | 13.7 | |
| Majority | 62 | 1.6 | ||
| Turnout | 3,873 | 56.5 | ||
| Party | Candidate | Votes | % | |
|---|---|---|---|---|
| Conservative | M. Tye | 2,363 | 54.6 | |
| Labour | L. Rolfe | 1,964 | 45.4 | |
| Majority | 399 | 9.2 | ||
| Turnout | 4,327 | 62.7 | ||
| Party | Candidate | Votes | % | |
|---|---|---|---|---|
| Labour | F. Jones | 1,883 | 52.4 | |
| Conservative | R. Pinnock | 1,712 | 47.6 | |
| Majority | 171 | 4.8 | ||
| Turnout | 3,595 | 57.7 | ||
| Party | Candidate | Votes | % | |
|---|---|---|---|---|
| Conservative | B. Seery | 2,529 | 57.1 | |
| Labour | M. Whiteman | 1,578 | 35.6 | |
| UKIP | P. Baden | 322 | 7.3 | |
| Majority | 951 | 21.5 | ||
| Turnout | 4,429 | 67.6 | ||
Kettering Borough edit
| Party | Candidate | Votes | % | |
|---|---|---|---|---|
| Labour | A. Chambers | 1,784 | 44.2 | |
| Conservative | G. Smith | 1,713 | 42.4 | |
| Liberal Democrats | J. Richardson | 540 | 13.4 | |
| Majority | 71 | 1.8 | ||
| Turnout | 4,037 | 69.9 | ||
| Party | Candidate | Votes | % | |
|---|---|---|---|---|
| Conservative | C. Lamb | 1,709 | 38.9 | |
| Labour | A. Gordon | 1,657 | 37.7 | |
| Liberal Democrats | K. Simons | 1,026 | 23.4 | |
| Majority | 52 | 1.2 | ||
| Turnout | 4,392 | 67.0 | ||
| Party | Candidate | Votes | % | |
|---|---|---|---|---|
| Labour | D. Coe | 2,079 | 47.9 | |
| Conservative | B. Glynane | 1,861 | 42.9 | |
| Liberal Democrats | M. Hill | 401 | 9.2 | |
| Majority | 218 | 5.0 | ||
| Turnout | 4,341 | 69.7 | ||
| Party | Candidate | Votes | % | |
|---|---|---|---|---|
| Labour | R. Mayhew | 2,095 | 62.6 | |
| Conservative | K. Marsh | 911 | 27.2 | |
| Liberal Democrats | F. Peacock | 340 | 10.2 | |
| Majority | 1,184 | 35.4 | ||
| Turnout | 3,346 | 58.9 | ||
| Party | Candidate | Votes | % | |
|---|---|---|---|---|
| Conservative | R. Baker | 1,824 | 43.1 | |
| Labour | G. Marshall | 1,806 | 42.7 | |
| Liberal Democrats | V. McGlynn | 604 | 14.3 | |
| Majority | 18 | 0.4 | ||
| Turnout | 4,234 | 67.9 | ||
| Party | Candidate | Votes | % | |
|---|---|---|---|---|
| Labour | I. Watts | 2,153 | 52.9 | |
| Conservative | J. Harker | 1,372 | 33.7 | |
| Liberal Democrats | C. McGlynn | 543 | 13.3 | |
| Majority | 781 | 19.2 | ||
| Turnout | 4,068 | 60.8 | ||
| Party | Candidate | Votes | % | |
|---|---|---|---|---|
| Conservative | J. Harker | 3,015 | 56.6 | |
| Labour | R. Smith | 1,553 | 29.2 | |
| Liberal Democrats | J. Prentice | 755 | 14.2 | |
| Majority | 1,461 | 27.5 | ||
| Turnout | 5,323 | 74.9 | ||
| Party | Candidate | Votes | % | |
|---|---|---|---|---|
| Labour | D. Whyte | 1,996 | 53.9 | |
| Conservative | M. Spendlove | 1,704 | 46.1 | |
| Majority | 292 | 7.9 | ||
| Turnout | 3,700 | 66.8 | ||
| Party | Candidate | Votes | % | |
|---|---|---|---|---|
| Labour | J. West | 2,285 | 55.2 | |
| Conservative | T. Freer | 1,858 | 44.8 | |
| Majority | 427 | 10.3 | ||
| Turnout | 4,143 | 59.9 | ||
| Party | Candidate | Votes | % | |
|---|---|---|---|---|
| Conservative | W. Parker | 1,917 | 40.2 | |
| Labour | J. Connolly | 1,851 | 38.8 | |
| Liberal Democrats | J. Coleman | 1,000 | 21.0 | |
| Majority | 66 | 1.4 | ||
| Turnout | 4,768 | 68.4 | ||
Northampton Borough edit
| Party | Candidate | Votes | % | |
|---|---|---|---|---|
| Labour | M. Boss | 1,780 | 49.7 | |
| Conservative | J. Ashby | 965 | 26.9 | |
| Liberal Democrats | C. Markham | 839 | 23.4 | |
| Majority | 815 | 22.7 | ||
| Turnout | 3,584 | 56.0 | ||
| Party | Candidate | Votes | % | |
|---|---|---|---|---|
| Labour | W. Strachan | 1,500 | 43.6 | |
| Conservative | J. Duncan | 1,377 | 40.0 | |
| Liberal Democrats | L. Felstead | 566 | 16.4 | |
| Majority | 123 | 3.6 | ||
| Turnout | 3,443 | 51.8 | ||
| Party | Candidate | Votes | % | |
|---|---|---|---|---|
| Labour | B. Kirby | 1,661 | 39.2 | |
| Conservative | I. McCann | 1,298 | 30.6 | |
| Liberal Democrats | J. Yates | 1,282 | 30.2 | |
| Majority | 363 | 8.6 | ||
| Turnout | 4,241 | 62.6 | ||
| Party | Candidate | Votes | % | |
|---|---|---|---|---|
| Labour | R. Dickie | 2,023 | 60.8 | |
| Conservative | E. Barham | 677 | 20.3 | |
| Liberal Democrats | G. Bowles | 528 | 15.9 | |
| Independent | P. Harrisson | 100 | 3.0 | |
| Majority | 1,346 | 40.4 | ||
| Turnout | 3,328 | 47.6 | ||
| Party | Candidate | Votes | % | |
|---|---|---|---|---|
| Labour | C. Kalyan | 1,591 | 46.7 | |
| Liberal Democrats | B. Glynane | 923 | 27.1 | |
| Conservative | M. Hill | 893 | 26.2 | |
| Majority | 668 | 19.6 | ||
| Turnout | 3,407 | 55.5 | ||
| Party | Candidate | Votes | % | |
|---|---|---|---|---|
| Labour | M. Thomas | 2,007 | 50.9 | |
| Conservative | L. Percival | 1,205 | 30.6 | |
| Liberal Democrats | B. Dee | 728 | 18.5 | |
| Majority | 802 | 20.4 | ||
| Turnout | 2,855 | 58.4 | ||
| Party | Candidate | Votes | % | |
|---|---|---|---|---|
| Conservative | J. Nunn | 1,789 | 46.7 | |
| Labour | T. Bailey | 1,343 | 35.0 | |
| Liberal Democrats | S. Battison | 700 | 18.3 | |
| Majority | 446 | 11.6 | ||
| Turnout | 3,832 | 57.8 | ||
| Party | Candidate | Votes | % | |
|---|---|---|---|---|
| Labour | P. Concannon | 1,331 | 45.5 | |
| Conservative | J. Lane | 1,124 | 38.4 | |
| Liberal Democrats | R. Baldwin | 641 | 16.0 | |
| Majority | 207 | 7.1 | ||
| Turnout | 2,964 | 54.1 | ||
| Party | Candidate | Votes | % | |
|---|---|---|---|---|
| Labour | V. Dams | 1,562 | 35.9 | |
| Conservative | G. Hawker | 1,440 | 33.1 | |
| Liberal Democrats | S. Hope | 1,349 | 31.0 | |
| Majority | 122 | 2.8 | ||
| Turnout | 4,351 | 66.8 | ||
| Party | Candidate | Votes | % | |
|---|---|---|---|---|
| Labour | J. Dixon | 1,592 | 40.4 | |
| Liberal Democrats | R. Church | 1,517 | 38.5 | |
| Conservative | G. Austin | 829 | 21.1 | |
| Majority | 75 | 1.9 | ||
| Turnout | 3,938 | 55.6 | ||
| Party | Candidate | Votes | % | |
|---|---|---|---|---|
| Liberal Democrats | S. Beardsworth | 1,844 | 45.2 | |
| Labour | F. Wire | 1,397 | 34.2 | |
| Conservative | M. Miah | 840 | 20.6 | |
| Majority | 447 | 11.0 | ||
| Turnout | 4,081 | 59.6 | ||
| Party | Candidate | Votes | % | |
|---|---|---|---|---|
| Labour | M. Young | 1,618 | 55.9 | |
| Conservative | B. Eldred | 782 | 27.0 | |
| Liberal Democrats | M. Taylor | 492 | 17.0 | |
| Majority | 836 | 28.9 | ||
| Turnout | 2,892 | 47.6 | ||
| Party | Candidate | Votes | % | |
|---|---|---|---|---|
| Conservative | C. Lill | 2,208 | 52.5 | |
| Labour | J. Lineker | 1,288 | 30.6 | |
| Liberal Democrats | R. Matthews | 711 | 16.9 | |
| Majority | 920 | 21.9 | ||
| Turnout | 4,207 | 66.3 | ||
| Party | Candidate | Votes | % | |
|---|---|---|---|---|
| Conservative | E. Tavener | 1,958 | 46.6 | |
| Labour | P. Evans | 1,638 | 39.0 | |
| Liberal Democrats | R. Cant | 608 | 14.5 | |
| Majority | 320 | 7.6 | ||
| Turnout | 4,204 | 64.0 | ||
| Party | Candidate | Votes | % | |
|---|---|---|---|---|
| Conservative | D. Edwards | 1,802 | 44.0 | |
| Labour | A. Kingston | 1,756 | 42.9 | |
| Liberal Democrats | C. Squires | 536 | 13.1 | |
| Majority | 46 | 1.1 | ||
| Turnout | 4,094 | 63.6 | ||
| Party | Candidate | Votes | % | |
|---|---|---|---|---|
| Conservative | W. Massey | 1,733 | 41.4 | |
| Labour | F. Lilley | 1,685 | 40.3 | |
| Liberal Democrats | I. Wright | 767 | 18.3 | |
| Majority | 48 | 1.1 | ||
| Turnout | 4,185 | 66.9 | ||
| Party | Candidate | Votes | % | |
|---|---|---|---|---|
| Labour | J. Bains | 1,696 | 59.4 | |
| Conservative | B. Wright | 694 | 24.3 | |
| Liberal Democrats | I. Markham | 465 | 16.3 | |
| Majority | 1,002 | 35.1 | ||
| Turnout | 2,855 | 47.4 | ||
| Party | Candidate | Votes | % | |
|---|---|---|---|---|
| Labour | A. McCutcheon | 1,545 | 51.0 | |
| Conservative | D. Clark | 864 | 28.5 | |
| Liberal Democrats | M. Hoare | 535 | 17.7 | |
| Independent | T. Harvey | 83 | 2.7 | |
| Majority | 681 | 22.5 | ||
| Turnout | 3,007 | 47.9 | ||
| Party | Candidate | Votes | % | |
|---|---|---|---|---|
| Labour | J. Gardner | 1,530 | 47.0 | |
| Liberal Democrats | N. Felstead | 967 | 29.7 | |
| Conservative | J. Cartwright | 757 | 23.3 | |
| Majority | 563 | 17.3 | ||
| Turnout | 3,254 | 48.1 | ||
| Party | Candidate | Votes | % | |
|---|---|---|---|---|
| Labour | T. Wire | 1,805 | 52.0 | |
| Conservative | A. Wright | 1,157 | 33.4 | |
| Liberal Democrats | M. Minney | 506 | 14.6 | |
| Majority | 648 | 18.7 | ||
| Turnout | 3,468 | 54.2 | ||
| Party | Candidate | Votes | % | |
|---|---|---|---|---|
| Labour | L. Patterson | 1,550 | 55.0 | |
| Conservative | J. Cartwright | 858 | 30.5 | |
| Liberal Democrats | M. Taylor | 408 | 14.5 | |
| Majority | 692 | 24.6 | ||
| Turnout | 2,816 | 49.9 | ||
| Party | Candidate | Votes | % | |
|---|---|---|---|---|
| Conservative | C. Hugheston-Roberts | 1,367 | 39.7 | |
| Liberal Democrats | J. Hope | 1,044 | 30.3 | |
| Labour | U. Gravesande | 886 | 25.7 | |
| UKIP | D. Clark | 146 | 4.2 | |
| Majority | 323 | 9.4 | ||
| Turnout | 3,443 | 62.0 | ||
| Party | Candidate | Votes | % | |
|---|---|---|---|---|
| Conservative | M. Hill | 2,437 | 51.4 | |
| Labour | M. Cleaves | 1,485 | 31.3 | |
| Liberal Democrats | J. Cramp | 815 | 17.2 | |
| Majority | 952 | 20.1 | ||
| Turnout | 4,737 | 68.9 | ||
South Northamptonshire District edit
| Party | Candidate | Votes | % | |
|---|---|---|---|---|
| Conservative | J. Shepherd-Cross | 2,578 | 56.4 | |
| Labour | P. Sceeny | 1,994 | 43.6 | |
| Majority | 584 | 12.8 | ||
| Turnout | 4,572 | 61.0 | ||
| Party | Candidate | Votes | % | |
|---|---|---|---|---|
| Conservative | R. Sawbridge | 2,056 | 50.4 | |
| Liberal Democrats | I. Franklin | 1,094 | 26.8 | |
| Labour | G. Youens | 931 | 22.8 | |
| Majority | 962 | 23.6 | ||
| Turnout | 4,081 | 66.1 | ||
| Party | Candidate | Votes | % | |
|---|---|---|---|---|
| Conservative | J. Kirkbride | 2,680 | 59.4 | |
| Labour | R. Johnson | 944 | 20.9 | |
| Liberal Democrats | S. Pace | 887 | 19.7 | |
| Majority | 1,736 | 38.5 | ||
| Turnout | 4,511 | 70.8 | ||
| Party | Candidate | Votes | % | |
|---|---|---|---|---|
| Conservative | A. Walker | 2,526 | 57.2 | |
| Labour | V. Whitaker | 1,892 | 42.8 | |
| Majority | 634 | 14.4 | ||
| Turnout | 4,418 | 69.1 | ||
| Party | Candidate | Votes | % | |
|---|---|---|---|---|
| Conservative | B. Smith | 3,301 | 67.6 | |
| Labour | D. Wardle | 1,582 | 32.4 | |
| Majority | 1,719 | 35.2 | ||
| Turnout | 4,883 | 70.9 | ||
| Party | Candidate | Votes | % | |
|---|---|---|---|---|
| Conservative | B. Binley | 2,811 | 61.0 | |
| Labour | R. Foot | 1,171 | 25.4 | |
| Liberal Democrats | A. Simpson | 627 | 13.6 | |
| Majority | 1,640 | 35.6 | ||
| Turnout | 4,609 | 71.3 | ||
| Party | Candidate | Votes | % | |
|---|---|---|---|---|
| Conservative | M. Mildren | 2,771 | 57.5 | |
| Labour | C. Fitchett | 2,046 | 42.5 | |
| Majority | 725 | 15.1 | ||
| Turnout | 4,871 | 66.0 | ||
| Party | Candidate | Votes | % | |
|---|---|---|---|---|
| Conservative | D. Batten | 2,075 | 51.7 | |
| Labour | W. Toone | 1,245 | 31.0 | |
| Liberal Democrats | S. O'Connor | 693 | 17.3 | |
| Majority | 830 | 20.7 | ||
| Turnout | 4,043 | 70.2 | ||
| Party | Candidate | Votes | % | |
|---|---|---|---|---|
| Conservative | R. Bromwich | 2,018 | 49.4 | |
| Liberal Democrats | J. Calder | 1,048 | 25.6 | |
| Labour | H. Kerr | 1,022 | 25.0 | |
| Majority | 970 | 23.7 | ||
| Turnout | 4,088 | 64.6 | ||
Wellingborough Borough edit
| Party | Candidate | Votes | % | |
|---|---|---|---|---|
| Labour | A. Simon | 2,282 | 50.5 | |
| Conservative | C. Benham | 1,624 | 35.9 | |
| Liberal Democrats | P. Gaskell | 613 | 13.6 | |
| Majority | 658 | 14.6 | ||
| Turnout | 4,519 | 58.4 | ||
| Party | Candidate | Votes | % | |
|---|---|---|---|---|
| Labour | G. Blackwell | 2,900 | 56.0 | |
| Conservative | P. Bell | 2,275 | 44.0 | |
| Majority | 625 | 12.1 | ||
| Turnout | 5,175 | 72.6 | ||
| Party | Candidate | Votes | % | |
|---|---|---|---|---|
| Conservative | J. Bailey | 2,809 | 56.6 | |
| Labour | L. Warner | 1,504 | 30.3 | |
| Liberal Democrats | W. Urmson | 651 | 13.1 | |
| Majority | 1,305 | 26.3 | ||
| Turnout | 4,964 | 71.4 | ||
| Party | Candidate | Votes | % | |
|---|---|---|---|---|
| Labour | J. Ashton | 2,274 | 54.6 | |
| Conservative | Y. Miles | 1,892 | 45.4 | |
| Majority | 382 | 9.2 | ||
| Turnout | 4,166 | 64.1 | ||
| Party | Candidate | Votes | % | |
|---|---|---|---|---|
| Labour | T. Maguire | 1,989 | 44.6 | |
| Conservative | J. Saxby | 1,922 | 43.1 | |
| Liberal Democrats | K. Clements | 550 | 12.3 | |
| Majority | 57 | 1.5 | ||
| Turnout | 4,461 | 71.2 | ||
| Party | Candidate | Votes | % | |
|---|---|---|---|---|
| Labour | P. Jones | 2,115 | 56.6 | |
| Conservative | V. Ager | 1,230 | 32.9 | |
| Liberal Democrats | P. Thornborow | 395 | 10.6 | |
| Majority | 885 | 23.7 | ||
| Turnout | 3,740 | 58.3 | ||
| Party | Candidate | Votes | % | |
|---|---|---|---|---|
| Conservative | M. Waters | 2,036 | 48.5 | |
| Labour | J. Robinson | 1,488 | 35.4 | |
| Liberal Democrats | P. Wilkins | 674 | 16.1 | |
| Majority | 548 | 13.1 | ||
| Turnout | 4,198 | 69.0 | ||
| Party | Candidate | Votes | % | |
|---|---|---|---|---|
| Labour | P. Cass | 2,220 | 53.4 | |
| Conservative | J. Read | 1,935 | 46.6 | |
| Majority | 285 | 6.9 | ||
| Turnout | 4,155 | 64.8 | ||
References edit