
KNOWPIA
WELCOME TO KNOWPIA

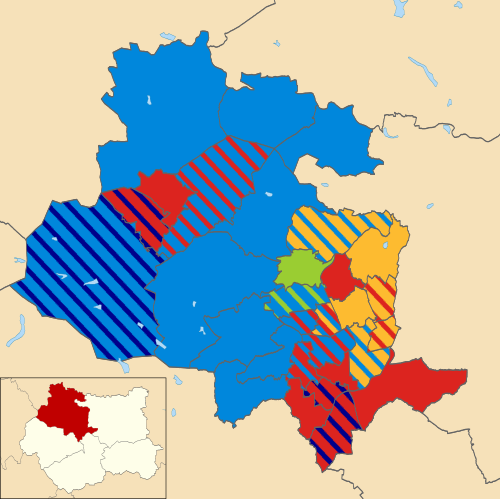
2004 City of Bradford Metropolitan District Council election 
Summary
Elections to City of Bradford Metropolitan District Council were held on 10 June 2004. The whole council was up for election following boundary changes. The council stayed under no overall control.[1][2]
Election result edit
| Party | Seats | Gains | Losses | Net gain/loss | Seats % | Votes % | Votes | +/− | |
|---|---|---|---|---|---|---|---|---|---|
| Conservative | 38 | 0 | 0 | 42.2 | 31.7 | 54,339 | N/A | ||
| Labour | 29 | 0 | 0 | 32.2 | 26.9 | 46,135 | N/A | ||
| Liberal Democrats | 15 | 0 | 0 | 16.7 | 23.3 | 40,012 | N/A | ||
| Green | 4 | 0 | 0 | 4.4 | 7.1 | 12,250 | N/A | ||
| BNP | 4 | 0 | 0 | 4.4 | 7.0 | 12,079 | N/A | ||
| Independent | 0 | 0 | 0 | 0.0 | 3.0 | 5,170 | N/A | ||
| UKIP | 0 | 0 | 0 | 0.0 | 0.9 | 1,487 | N/A | ||
This result had the following consequences for the total number of seats on the council after the elections:
| Party | Previous council | New council | |||
|---|---|---|---|---|---|
| Conservative | 36 | 38 | |||
| Labour | 36 | 29 | |||
| Liberal Democrat | 14 | 15 | |||
| Green | 3 | 4 | |||
| BNP | 4 | 4 | |||
| Independent | 1 | 0 | |||
| Total | 90 | 90 | |||
| Working majority | -18 | -14 | |||
Ward results edit
| Party | Candidate | Votes | % | ±% | |
|---|---|---|---|---|---|
| Liberal Democrats | John Malcolm Charles Cole | 2,948 | 44.7 | N/A | |
| Liberal Democrats | John Briggs | 2,482 | |||
| Conservative | Valerie Margaret Townend | 2,343 | 35.5 | N/A | |
| Liberal Democrats | Christine Betty Briggs | 2,314 | |||
| Conservative | Roger L'Amie | 2,178 | |||
| Conservative | Michael George Ellis | 1,908 | |||
| Labour | Miranda Elizabeth Vasey | 751 | 11.4 | N/A | |
| Labour | James Robert Flood | 676 | |||
| Green | John Patrick William Foster | 549 | 8.3 | N/A | |
| Labour | George Pope | 539 | |||
| Majority | 29 | 9.2 | N/A | ||
| Turnout | 6,115 | 52.8 | N/A | ||
| Liberal Democrats win (new seat) | |||||
| Liberal Democrats win (new seat) | |||||
| Conservative win (new seat) | |||||
| Party | Candidate | Votes | % | ±% | |
|---|---|---|---|---|---|
| Conservative | Colin Mathew Gill | 3,229 | 46.5 | N/A | |
| Conservative | Robin Ernest Owens | 2,962 | |||
| Conservative | David Heseltine | 2,941 | |||
| Labour | Eileen Mary Sinclair | 1,551 | 22.4 | N/A | |
| Labour | Frank Roy Needham | 1,529 | |||
| Labour | Michael Swales | 1,385 | |||
| Liberal Democrats | John Robert Watmough | 1,211 | 17.4 | N/A | |
| Green | Arthur Albert John Arnold | 947 | 13.6 | N/A | |
| Liberal Democrats | Susan Valerie Whelan | 759 | |||
| Liberal Democrats | David Nicholas Lerner | 642 | |||
| Majority | 1,390 | 24.2 | N/A | ||
| Turnout | 6,371 | 51.5 | N/A | ||
| Conservative win (new seat) | |||||
| Conservative win (new seat) | |||||
| Conservative win (new seat) | |||||
| Party | Candidate | Votes | % | ±% | |
|---|---|---|---|---|---|
| Conservative | Ellen Margaret Eaton | 3,526 | 54.1 | N/A | |
| Conservative | Andrew Simon Cooke | 3,199 | |||
| Conservative | Juliette Margaret Kinsey | 3,081 | |||
| Labour | James Albert Newton | 1,139 | 17.5 | N/A | |
| Labour | Lawrence William Cooper | 1,089 | |||
| Liberal Democrats | Laura Jane Cole | 1,019 | 15.6 | N/A | |
| Liberal Democrats | Margaret Helen Fielden | 936 | |||
| Green | Brian Newham | 829 | 12.7 | N/A | |
| Liberal Democrats | Karl Spracklen | 784 | |||
| Labour | Ranjit Kaur Arora | 707 | |||
| Majority | 1,942 | 36.6 | N/A | ||
| Turnout | 6,155 | 47.7 | N/A | ||
| Conservative win (new seat) | |||||
| Conservative win (new seat) | |||||
| Conservative win (new seat) | |||||
| Party | Candidate | Votes | % | ±% | |
|---|---|---|---|---|---|
| Liberal Democrats | Robert Christopher Hargreaves | 2,326 | 51.2 | N/A | |
| Liberal Democrats | Howard Middleton | 2,247 | |||
| Liberal Democrats | David Weston Gray | 2,244 | |||
| Conservative | Richard Brodowski | 881 | 19.4 | N/A | |
| Labour | Rita Maria Goulden | 867 | 19.1 | N/A | |
| Conservative | Peter Benson | 772 | |||
| Labour | Jagtar Singh Deol | 766 | |||
| Conservative | John Antony Robertshaw | 699 | |||
| Labour | Mohammad Yaqoob | 675 | |||
| Green | Steven Schofield | 472 | 10.4 | N/A | |
| Majority | 1,363 | 31.8 | N/A | ||
| Turnout | 4,656 | 42.3 | N/A | ||
| Liberal Democrats win (new seat) | |||||
| Liberal Democrats win (new seat) | |||||
| Liberal Democrats win (new seat) | |||||
| Party | Candidate | Votes | % | ±% | |
|---|---|---|---|---|---|
| Liberal Democrats | Rupert Oliver | 2,448 | 44.6 | N/A | |
| Conservative | Mohammed Jamil | 1,827 | 33.3 | N/A | |
| Liberal Democrats | Mukhtar Ali | 1,810 | |||
| Liberal Democrats | Ghulam Rabani Chaudhury | 1,770 | |||
| Conservative | Zameer Hussain Shah | 1,679 | |||
| Conservative | Dawood Ismail Karim | 1,545 | |||
| Labour | Raymond Bage | 1,212 | 22.1 | N/A | |
| Labour | Anthony Niland | 1,196 | |||
| Labour | Shofiqul Islam | 977 | |||
| Majority | 131 | 11.3 | N/A | ||
| Turnout | 5,759 | 49.0 | N/A | ||
| Liberal Democrats win (new seat) | |||||
| Conservative win (new seat) | |||||
| Liberal Democrats win (new seat) | |||||
| Party | Candidate | Votes | % | ±% | |
|---|---|---|---|---|---|
| Liberal Democrats | Riaz Ahmed | 2,508 | 40.0 | N/A | |
| Labour | Ghazanfer Khaliq | 2,396 | 38.2 | N/A | |
| Liberal Democrats | Diloar J Ali | 2,091 | |||
| Labour | Shakeela Jan Lal | 1,887 | |||
| Liberal Democrats | Abdul Aziz | 1,519 | |||
| Labour | Taj Mubarik Salam | 1,472 | |||
| Conservative | Habib-Ur Rehman | 1,373 | 21.9 | N/A | |
| Conservative | Mohammed Aslam Choudary | 1,362 | |||
| Conservative | Shafiquddin Chohan | 1,040 | |||
| Majority | 204 | 1.8 | N/A | ||
| Turnout | 6,150 | 55.7 | N/A | ||
| Liberal Democrats win (new seat) | |||||
| Labour win (new seat) | |||||
| Liberal Democrats win (new seat) | |||||
| Party | Candidate | Votes | % | ±% | |
|---|---|---|---|---|---|
| Labour | Sajawal Hussain | 2,501 | 35.7 | N/A | |
| Conservative | Jamshed Khan | 2,141 | 30.6 | N/A | |
| Conservative | Khadam Hussain | 1,930 | |||
| Labour | Munir Ahmed | 1,704 | |||
| Liberal Democrats | Arshad Mansoor Haider Raja | 1,546 | 22.1 | N/A | |
| Liberal Democrats | Sharaz Akhtar | 1,529 | |||
| Labour | Evelyne Godfrey | 1,439 | |||
| Green | John Edward Robinson | 810 | 11.6 | N/A | |
| Conservative | Joyce Audrey Green | 622 | |||
| Majority | 226 | 5.1 | N/A | ||
| Turnout | 6,203 | 57.1 | N/A | ||
| Labour win (new seat) | |||||
| Conservative win (new seat) | |||||
| Conservative win (new seat) | |||||
| Party | Candidate | Votes | % | ±% | |
|---|---|---|---|---|---|
| Conservative | Elaine Byrom | 2,039 | 37.5 | N/A | |
| Conservative | Charles Malcolm Sykes | 1,572 | |||
| Conservative | David John Servant | 1,509 | |||
| Liberal Democrats | Lorna Mary Ruth Leeming | 1,230 | 22.6 | N/A | |
| Labour | Mohammed Latif Darr | 1,124 | 20.6 | N/A | |
| BNP | Stuart George Kilminster | 1,049 | 19.3 | N/A | |
| Labour | Mohammed Abdus Salam | 979 | |||
| Labour | Mohammed Shafiq | 879 | |||
| Liberal Democrats | James Emile Mangeolles | 780 | |||
| Majority | 279 | 14.9 | N/A | ||
| Turnout | 4,773 | 43.6 | N/A | ||
| Conservative win (new seat) | |||||
| Conservative win (new seat) | |||||
| Conservative win (new seat) | |||||
| Party | Candidate | Votes | % | ±% | |
|---|---|---|---|---|---|
| Conservative | David Robert Emmott | 3,014 | 43.6 | N/A | |
| Conservative | Michael John Kelly | 2,726 | |||
| Conservative | Andrew Charles Mallinson | 2,646 | |||
| Independent | Christopher Micheal Atkinson | 1,408 | 20.4 | N/A | |
| Labour | Francis Melvyn Harrison | 1,281 | 18.5 | N/A | |
| Liberal Democrats | Elizabeth Wells | 1,207 | 17.5 | N/A | |
| Labour | Lorraine Margaret Harding | 1,200 | |||
| Liberal Democrats | Hamish Gordon Hay | 1,198 | |||
| Labour | Garrath Julian Earnshaw | 848 | |||
| Liberal Democrats | Gordon Tarek Ahmadi | 563 | |||
| Majority | 1,238 | 23.2 | N/A | ||
| Turnout | 6,152 | 50.3 | N/A | ||
| Conservative win (new seat) | |||||
| Conservative win (new seat) | |||||
| Conservative win (new seat) | |||||
| Party | Candidate | Votes | % | ±% | |
|---|---|---|---|---|---|
| Liberal Democrats | Dorothy Ann Wallace | 1,359 | 32.5 | N/A | |
| Liberal Democrats | Carol Beardmore | 1,352 | |||
| Labour | Anne-Marie Benson | 1,237 | 29.6 | N/A | |
| Labour | Robert Sowman | 1,223 | |||
| Liberal Democrats | Alun Owen Griffiths | 1,206 | |||
| Labour | James O'Neill | 1,161 | |||
| Conservative | James Ralph Ryder | 1,088 | 26.0 | N/A | |
| Conservative | Harry Lycett | 1,036 | |||
| Conservative | Dorothy Ward | 1,006 | |||
| Green | Joan Audrey Foulds | 498 | 11.9 | N/A | |
| Majority | 31 | 2.9 | N/A | ||
| Turnout | 4,347 | 38.1 | N/A | ||
| Liberal Democrats win (new seat) | |||||
| Liberal Democrats win (new seat) | |||||
| Labour win (new seat) | |||||
| Party | Candidate | Votes | % | ±% | |
|---|---|---|---|---|---|
| Labour | Paul John Flowers | 2,089 | 37.2 | N/A | |
| Conservative | Intkhab Alam | 1,640 | 29.2 | N/A | |
| Labour | John Derek Godward | 1,617 | |||
| Labour | Elizabeth Mary Devlin | 1,341 | |||
| Liberal Democrats | Mansha Maqsood | 1,251 | 22.3 | N/A | |
| Conservative | Richard Milczanowski | 1,228 | |||
| Liberal Democrats | Margaret Isabel Chadwick | 1,028 | |||
| Liberal Democrats | John Robert Saul | 994 | |||
| Conservative | Mohammed Sadiq | 755 | |||
| Green | Derek Curtis | 641 | 11.4 | N/A | |
| Majority | 366 | 8.0 | N/A | ||
| Turnout | 5,409 | 49.3 | N/A | ||
| Labour win (new seat) | |||||
| Conservative win (new seat) | |||||
| Labour win (new seat) | |||||
| Party | Candidate | Votes | % | ±% | |
|---|---|---|---|---|---|
| Conservative | John Stanley King | 1,816 | 29.8 | N/A | |
| Green | David Michael Ford | 1,531 | 25.1 | N/A | |
| Conservative | Mohammad Masood | 1,355 | |||
| Labour | Andrew Craig Pitts | 1,280 | 21.0 | N/A | |
| Conservative | Paul Trevor Smith | 1,251 | |||
| Liberal Democrats | Tariq Mahmood | 1,127 | 18.5 | N/A | |
| Green | Parvez Darr | 1,119 | |||
| Labour | Mark Fielding | 1,069 | |||
| Labour | Gillian Margaret Thornton | 943 | |||
| Green | Mohammed Hanif Qureshi | 892 | |||
| Liberal Democrats | Farhan Hussain Khokhar | 631 | |||
| Liberal Democrats | Ansar Ali Mirza | 591 | |||
| Independent | Alan Hugh Carling | 342 | 5.6 | N/A | |
| Majority | 285 | 4.7 | N/A | ||
| Turnout | 5,357 | 54.4 | N/A | ||
| Conservative win (new seat) | |||||
| Green win (new seat) | |||||
| Conservative win (new seat) | |||||
| Party | Candidate | Votes | % | ±% | |
|---|---|---|---|---|---|
| Liberal Democrats | Ann Lesley Ozolins | 2,581 | 46.2 | N/A | |
| Liberal Democrats | Jeanette Sunderland | 2,525 | |||
| Liberal Democrats | David Ward | 2,384 | |||
| Conservative | Anthony James Nigel Wood | 1,042 | 18.6 | N/A | |
| Conservative | Joan Marie Small | 958 | |||
| Conservative | Edward Christopher Ward | 954 | |||
| BNP | Stewart Paul Williams | 877 | 15.7 | N/A | |
| Labour | Anthony Devaney | 636 | 11.4 | N/A | |
| Labour | Helen Josephine Difiori | 610 | |||
| Labour | Folayemi Olaniyi Adisa-Adesina | 456 | |||
| Green | Judith Wever | 454 | 8.1 | N/A | |
| Majority | 1,342 | 27.5 | N/A | ||
| Turnout | 5,303 | 46.6 | N/A | ||
| Liberal Democrats win (new seat) | |||||
| Liberal Democrats win (new seat) | |||||
| Liberal Democrats win (new seat) | |||||
| Party | Candidate | Votes | % | ±% | |
|---|---|---|---|---|---|
| Conservative | Anne Gillian Hawkesworth | 3,775 | 60.6 | N/A | |
| Conservative | Brian Martin Smith | 3,359 | |||
| Conservative | Colin George Powell | 3,290 | |||
| Liberal Democrats | Richard William Quayle | 1,302 | 20.9 | N/A | |
| Liberal Democrats | Samuel Edwin Harris | 1,230 | |||
| Labour | Christopher James Ramage | 1,153 | 18.5 | N/A | |
| Liberal Democrats | Tomasz John Pierscionek | 1,080 | |||
| Labour | Peter Cheney | 1,075 | |||
| Labour | James William Pressley | 938 | |||
| Majority | 1,988 | 39.7 | N/A | ||
| Turnout | 6,140 | 55.7 | N/A | ||
| Conservative win (new seat) | |||||
| Conservative win (new seat) | |||||
| Conservative win (new seat) | |||||
| Party | Candidate | Votes | % | ±% | |
|---|---|---|---|---|---|
| Labour | Khadim Hussain | 2,626 | 45.9 | N/A | |
| Labour | Lynne Joyce | 2,231 | |||
| Labour | John Morris Prestage | 1,850 | |||
| Conservative | Javaid Akhtar | 1,584 | 27.7 | N/A | |
| Liberal Democrats | Christopher John Campbell Brown | 1,512 | 26.4 | N/A | |
| Liberal Democrats | Kaneez Akthar | 1,417 | |||
| Conservative | Arshed Majeed | 1,397 | |||
| Conservative | Amran Ali | 1,255 | |||
| Liberal Democrats | Javed Bashir | 1,086 | |||
| Majority | 266 | 18.2 | N/A | ||
| Turnout | 6,018 | 55.9 | N/A | ||
| Labour win (new seat) | |||||
| Labour win (new seat) | |||||
| Labour win (new seat) | |||||
| Party | Candidate | Votes | % | ±% | |
|---|---|---|---|---|---|
| Labour | Malcolm Slater | 2,037 | 30.1 | N/A | |
| Conservative | Dorothy Clamp | 1,687 | 24.9 | N/A | |
| Conservative | Mark Francis Startin | 1,632 | |||
| Labour | Maxine Anne Hepworth | 1,464 | |||
| BNP | Victor William Collier | 1,407 | 20.8 | N/A | |
| Conservative | John Anthony Carroll | 1,368 | |||
| Labour | Andrew Peter Alan Dundas | 1,243 | |||
| Liberal Democrats | Judith Brooksbank | 1,002 | 14.8 | N/A | |
| Green | John Francis Love | 634 | 9.4 | N/A | |
| Liberal Democrats | Ali Akbar | 628 | |||
| Liberal Democrats | James Stewart Main | 550 | |||
| Majority | 168 | 5.2 | N/A | ||
| Turnout | 5,662 | 50.4 | N/A | ||
| Labour win (new seat) | |||||
| Conservative win (new seat) | |||||
| Conservative win (new seat) | |||||
| Party | Candidate | Votes | % | ±% | |
|---|---|---|---|---|---|
| BNP | Angela Clarke | 1,659 | 29.1 | N/A | |
| Labour | Irene Ellison-Wood | 1,417 | 24.8 | N/A | |
| Labour | Catherine Mary Rowen | 1,354 | |||
| Conservative | John Rennie Philip | 1,142 | 20.0 | N/A | |
| Conservative | Lucy Wilkinson | 1,108 | |||
| Labour | Eileen McNally | 1,073 | |||
| Independent | Brian Hudson | 903 | 15.8 | N/A | |
| Conservative | David John Herdson | 895 | |||
| Independent | Anthony Wright | 584 | |||
| Liberal Democrats | Douglas Roger Beaumont | 582 | 10.2 | N/A | |
| Liberal Democrats | James Francis Keeley | 399 | |||
| Liberal Democrats | Barbara Pierscionek | 345 | |||
| Majority | 212 | 4.2 | N/A | ||
| Turnout | 5,009 | 45.6 | N/A | ||
| BNP win (new seat) | |||||
| Labour win (new seat) | |||||
| Labour win (new seat) | |||||
| Party | Candidate | Votes | % | ±% | |
|---|---|---|---|---|---|
| Labour | Ian Greenwood | 2,436 | 51.4 | N/A | |
| Labour | Sher Khan | 2,415 | |||
| Labour | Naveeda Ikram | 2,129 | |||
| Conservative | Asad Mercury Malik | 922 | 19.4 | N/A | |
| Liberal Democrats | John Brian Massen | 785 | 16.6 | N/A | |
| Liberal Democrats | Rahmat Ullah | 770 | |||
| Conservative | Zubeda Begum | 762 | |||
| Green | John Charles McKenny | 598 | 12.6 | N/A | |
| Liberal Democrats | Tahir Mahmood | 588 | |||
| Conservative | Mohammed Afzal | 488 | |||
| Majority | 1,207 | 31.9 | N/A | ||
| Turnout | 5,094 | 50.1 | N/A | ||
| Labour win (new seat) | |||||
| Labour win (new seat) | |||||
| Labour win (new seat) | |||||
| Party | Candidate | Votes | % | ±% | |
|---|---|---|---|---|---|
| Liberal Democrats | Mohammed Ishrat Mirza | 2,415 | 38.2 | N/A | |
| Labour | Choudhary Rangzeb | 2,104 | 33.2 | N/A | |
| Conservative | Reis Khan | 1,810 | 28.6 | N/A | |
| Conservative | Raza Ghalib Hussain | 1,731 | |||
| Labour | Susanne Rooney | 1,700 | |||
| Labour | Shabir Hussain | 1,637 | |||
| Liberal Democrats | Mohammed Rafiq Sehgal | 1,596 | |||
| Conservative | Mohammed Ashraf Miah | 1,198 | |||
| Liberal Democrats | Mohammed Shafiq-Ul Islam | 1,150 | |||
| Majority | 79 | 4.9 | N/A | ||
| Turnout | 6,922 | 66.5 | N/A | ||
| Liberal Democrats win (new seat) | |||||
| Labour win (new seat) | |||||
| Conservative win (new seat) | |||||
| Party | Candidate | Votes | % | ±% | |
|---|---|---|---|---|---|
| Conservative | Michael Walls | 1,827 | 31.3 | N/A | |
| Conservative | Stuart Hanson | 1,823 | |||
| Conservative | Tracey McNulty | 1,648 | |||
| BNP | Paul Gregory Smith Cromie | 1,411 | 24.2 | N/A | |
| BNP | Lynda Jane Cromie | 1,259 | |||
| Labour | David Warburton | 1,140 | 19.6 | N/A | |
| Labour | Alan Frederick Wainwright | 1,051 | |||
| Labour | Graham Vincent Mahony | 1,036 | |||
| Independent | Andrew Stephen Smith | 992 | 17.0 | N/A | |
| Liberal Democrats | Helen Wright | 458 | 7.9 | N/A | |
| Liberal Democrats | Cedric Wilson | 430 | |||
| Majority | 237 | 7.1 | N/A | ||
| Turnout | 5,085 | 47.9 | N/A | ||
| Conservative win (new seat) | |||||
| Conservative win (new seat) | |||||
| Conservative win (new seat) | |||||
| Party | Candidate | Votes | % | ±% | |
|---|---|---|---|---|---|
| Labour | Andrew Thornton | 1,795 | 39.1 | N/A | |
| Labour | Judith Mary Black | 1,784 | |||
| Labour | Valerie Slater | 1,608 | |||
| BNP | David Roy Midgley | 1,258 | 27.4 | N/A | |
| Conservative | Robert James Stead | 1,038 | 22.6 | N/A | |
| Conservative | Margaret Christine Jordan | 965 | |||
| Conservative | Jacqueline Lesley Walls | 876 | |||
| Liberal Democrats | Edward John Hallmann | 498 | 10.8 | N/A | |
| Liberal Democrats | Colleen Middleton | 496 | |||
| Majority | 350 | 11.7 | N/A | ||
| Turnout | 4,401 | 40.5 | N/A | ||
| Labour win (new seat) | |||||
| Labour win (new seat) | |||||
| Labour win (new seat) | |||||
| Party | Candidate | Votes | % | ±% | |
|---|---|---|---|---|---|
| Green | Martin John Love | 2,497 | 41.9 | N/A | |
| Green | Kevin Robert Warnes | 2,010 | |||
| Green | Hawarun Nessa Hussain | 1,801 | |||
| Conservative | Geraldine Whelan | 1,585 | 26.6 | N/A | |
| Conservative | Keith Jepson | 1,504 | |||
| Conservative | Andrew Tuppen | 1,355 | |||
| Labour | Mark Richard Blackburn | 1,112 | 18.6 | N/A | |
| Labour | Gareth David Logan | 926 | |||
| Labour | Barry Kenneth Thorne | 911 | |||
| Liberal Democrats | Alexander John Cole | 771 | 12.9 | N/A | |
| Liberal Democrats | Joan McCree Edbury | 629 | |||
| Liberal Democrats | Carl John Dickerson | 561 | |||
| Majority | 216 | 15.3 | N/A | ||
| Turnout | 5,532 | 52.2 | N/A | ||
| Green win (new seat) | |||||
| Green win (new seat) | |||||
| Green win (new seat) | |||||
| Party | Candidate | Votes | % | ±% | |
|---|---|---|---|---|---|
| Conservative | Clive Thomas Richardson | 1,993 | 32.0 | N/A | |
| Conservative | Michael Evan McCabe | 1,851 | |||
| Conservative | Valerie Binney | 1,770 | |||
| UKIP | Melanie Jane Milnes | 1,487 | 23.9 | N/A | |
| Labour | John Jevon Samuel | 1,047 | 16.8 | N/A | |
| Liberal Democrats | Susan Elizabeth Fletcher | 874 | 14.0 | N/A | |
| Green | Michael Anthony Rawnsley | 832 | 13.3 | N/A | |
| Liberal Democrats | David George Weston | 819 | |||
| Labour | Aurang Zeb Khan | 545 | |||
| Labour | Hassan Uzzaman Khan | 527 | |||
| Majority | 283 | 8.1 | N/A | ||
| Turnout | 4,903 | 44.1 | N/A | ||
| Conservative win (new seat) | |||||
| Conservative win (new seat) | |||||
| Conservative win (new seat) | |||||
| Party | Candidate | Votes | % | ±% | |
|---|---|---|---|---|---|
| Conservative | Arshad Hussain | 2,926 | 40.9 | N/A | |
| Labour | Amir Hussain | 2,825 | 39.5 | N/A | |
| Conservative | Amjad Hussain | 2,537 | |||
| Labour | Imran Hussain | 2,457 | |||
| Liberal Democrats | Mahmood Hussain | 1,398 | 19.6 | N/A | |
| Labour | Olayemi Fagborun | 1,185 | |||
| Conservative | Qurban Hussain Malik | 1,044 | |||
| Liberal Democrats | Christine Reid | 1,035 | |||
| Liberal Democrats | Zubair Hussain | 806 | |||
| Majority | 80 | 1.4 | N/A | ||
| Turnout | 7,089 | 65.3 | N/A | ||
| Conservative win (new seat) | |||||
| Labour win (new seat) | |||||
| Conservative win (new seat) | |||||
| Party | Candidate | Votes | % | ±% | |
|---|---|---|---|---|---|
| Labour | Michael Johnson | 1,714 | 55.1 | N/A | |
| Labour | John Ruding | 1,683 | |||
| Labour | James Anthony Cairns | 1,478 | |||
| Liberal Democrats | Joan Collins | 713 | 22.9 | N/A | |
| Conservative | Derek Ernest Green | 684 | 22.0 | N/A | |
| Conservative | Garry Robert Walls | 672 | |||
| Liberal Democrats | Janet Margaret Blenkey | 667 | |||
| Liberal Democrats | Colin George McPhee | 650 | |||
| Conservative | Afaq Alam | 502 | |||
| Majority | 765 | 32.2 | N/A | ||
| Turnout | 3,574 | 32.6 | N/A | ||
| Labour win (new seat) | |||||
| Labour win (new seat) | |||||
| Labour win (new seat) | |||||
| Party | Candidate | Votes | % | ±% | |
|---|---|---|---|---|---|
| Conservative | Dale Smith | 2,028 | 44.0 | N/A | |
| Conservative | Matthew James Steven Palmer | 2,004 | |||
| Conservative | Christopher Ian Greaves | 1,984 | |||
| Liberal Democrats | Vernon Patrick Harcourt Whelan | 1,313 | 28.5 | N/A | |
| Liberal Democrats | Francis Rowland Dale | 858 | |||
| Liberal Democrats | Alan Sykes | 804 | |||
| Labour | Elaine Christine Cooper | 706 | 15.3 | N/A | |
| Labour | Ronda Lesley Christensen | 668 | |||
| Labour | Lorraine Colette Kirkwood | 657 | |||
| Green | Julie Jane Cowdery | 562 | 12.2 | N/A | |
| Majority | 671 | 15.5 | N/A | ||
| Turnout | 4,961 | 55.7 | N/A | ||
| Conservative win (new seat) | |||||
| Conservative win (new seat) | |||||
| Conservative win (new seat) | |||||
| Party | Candidate | Votes | % | ±% | |
|---|---|---|---|---|---|
| Labour | David Michael Adam Green | 1,460 | 30.8 | N/A | |
| Labour | Ralph David Ritchie Berry | 1,426 | |||
| BNP | Arthur Collins Redfearn | 1,355 | 28.6 | N/A | |
| Conservative | Dorothy Craven | 1,341 | 28.3 | N/A | |
| Labour | Lynne Eleanor Smith | 1,331 | |||
| Conservative | Richard Ian Sheard | 1,279 | |||
| Conservative | Mark Holden | 1,234 | |||
| Liberal Democrats | Brian Moore | 581 | 12.3 | N/A | |
| Liberal Democrats | Abdul Hafeez | 380 | |||
| Majority | 14 | 2.2 | N/A | ||
| Turnout | 4,620 | 43.5 | N/A | ||
| Labour win (new seat) | |||||
| Labour win (new seat) | |||||
| BNP win (new seat) | |||||
| Party | Candidate | Votes | % | ±% | |
|---|---|---|---|---|---|
| Labour | Phillip Thornton | 1,572 | 34.7 | N/A | |
| Labour | Tony Miller | 1,423 | |||
| Labour | Vanda Greenwood | 1,268 | |||
| Liberal Democrats | Ronald Craig | 1,137 | 25.1 | N/A | |
| Liberal Democrats | John Hall | 960 | |||
| Liberal Democrats | Marian Hughes Taylor | 911 | |||
| Conservative | Derek Taylor | 884 | 19.5 | N/A | |
| Conservative | Deborah Gail Davies | 856 | |||
| Conservative | David James | 804 | |||
| Independent | Michael Breen | 542 | 12.0 | N/A | |
| Green | Robert Minter Nicholls | 396 | 8.7 | N/A | |
| Majority | 131 | 9.6 | N/A | ||
| Turnout | 4,151 | 39.2 | N/A | ||
| Labour win (new seat) | |||||
| Labour win (new seat) | |||||
| Labour win (new seat) | |||||
| Party | Candidate | Votes | % | ±% | |
|---|---|---|---|---|---|
| Conservative | Kristan Frederick Hopkins | 1,734 | 26.7 | N/A | |
| Conservative | Peter Henry Hill | 1,651 | |||
| BNP | Christopher Neil Kirby | 1,480 | 22.8 | N/A | |
| Conservative | Glen William Miller | 1,473 | |||
| Labour | Mark Bernard Curtis | 1,227 | 18.9 | N/A | |
| Labour | Trevor Lindley | 1,109 | |||
| Liberal Democrats | John Hopkinson | 1,074 | 16.5 | N/A | |
| Independent | David Samuels | 983 | 15.1 | N/A | |
| Liberal Democrats | Glynis Gumbley | 940 | |||
| Labour | Carolyn Gibbons Lowing | 881 | |||
| Majority | 7 | 3.9 | N/A | ||
| Turnout | 5,372 | 52.9 | N/A | ||
| Conservative win (new seat) | |||||
| Conservative win (new seat) | |||||
| BNP win (new seat) | |||||
| Party | Candidate | Votes | % | ±% | |
|---|---|---|---|---|---|
| Labour | David Alexander Robinson | 1,700 | 30.7 | N/A | |
| BNP | James Graham Lewthwaite | 1,583 | 28.6 | N/A | |
| Labour | Max Cummins | 1,421 | |||
| Conservative | Paul Steven Jordan | 1,420 | 25.6 | N/A | |
| Labour | Rosemary Watson | 1,363 | |||
| Conservative | John Arthur Stead | 1,194 | |||
| Conservative | Gordon Johnson | 1,060 | |||
| Liberal Democrats | David Andrew Christie | 836 | 15.1 | N/A | |
| Liberal Democrats | Kevin Anthony Hall | 621 | |||
| Majority | 1 | 2.1 | N/A | ||
| Turnout | 4,962 | 46.4 | N/A | ||
| Labour win (new seat) | |||||
| BNP win (new seat) | |||||
| Labour win (new seat) | |||||
By-elections between 2004 and 2006 edit
| Party | Candidate | Votes | % | ±% | |
|---|---|---|---|---|---|
| Conservative | Andrew Naylor | 1,304 | 57.0 | +13.4 | |
| Labour | Steven Carter | 669 | 29.2 | +10.7 | |
| Liberal Democrats | Frances McAulay | 315 | 13.8 | -3.7 | |
| Majority | 635 | 27.8 | +4.6 | ||
| Turnout | 2,288 | 18.7 | -31.6 | ||
| Conservative hold | Swing | +1.3 | |||
| Party | Candidate | Votes | % | ±% | |
|---|---|---|---|---|---|
| Labour | Angela Sinfield | 1,819 | 47.0 | +22.2 | |
| BNP | Ian Dawson | 1,216 | 31.4 | +2.3 | |
| Conservative | Lionel Lockley | 627 | 16.2 | -3.8 | |
| Liberal Democrats | Victoria Salmons | 208 | 5.4 | -4.8 | |
| Majority | 603 | 15.6 | +11.4 | ||
| Turnout | 3,870 | 35.1 | -10.5 | ||
| Labour gain from BNP | Swing | +9.9 | |||
References edit
- ^ a b c d e f g h i j k l m n o p q r s t u v w x y z aa ab ac ad ae af "Local Election Results 2004" (PDF). bradford.gov.uk. Archived from the original (PDF) on 23 September 2015. Retrieved 30 August 2015.
- ^ "Vote 2012: Bradford". BBC News Online. Retrieved 1 August 2015.
- ^ a b "Local Authority Byelection Results". gwydir.demon.co.uk. Archived from the original on 29 March 2010. Retrieved 10 August 2015.