


Summary
The 2004 European Parliament election in Italy was held on 12 and 13 June 2004.
| |||||||||||||||||||||||||||||||||||||||||||||||||||||||||||||||||||||||||||||||||||||||
All 78 Italian seats to the European Parliament | |||||||||||||||||||||||||||||||||||||||||||||||||||||||||||||||||||||||||||||||||||||||
| Turnout | 71.72 ( | ||||||||||||||||||||||||||||||||||||||||||||||||||||||||||||||||||||||||||||||||||||||
|---|---|---|---|---|---|---|---|---|---|---|---|---|---|---|---|---|---|---|---|---|---|---|---|---|---|---|---|---|---|---|---|---|---|---|---|---|---|---|---|---|---|---|---|---|---|---|---|---|---|---|---|---|---|---|---|---|---|---|---|---|---|---|---|---|---|---|---|---|---|---|---|---|---|---|---|---|---|---|---|---|---|---|---|---|---|---|---|
This lists parties that won seats. See the complete results below.
| |||||||||||||||||||||||||||||||||||||||||||||||||||||||||||||||||||||||||||||||||||||||
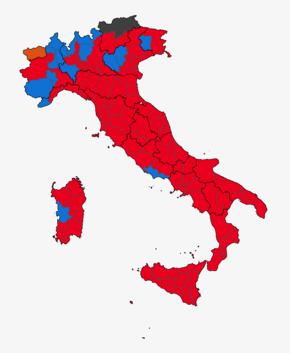
Italy's highly fragmented party system made it hard to identify an overall trend, but the results were generally seen as a defeat for Italian Prime Minister Silvio Berlusconi and a victory for the centre-left opposition coalition identified with Romano Prodi, who was President of the European Commission until 2004, and was widely expected to re-enter Italian politics at the next election.
The common list of The Olive Tree, comprising mainly the Democrats of the Left and The Daisy became the largest list, with an important psychological effect. However, expectations for this list were originally somewhat larger, and Massimo D'Alema had proclaimed that "If the unity list reaches 33%, the government has to go".
While the Olive Tree's performance was not as phenomenal as it had hoped, the test indicated a somewhat reduced support for the centre-right coalition. However, in European elections, Italians tend to vote in a more candidate-oriented way, giving their vote more easily to a candidate outside their usual party; this generally reduces the significance of these elections.
Electoral system edit
The pure party-list proportional representation was the traditional electoral system of the Italian Republic since its foundation in 1946, so it had been adopted to elect the Italian representatives to the European Parliament too.
Two levels were used: a national level to divide seats between parties, and a constituency level to distribute them between candidates. Italian regions were united in 5 constituencies, each electing a group of deputies.
At national level, seats were divided between party lists using the largest remainder method with Hare quota. All seats gained by each party were automatically distributed to their local open lists and their most voted candidates.
Main parties and leaders edit
Outgoing MEPs edit
Summary of parties edit

Results edit
| Party | EP group | Main candidate | Votes | % | +/– | Seats | +/– | ||
|---|---|---|---|---|---|---|---|---|---|
| The Olive Tree | PES ALDE PES PES ALDE |
Lilli Gruber | 10,105,836 | 31.08 | 1.53 |
24 12 7 2 2 1 |
3 4 0 2 New | ||
| South Tyrolean People's Party (SVP) | EPP-ED | Michl Ebner | 146,357 | 0.45 | 0.05 |
1 | 0 | ||
| Federalism (Valdostan Union – others) | None | 29,598 | 0.09 | 0.04 |
0 | 0 | |||
| Total | Mixed | 10,281,791 | 31.62 | 2.62 |
25 | 2 | |||
| Forza Italia (FI) | EPP-ED | Silvio Berlusconi | 6,806,245 | 20.93 | 4.23 |
16 | 6 | ||
| National Alliance (AN) | UEN | Gianfranco Fini | 3,736,606 | 11.49 | 1.19 |
9 | 1 | ||
| Communist Refoundation Party (PRC) | GUE/NGL | Fausto Bertinotti | 1,969,776 | 6.06 | 1.79 |
5 | 1 | ||
| Union of Christian and Centre Democrats (UDC) | EPP-ED | Salvatore Cuffaro | 1,914,726 | 5.89 | 1.14 |
5 | 1 | ||
| Northern League (LN) | IND/DEM | Umberto Bossi | 1,613,506 | 4.96 | 0.48 |
4 | 0 | ||
| Federation of the Greens (FdV) | Greens/EFA | Sepp Kusstatscher | 803,356 | 2.47 | 0.71 |
2 | 0 | ||
| Party of Italian Communists (PdCI) | GUE/NGL | Oliviero Diliberto | 787,613 | 2.42 | 0.42 |
2 | 0 | ||
| Bonino List (LB) | ALDE | Emma Bonino | 731,536 | 2.25 | 6.20 |
2 | 5 | ||
| Italy of Values (IdV) | ALDE | Antonio Di Pietro | 695,179 | 2.14 | New | 2 | New | ||
| United Socialists for Europe (SUE) | NI | Gianni De Michelis | 664,463 | 2.04 | New | 2 | New | ||
| Popular Alliance – UDEUR (AP–UDEUR) | EPP-ED | Clemente Mastella | 419,173 | 1.29 | 0.32 |
1 | 0 | ||
| Social Alternative (LdA – FN – FSN) | NI | Alessandra Mussolini | 400,626 | 1.23 | New | 1 | New | ||
| Pensioners' Party (PP) | EPP-ED | Carlo Fatuzzo | 374,343 | 1.15 | 0.40 |
1 | 0 | ||
| Tricolour Flame (FT) | NI | Luca Romagnoli | 237,058 | 0.73 | 0.87 |
1 | 0 | ||
| Italian Republican Party – The Liberals Sgarbi (PRI–LS) | ALDE | 233,144 | 0.72 | 0.18 |
0 | 1 | |||
| Segni-Scognamiglio Pact (PSS) | None | 172,556 | 0.53 | — | 0 | 1 | |||
| LAL – LFV – PSd'Az – UfS | None | 160,101 | 0.49 | — | 0 | 0 | |||
| Consumers' List (LC) | None | 160,066 | 0.49 | New | 0 | New | |||
| Abolizione Scorporo (Greens Greens – Federalist Greens) | None | 158,988 | 0.49 | New | 0 | New | |||
| New Country (PN) | None | 78,003 | 0.24 | New | 0 | New | |||
| No Euro (NE) | None | 70,220 | 0.22 | New | 0 | New | |||
| Social Idea Movement (MIS) | None | 47,171 | 0.15 | New | 0 | New | |||
| Valid votes | 32,516,246 | 91.04 | |||||||
| Blank and Invalid votes | 3,201,256 | 8.96 | |||||||
| Totals | 35,717,655 | 100.00 | — | 78 | — | ||||
| Electorate and voter turnout | 49,804,087 | 71.72 | |||||||
| Source: Ministry of the Interior | |||||||||
Seats edit

Seats are allocated to party lists on a national basis using an electoral quota, with the residue given to the lists with the largest excess over whole quotas. An electoral quota is then calculated for each list and used to allocate seats to each list in each of the five electoral regions.
| Electoral Region | Administrative Regions | Seats |
|---|---|---|
| North-West | Aosta Valley, Liguria, Lombardy, Piedmont | 23 |
| North-East | Emilia-Romagna, Friuli-Venezia Giulia, Trentino-Alto Adige/Südtirol, Veneto | 15 |
| Central | Latium, Marche, Tuscany, Umbria | 16 |
| Southern | Abruzzo, Apulia, Basilicata, Calabria, Campania, Molise | 17 |
| Islands | Sardinia, Sicily | 7 |
References edit
External links edit
- European Election News by European Election Law Association (Eurela)