


Summary
The Cornwall Council election, 2009, was an election for all 123 seats on the council. Cornwall Council is a unitary authority that covers the majority of the ceremonial county of Cornwall, with the exception of the Isles of Scilly which have an independent local authority. The elections took place concurrently with other local elections across England and Wales as well as the UK component of the elections to the European Parliament. Cornwall had seen its district and county councils abolished, replaced by a single 123-member Cornish unitary authority, for which councillors were elected for a full term.
| |||||||||||||||||||||||||||||||||||
All 123 seats to Cornwall Council 62 seats needed for a majority | |||||||||||||||||||||||||||||||||||
|---|---|---|---|---|---|---|---|---|---|---|---|---|---|---|---|---|---|---|---|---|---|---|---|---|---|---|---|---|---|---|---|---|---|---|---|
| |||||||||||||||||||||||||||||||||||
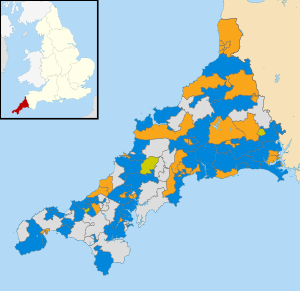 Map showing the results of the 2009 Cornwall Council elections results by electoral division. Blue showing Conservative, yellow showing Liberal Democrats, grey showing independents and old gold showing Mebyon Kernow. | |||||||||||||||||||||||||||||||||||
All locally registered electors (British, Irish, Commonwealth and European Union citizens) who were aged 18 or over on Thursday 2 May 2009 were entitled to vote in the local elections. Those who were temporarily away from their ordinary address (for example, away working, on holiday, in student accommodation or in hospital) were also entitled to vote in the local elections,[1] although those who had moved abroad and registered as overseas electors cannot vote in the local elections. It is possible to register to vote at more than one address (such as a university student who had a term-time address and lives at home during holidays) at the discretion of the local Electoral Register Office, but it remains an offence to vote more than once in the same local government election.[2]
There were 123 members elected, replacing the previous 82 councillors on Cornwall County Council and the 249 on the six district councils.[3] The outgoing Cornwall County Council had 48 Liberal Democrat members, nine Conservatives, five Labour, one from the small Liberal Party with the remaining 19 seats held by Independent candidates. Mebyon Kernow had no county councillors, but nine district councillors, before the two-tier system was abolished.[4]
The Lib Dems lost overall control of Cornwall Council to 'no overall control' – this means that no single party has overall control of the new council despite the Conservatives have the largest number of councillors, however they do not have enough for a majority control.[5] The cabinet of the council was therefore formed as a coalition between the Conservatives and the Independent bloc.[6] The Conservatives received 34% of the vote (50 seats), followed by the Liberal Democrats on 28% (38 seats), the Independents on 23% (32 seats) and Mebyon Kernow on 4% (3 seats). The turnout was 41%. Labour, the Green Party, UKIP and the BNP failed to secure any seats in Cornwall.[7]
Results edit
| 2009 Cornwall Council election | ||||||||
|---|---|---|---|---|---|---|---|---|
| Party | Seats | Seats % | Votes % | Votes | Candidates | Av. Votes | Av. Votes % | |
| Conservative | 50 | 40.7% | 33.8% | 57,115 | 123 | 464 | 33.8% | |
| Liberal Democrats | 38 | 30.9% | 28.2% | 47,801 | 119 | 402 | 29.3% | |
| Independent | 32 | 26.0% | 23.8% | 40,193 | 106 | 379 | 27.5% | |
| Mebyon Kernow | 3 | 2.4% | 4.3% | 7,290 | 33 | 221 | 16% | |
| UKIP | 0 | 0% | 3.8% | 6,350 | 26 | 244 | 18% | |
| Labour | 0 | 0% | 3.4% | 5,698 | 59 | 97 | 7.1% | |
| Green | 0 | 0% | 1.9% | 3,139 | 16 | 196 | 14.6% | |
| Liberal | 0 | 0% | 0.6% | 945 | 9 | 105 | 8.2% | |
| BNP | 0 | 0% | 0.2% | 363 | 4 | 91 | ||
| English Democrat | 0 | 0% | 0.1% | 81 | 1 | 81 | ||
Electoral division results edit
The electoral division results listed below.[8]
| Party | Candidate | Votes | % | ||
|---|---|---|---|---|---|
| Conservative | Philip Percival Parsons | 639 | 40.6 | ||
| Independent | David William Eno | 559 | 35.5 | ||
| Liberal Democrats | Ken Scoble | 375 | 23.8 | ||
| Majority | 80 | 5.1 | |||
| Turnout | 1,573 | 49.2 | |||
| Conservative win (new seat) | |||||
| Party | Candidate | Votes | % | ||
|---|---|---|---|---|---|
| Liberal Democrats | Pat Rogerson | 532 | 49.8 | ||
| Conservative | Peter Bray | 300 | 28.1 | ||
| Independent | Linda Spear | 236 | 22.1 | ||
| Majority | 232 | 21.7 | |||
| Turnout | 1,068 | 28.5 | |||
| Liberal Democrats win (new seat) | |||||
| Party | Candidate | Votes | % | ||
|---|---|---|---|---|---|
| Conservative | Lance Kennedy | 540 | 51.6 | ||
| Liberal Democrats | Steve Rogerson | 507 | 48.4 | ||
| Majority | 33 | 3.2 | |||
| Turnout | 1,047 | 32.7 | |||
| Conservative win (new seat) | |||||
| Party | Candidate | Votes | % | ||
|---|---|---|---|---|---|
| Liberal Democrats | Ann Mary Kerridge | 734 | 64.7 | ||
| Conservative | Ken Stubbs | 401 | 35.3 | ||
| Majority | 333 | 29.3 | |||
| Turnout | 1,135 | 30.2 | |||
| Liberal Democrats win (new seat) | |||||
| Party | Candidate | Votes | % | ||
|---|---|---|---|---|---|
| Independent | John Victor Keeling | 527 | 58.1 | ||
| Liberal Democrats | John Martin | 380 | 41.9 | ||
| Majority | 147 | 16.2 | |||
| Turnout | 907 | 24.5 | |||
| Independent win (new seat) | |||||
| Party | Candidate | Votes | % | ||
|---|---|---|---|---|---|
| Liberal Democrats | Nathan Brett Bale | 1,557 | 72.4 | ||
| Conservative | Kevin Michael Harris | 595 | 27.6 | ||
| Majority | 962 | 44.7 | |||
| Turnout | 2,152 | 43.6 | |||
| Liberal Democrats win (new seat) | |||||
| Party | Candidate | Votes | % | ||
|---|---|---|---|---|---|
| Liberal Democrats | Nigel Pearce | 572 | 53.9 | ||
| Independent | Peter James Wonnacott | 211 | 19.9 | ||
| Conservative | Lea Deely | 196 | 18.5 | ||
| Mebyon Kernow | Jaqi Heard | 83 | 7.8 | ||
| Majority | 361 | 34.0 | |||
| Turnout | 1,062 | 45.1 | |||
| Liberal Democrats win (new seat) | |||||
| Party | Candidate | Votes | % | ||
|---|---|---|---|---|---|
| Liberal Democrats | Jackie Bull | 477 | 51.6 | ||
| Conservative | Mark Farrell | 214 | 23.1 | ||
| Mebyon Kernow | Allister Mills | 180 | 19.5 | ||
| Labour | David Doyle | 54 | 5.8 | ||
| Majority | 263 | 28.4 | |||
| Turnout | 925 | 31.3 | |||
| Liberal Democrats win (new seat) | |||||
| Party | Candidate | Votes | % | ||
|---|---|---|---|---|---|
| Mebyon Kernow | Andrew John Long | 777 | 54.5 | ||
| Conservative | John Stephen McQuillan | 387 | 27.1 | ||
| Liberal Democrats | Sharon Jane Davidson | 262 | 18.4 | ||
| Majority | 390 | 27.3 | |||
| Turnout | 1,426 | 38.8 | |||
| Mebyon Kernow win (new seat) | |||||
| Party | Candidate | Votes | % | ||
|---|---|---|---|---|---|
| Conservative | Jon Stoneman | 364 | 33.4 | ||
| Liberal Democrats | John Pope | 361 | 33.1 | ||
| Mebyon Kernow | Zoe Fox | 244 | 22.4 | ||
| Labour | Brod Ross | 120 | 11.0 | ||
| Majority | 3 | 0.3 | |||
| Turnout | 1,089 | 33.8 | |||
| Conservative win (new seat) | |||||
| Party | Candidate | Votes | % | ||
|---|---|---|---|---|---|
| Conservative | Bill Jenkin | 346 | 36.9 | ||
| Liberal Democrats | David Raymond Ekinsmyth | 182 | 19.4 | ||
| Independent | Ray Catlin | 149 | 15.9 | ||
| Mebyon Kernow | John Philip Rowe | 139 | 14.8 | ||
| Labour | Jennifer Louise Forbes | 100 | 10.7 | ||
| Liberal | Gerald Ronald Tonkins | 21 | 2.2 | ||
| Majority | 164 | 17.5 | |||
| Turnout | 937 | 28.6 | |||
| Conservative win (new seat) | |||||
| Party | Candidate | Votes | % | ||
|---|---|---|---|---|---|
| Mebyon Kernow | Stuart Paul Jonathan Cullimore | 391 | 35.9 | ||
| Conservative | John Herd | 371 | 34.1 | ||
| Independent | John Woodward | 243 | 22.3 | ||
| Labour | Jacqueline Anne Harding | 83 | 7.6 | ||
| Majority | 20 | 1.8 | |||
| Turnout | 1,088 | 33.9 | |||
| Mebyon Kernow win (new seat) | |||||
| Party | Candidate | Votes | % | ||
|---|---|---|---|---|---|
| Conservative | David John Biggs | 461 | 34.2 | ||
| Mebyon Kernow | Michael Neale Champion | 280 | 20.8 | ||
| Liberal Democrats | Hayley Iris Gwendoline Waller | 250 | 18.6 | ||
| Labour | Steve Richards | 191 | 14.2 | ||
| Independent | John Trevaskis | 164 | 12.2 | ||
| Majority | 181 | 13.4 | |||
| Turnout | 1,346 | 38.4 | |||
| Conservative win (new seat) | |||||
| Party | Candidate | Votes | % | ||
|---|---|---|---|---|---|
| Conservative | Keith Goodenough | 525 | 42.1 | ||
| Liberal Democrats | Janey Comber | 454 | 36.4 | ||
| Independent | Julie Margaret Walters | 212 | 17.0 | ||
| Independent | Graham Gary Ford | 56 | 4.5 | ||
| Majority | 71 | 5.7 | |||
| Turnout | 1,247 | 41.8 | |||
| Conservative win (new seat) | |||||
| Party | Candidate | Votes | % | ||
|---|---|---|---|---|---|
| Conservative | Peter Sheppard | 434 | 38.7 | ||
| Liberal Democrats | Patricia Norah Aston | 316 | 28.2 | ||
| Labour | Candy Atherton | 254 | 22.6 | ||
| Liberal | Karl Sheehan | 118 | 10.5 | ||
| Majority | 118 | 10.5 | |||
| Turnout | 1,122 | 33.1 | |||
| Conservative win (new seat) | |||||
| Party | Candidate | Votes | % | ||
|---|---|---|---|---|---|
| Liberal Democrats | Kym Willoughby | 291 | 27.8 | ||
| Independent | Diana Rosemary Cousins | 265 | 25.3 | ||
| Conservative | Pam Rowett | 213 | 20.3 | ||
| Liberal | Kim Thomas | 147 | 14.0 | ||
| Labour | Linda Moore | 132 | 12.6 | ||
| Majority | 26 | 2.5 | |||
| Turnout | 1,048 | 33.9 | |||
| Liberal Democrats win (new seat) | |||||
| Party | Candidate | Votes | % | ||
|---|---|---|---|---|---|
| Conservative | John Dyer | 851 | 68.1 | ||
| Liberal Democrats | Maurice Vella | 333 | 26.7 | ||
| Labour | Timothy John Walsh | 65 | 5.2 | ||
| Majority | 518 | 41.5 | |||
| Turnout | 1,249 | 42.3 | |||
| Conservative win (new seat) | |||||
| Party | Candidate | Votes | % | ||
|---|---|---|---|---|---|
| Conservative | John Fitter | 589 | 53.0 | ||
| Independent | Gary John Redman | 339 | 30.5 | ||
| Liberal Democrats | Robert Morton | 184 | 16.5 | ||
| Majority | 250 | 22.5 | |||
| Turnout | 1,112 | 41.2 | |||
| Conservative win (new seat) | |||||
| Party | Candidate | Votes | % | ||
|---|---|---|---|---|---|
| Conservative | Neil Humphrey Hatton | 1,310 | 71.8 | ||
| Liberal Democrats | Adrian Bosanko | 385 | 21.1 | ||
| Labour | Jayne Ninnes | 129 | 7.1 | ||
| Majority | 925 | 50.7 | |||
| Turnout | 1,824 | 48.7 | |||
| Conservative win (new seat) | |||||
| Party | Candidate | Votes | % | ||
|---|---|---|---|---|---|
| Independent | Steve Eva | 272 | 24.3 | ||
| Liberal Democrats | Jeff Muir | 259 | 23.1 | ||
| Conservative | Marie Ryan | 241 | 21.5 | ||
| Mebyon Kernow | Pete Dudley | 192 | 17.1 | ||
| Labour | Ingrid Roye Heseltine | 156 | 13.9 | ||
| Majority | 13 | 1.2 | |||
| Turnout | 1,120 | 31.8 | |||
| Independent win (new seat) | |||||
| Party | Candidate | Votes | % | ||
|---|---|---|---|---|---|
| Independent | Mike Varney | 561 | 41.9 | ||
| Liberal Democrats | Roger John Bonney | 362 | 27.0 | ||
| Conservative | Gavin Paul Andrewartha | 339 | 25.3 | ||
| Labour | Stuart Venison | 77 | 5.8 | ||
| Majority | 199 | 14.9 | |||
| Turnout | 1,339 | 38.3 | |||
| Independent win (new seat) | |||||
| Party | Candidate | Votes | % | ||
|---|---|---|---|---|---|
| Conservative | Geoffrey Frank Evans | 521 | 43.9 | ||
| Independent | Ian Laws | 242 | 20.4 | ||
| Liberal Democrats | Maureen Davies | 181 | 15.2 | ||
| Labour | Kim Moreton | 101 | 8.5 | ||
| Mebyon Kernow | Kat Boijer | 72 | 6.1 | ||
| Independent | Allan Lester | 70 | 5.9 | ||
| Majority | 279 | 23.5 | |||
| Turnout | 1,187 | 41.7 | |||
| Conservative win (new seat) | |||||
| Party | Candidate | Votes | % | ||
|---|---|---|---|---|---|
| Independent | Grenville George Chappel | 304 | 28.4 | ||
| Liberal Democrats | Chris Smith | 248 | 23.1 | ||
| Labour | Gerald William Chin-Quee | 222 | 20.7 | ||
| Conservative | Shirley Patricia Hrydziuszka | 177 | 16.5 | ||
| Green | Ted Chapman | 121 | 11.3 | ||
| Majority | 56 | 5.2 | |||
| Turnout | 1,072 | 31.3 | |||
| Independent win (new seat) | |||||
| Party | Candidate | Votes | % | ||
|---|---|---|---|---|---|
| Independent | David Saunby | 572 | 41.7 | ||
| Independent | Vicky Eva | 303 | 22.1 | ||
| Liberal Democrats | John Ault | 204 | 14.9 | ||
| Conservative | Georgina Brown | 185 | 13.5 | ||
| Majority | 269 | 19.6 | |||
| Turnout | 1,371 | 38.3 | |||
| Independent win (new seat) | |||||
| Party | Candidate | Votes | % | ||
|---|---|---|---|---|---|
| Conservative | Jim Currie | 873 | 40.3 | ||
| Independent | Tomas Hill | 764 | 35.3 | ||
| Liberal Democrats | John Stuart Hyslop | 378 | 17.5 | ||
| Mebyon Kernow | Lance Dyer | 83 | 3.8 | ||
| Labour | Maureen Bailey | 67 | 3.1 | ||
| Majority | 109 | 5.0 | |||
| Turnout | 2,165 | 56.7 | |||
| Conservative win (new seat) | |||||
| Party | Candidate | Votes | % | ||
|---|---|---|---|---|---|
| Liberal Democrats | Paula Sodek Dolphin | 544 | 34.1 | ||
| Independent | Val Newman | 532 | 33.3 | ||
| Conservative | Rowland Henry Meirion Pillman | 521 | 32.6 | ||
| Majority | 12 | 0.8 | |||
| Turnout | 1,597 | 47.8 | |||
| Liberal Democrats win (new seat) | |||||
| Party | Candidate | Votes | % | ||
|---|---|---|---|---|---|
| Conservative | Sally Bain | 666 | 39.5 | ||
| Independent | Robin Eric Murtagh | 630 | 37.3 | ||
| Liberal Democrats | Anne Boosey | 391 | 23.2 | ||
| Majority | 36 | 2.1 | |||
| Turnout | 1,687 | 45.1 | |||
| Conservative win (new seat) | |||||
| Party | Candidate | Votes | % | ||
|---|---|---|---|---|---|
| Liberal Democrats | Mario Lawrence Fonk | 811 | 54.9 | ||
| Conservative | Pam Yeates | 233 | 15.8 | ||
| UKIP | Rose Vera Smith | 143 | 9.7 | ||
| Mebyon Kernow | Phillip Charles Henry Rendle | 125 | 8.5 | ||
| Green | Lesley Ann Bradley-Peer | 82 | 5.6 | ||
| Labour | Juliet Jane Eavis | 57 | 3.9 | ||
| Independent | Joseph McKenna | 26 | 1.8 | ||
| Majority | 578 | 39.1 | |||
| Turnout | 1,477 | 42.8 | |||
| Liberal Democrats win (new seat) | |||||
| Party | Candidate | Votes | % | ||
|---|---|---|---|---|---|
| Conservative | Russell James Bartlett | 512 | 29.7 | ||
| Independent | Dorothy Kirk | 324 | 18.8 | ||
| Liberal Democrats | Matthew David Waterworth | 323 | 18.7 | ||
| UKIP | Sam Gardner | 288 | 16.7 | ||
| Green | Nigel Douglas Miles | 209 | 12.1 | ||
| Independent | Shar Daw | 67 | 3.9 | ||
| Majority | 188 | 10.9 | |||
| Turnout | 1,723 | 48.1 | |||
| Conservative win (new seat) | |||||
| Party | Candidate | Votes | % | ||
|---|---|---|---|---|---|
| Conservative | Ray Tovey | 612 | 38.1 | ||
| Independent | Sheila Furneaux | 547 | 34.1 | ||
| Liberal Democrats | Steve Leverton | 356 | 22.2 | ||
| Labour | David John Hughes | 90 | 5.6 | ||
| Majority | 65 | 4.0 | |||
| Turnout | 1,605 | 44.4 | |||
| Conservative win (new seat) | |||||
| Party | Candidate | Votes | % | ||
|---|---|---|---|---|---|
| Independent | John Pollard | 653 | 50.9 | ||
| Conservative | Jeremy Joslin | 305 | 23.8 | ||
| Liberal Democrats | Robb Lello | 257 | 20.0 | ||
| Labour | Raymond John Webber | 69 | 5.4 | ||
| Majority | 348 | 27.1 | |||
| Turnout | 1,284 | 37.2 | |||
| Independent win (new seat) | |||||
| Party | Candidate | Votes | % | ||
|---|---|---|---|---|---|
| Independent | John Coombe | 494 | 36.5 | ||
| Independent | John Bennett | 301 | 22.2 | ||
| Conservative | Doe Harry | 223 | 16.5 | ||
| UKIP | Derek John Elliott | 189 | 14.0 | ||
| Labour | Tony Phillips | 87 | 6.4 | ||
| Liberal Democrats | Adi Viney | 60 | 4.4 | ||
| Majority | 193 | 14.3 | |||
| Turnout | 1,354 | 40.5 | |||
| Independent win (new seat) | |||||
| Party | Candidate | Votes | % | ||
|---|---|---|---|---|---|
| Independent | Judith Anne Haycock | 592 | 50.2 | ||
| Conservative | Keith Reynolds | 320 | 27.1 | ||
| Independent | Ronald Williams | 267 | 22.6 | ||
| Majority | 272 | 23.1 | |||
| Turnout | 1,179 | 34.3 | |||
| Independent win (new seat) | |||||
| Party | Candidate | Votes | % | ||
|---|---|---|---|---|---|
| Conservative | Alec Robertson | 550 | 41.6 | ||
| Independent | Phil Martin | 306 | 23.2 | ||
| Liberal Democrats | John Boase | 247 | 18.7 | ||
| Independent | Sue Swift | 218 | 16.5 | ||
| Majority | 244 | 18.5 | |||
| Turnout | 1,321 | 34.5 | |||
| Conservative win (new seat) | |||||
| Party | Candidate | Votes | % | ||
|---|---|---|---|---|---|
| Conservative | Terry Wilkins | 407 | 32.8 | ||
| Liberal | Paul Holmes | 318 | 25.6 | ||
| Independent | Graham Deighton Ford | 312 | 25.1 | ||
| Liberal Democrats | Amanda Dawn Mannion | 123 | 9.9 | ||
| Independent | Vanessa Fry | 81 | 6.5 | ||
| Majority | 89 | 7.2 | |||
| Turnout | 1,241 | 37.4 | |||
| Conservative win (new seat) | |||||
| Party | Candidate | Votes | % | ||
|---|---|---|---|---|---|
| Conservative | Jim Flashman | 669 | 42.6 | ||
| Liberal Democrats | Vicki Good | 407 | 25.9 | ||
| UKIP | Robin Edward Woods | 343 | 21.8 | ||
| Mebyon Kernow | Glenn Renshaw | 151 | 9.6 | ||
| Majority | 262 | 16.7 | |||
| Turnout | 1,570 | 46.7 | |||
| Conservative win (new seat) | |||||
| Party | Candidate | Votes | % | ||
|---|---|---|---|---|---|
| Conservative | Mike Eathorne-Gibbons | 617 | 41.3 | ||
| Independent | Oliver Baines | 363 | 24.3 | ||
| Liberal Democrats | Des Mennear | 362 | 24.2 | ||
| Mebyon Kernow | Annie Ostapenko-Denton | 96 | 6.4 | ||
| Labour | Deirdre Norah Kathleen Patricia Roche | 57 | 3.8 | ||
| Majority | 254 | 17.0 | |||
| Turnout | 1,495 | 43.8 | |||
| Conservative win (new seat) | |||||
| Party | Candidate | Votes | % | ||
|---|---|---|---|---|---|
| Conservative | Mick Martin | 606 | 37.5 | ||
| Liberal Democrats | Colin Edward Martin | 386 | 23.9 | ||
| Independent | Colin Basil Mutton | 357 | 22.1 | ||
| UKIP | Clive Medway | 183 | 11.3 | ||
| Independent | Alex Steele | 82 | 5.1 | ||
| Majority | 220 | 13.6 | |||
| Turnout | 1,614 | 49.2 | |||
| Conservative win (new seat) | |||||
| Party | Candidate | Votes | % | ||
|---|---|---|---|---|---|
| Liberal Democrats | Alex Folkes | 599 | 63.7 | ||
| Conservative | Chris Parsons | 341 | 36.3 | ||
| Majority | 258 | 27.4 | |||
| Turnout | 940 | 35.7 | |||
| Liberal Democrats win (new seat) | |||||
| Party | Candidate | Votes | % | ||
|---|---|---|---|---|---|
| Liberal Democrats | Adam Richard Paynter | 915 | 57.1 | ||
| Conservative | Caroline Anne Smale | 687 | 42.9 | ||
| Majority | 228 | 14.2 | |||
| Turnout | 1,602 | 50.7 | |||
| Liberal Democrats win (new seat) | |||||
| Party | Candidate | Votes | % | ||
|---|---|---|---|---|---|
| Liberal Democrats | Sasha Jane Gillard-Loft | 517 | 44.9 | ||
| Conservative | John Charles Conway | 330 | 28.7 | ||
| Independent | Victoria Geach | 304 | 26.4 | ||
| Majority | 187 | 16.2 | |||
| Turnout | 1,151 | 38.9 | |||
| Liberal Democrats win (new seat) | |||||
| Party | Candidate | Votes | % | ||
|---|---|---|---|---|---|
| Conservative | Liz Penhaligon | 704 | 51.8 | ||
| Independent | Graham Edward Webster | 386 | 28.4 | ||
| Green | Tracy Stanton | 269 | 19.8 | ||
| Majority | 318 | 23.4 | |||
| Turnout | 1,359 | 44.2 | |||
| Conservative win (new seat) | |||||
| Party | Candidate | Votes | % | ||
|---|---|---|---|---|---|
| Liberal Democrats | Jay Schofield | 674 | 55.4 | ||
| Conservative | Mike Critchley | 543 | 44.6 | ||
| Majority | 131 | 10.8 | |||
| Turnout | 1,217 | 33.4 | |||
| Liberal Democrats win (new seat) | |||||
| Party | Candidate | Votes | % | ||
|---|---|---|---|---|---|
| Conservative | Jan Powell | 284 | 46.9 | ||
| Mebyon Kernow | Roger Graeme Holmes | 184 | 30.4 | ||
| Liberal Democrats | Matthew Kilday McTaggart | 137 | 22.6 | ||
| Majority | 100 | 16.5 | |||
| Turnout | 605 | 43.1 | |||
| Conservative win (new seat) | |||||
| Party | Candidate | Votes | % | ||
|---|---|---|---|---|---|
| Liberal Democrats | Mike George | 832 | 57.1 | ||
| Conservative | Sue James-Smith | 510 | 35.0 | ||
| BNP | Alan Cook | 115 | 7.9 | ||
| Majority | 322 | 22.1 | |||
| Turnout | 1,457 | 43.5 | |||
| Liberal Democrats win (new seat) | |||||
| Party | Candidate | Votes | % | ||
|---|---|---|---|---|---|
| Conservative | Armand Jean Toms | 930 | 68.9 | ||
| UKIP | Jeff Hill | 152 | 11.3 | ||
| Liberal Democrats | Jennifer Doreen Kettles | 151 | 11.2 | ||
| Independent | Kathrina Ring | 116 | 8.6 | ||
| Majority | 778 | 57.7 | |||
| Turnout | 1,349 | 47.5 | |||
| Conservative win (new seat) | |||||
| Party | Candidate | Votes | % | ||
|---|---|---|---|---|---|
| Liberal Democrats | Edwina Mary Hannaford | 653 | 41.7 | ||
| Conservative | Brian Galipeau | 611 | 39.0 | ||
| UKIP | Tony Winter | 303 | 19.3 | ||
| Majority | 42 | 2.7 | |||
| Turnout | 1,567 | 49.4 | |||
| Liberal Democrats win (new seat) | |||||
| Party | Candidate | Votes | % | ||
|---|---|---|---|---|---|
| Conservative | Peter Gavin David Shakerley | 581 | 30.7 | ||
| Independent | Robert Henry Twisden Peareth | 460 | 24.3 | ||
| Mebyon Kernow | Julie Ruth Tamblin | 270 | 14.3 | ||
| Independent | Ken Robertson | 253 | 13.4 | ||
| UKIP | Richard Neil Binstead | 167 | 8.8 | ||
| Liberal Democrats | Deborah Earl | 159 | 8.4 | ||
| Majority | 121 | 6.4 | |||
| Turnout | 1,890 | 49.4 | |||
| Conservative win (new seat) | |||||
| Party | Candidate | Votes | % | ||
|---|---|---|---|---|---|
| Independent | Irene Bailey | 584 | 38.8 | ||
| Conservative | Roy Mann | 469 | 31.2 | ||
| Green | Mark Russell | 198 | 13.2 | ||
| UKIP | Robert Lee Smith | 130 | 8.6 | ||
| Liberal Democrats | Caroline Alice Cheyne White | 123 | 8.2 | ||
| Majority | 115 | 7.6 | |||
| Turnout | 1,504 | 44.6 | |||
| Independent win (new seat) | |||||
| Party | Candidate | Votes | % | ||
|---|---|---|---|---|---|
| Conservative | Chris Ridgers | 533 | 29.9 | ||
| Liberal Democrats | Chris Ryall | 453 | 25.4 | ||
| Independent | Georgie Fryer | 212 | 11.9 | ||
| Independent | Nicholas Ferris | 181 | 10.2 | ||
| Independent | Keith John Winterson | 162 | 9.1 | ||
| Mebyon Kernow | Jacqueline Davey | 140 | 7.9 | ||
| Labour | Harry Pitts | 99 | 5.6 | ||
| Majority | 80 | 4.5 | |||
| Turnout | 1,780 | 50.0 | |||
| Conservative win (new seat) | |||||
| Party | Candidate | Votes | % | ||
|---|---|---|---|---|---|
| Conservative | Sue Nicholas | 560 | 34.6 | ||
| Independent | Jane Howells | 423 | 26.2 | ||
| Liberal Democrats | Jack Howell Dixon | 338 | 20.9 | ||
| UKIP | Sandy Martin | 208 | 12.9 | ||
| Independent | Terry Murray | 88 | 5.4 | ||
| Majority | 137 | 8.5 | |||
| Turnout | 1,617 | 45.0 | |||
| Conservative win (new seat) | |||||
| Party | Candidate | Votes | % | ||
|---|---|---|---|---|---|
| Conservative | Bernie Ellis | 746 | 47.6 | ||
| Liberal Democrats | Anthony Hugh Francis | 433 | 27.6 | ||
| UKIP | David Russell Clue | 389 | 24.8 | ||
| Majority | 313 | 20.0 | |||
| Turnout | 1,568 | 50.1 | |||
| Conservative win (new seat) | |||||
| Party | Candidate | Votes | % | ||
|---|---|---|---|---|---|
| Conservative | Denise Gleneth Mutton | 731 | 44.5 | ||
| Liberal Democrats | Les Hunkin | 680 | 41.4 | ||
| Green | Ian Neil Wright | 162 | 9.9 | ||
| Labour | Derek George Frederick Tibble | 68 | 4.1 | ||
| Majority | 51 | 3.1 | |||
| Turnout | 1,641 | 46.8 | |||
| Conservative win (new seat) | |||||
| Party | Candidate | Votes | % | ||
|---|---|---|---|---|---|
| Liberal Democrats | Shirley Polmounter | 380 | 36.0 | ||
| Independent | Gary James King | 362 | 34.3 | ||
| Conservative | Debbie Louise Bradley | 314 | 29.7 | ||
| Majority | 18 | 1.7 | |||
| Turnout | 1,056 | 30.5 | |||
| Liberal Democrats win (new seat) | |||||
| Party | Candidate | Votes | % | ||
|---|---|---|---|---|---|
| Liberal Democrats | Joyce Mitchell Duffin | 518 | 36.6 | ||
| Conservative | Eugene Keith Hope | 417 | 29.5 | ||
| Independent | Rose Woodward | 130 | 9.2 | ||
| Mebyon Kernow | Ray Chubb | 123 | 8.7 | ||
| Liberal | Lindsay Ann Richards | 78 | 5.5 | ||
| Labour | David Neil Acton | 57 | 4.0 | ||
| Independent | Ian Newby | 56 | 4.0 | ||
| Independent | Dennis Reginald Howland | 35 | 2.5 | ||
| Majority | 101 | 7.1 | |||
| Turnout | 1,414 | 40.7 | |||
| Liberal Democrats win (new seat) | |||||
| Party | Candidate | Votes | % | ||
|---|---|---|---|---|---|
| Conservative | Carolyn Ada Rule | 757 | 45.1 | ||
| Liberal Democrats | Barry Mundy | 512 | 30.5 | ||
| Independent | Carol Cooper | 411 | 24.5 | ||
| Majority | 245 | 14.6 | |||
| Turnout | 1,680 | 47.5 | |||
| Conservative win (new seat) | |||||
| Party | Candidate | Votes | % | ||
|---|---|---|---|---|---|
| Conservative | Jinny Clark | 621 | 40.3 | ||
| Liberal Democrats | Ken Yeo | 394 | 25.6 | ||
| Independent | Tracey Van De Laarschot | 368 | 23.9 | ||
| Liberal | Christopher Tankard | 94 | 6.1 | ||
| Labour | Susan Brown | 64 | 4.2 | ||
| Majority | 227 | 14.7 | |||
| Turnout | 1,541 | 41.0 | |||
| Conservative win (new seat) | |||||
| Party | Candidate | Votes | % | ||
|---|---|---|---|---|---|
| Conservative | Roger Harding | 840 | 57.9 | ||
| Mebyon Kernow | Simon John Reed | 259 | 17.9 | ||
| Liberal Democrats | Heidi Worth | 200 | 13.8 | ||
| Labour | Nicholas Grenville Round | 151 | 10.4 | ||
| Majority | 581 | 40.1 | |||
| Turnout | 1,450 | 39.9 | |||
| Conservative win (new seat) | |||||
| Party | Candidate | Votes | % | ||
|---|---|---|---|---|---|
| Liberal Democrats | Geoff Brown | 208 | 28.8 | ||
| Conservative | Andy Hannan | 154 | 21.3 | ||
| Independent | Tad Dewey | 119 | 16.5 | ||
| Independent | John Weller | 115 | 15.9 | ||
| Independent | Jan Dent | 86 | 11.9 | ||
| Labour | Lillian Joan Bowden | 41 | 5.7 | ||
| Majority | 54 | 7.5 | |||
| Turnout | 723 | 26.6 | |||
| Liberal Democrats win (new seat) | |||||
| Party | Candidate | Votes | % | ||
|---|---|---|---|---|---|
| Liberal Democrats | Joanna Nora Kenny | 389 | 36.3 | ||
| Conservative | Derek Robert Walker | 293 | 27.4 | ||
| Independent | Denis Christopher Dent | 278 | 26.0 | ||
| English Democrat | Keith Robert Riley | 81 | 7.6 | ||
| Labour | Raymond Thomas Aldridge | 30 | 2.8 | ||
| Majority | 96 | 9.0 | |||
| Turnout | 1,071 | 35.4 | |||
| Liberal Democrats win (new seat) | |||||
| Party | Candidate | Votes | % | ||
|---|---|---|---|---|---|
| Liberal Democrats | George Edwards | 333 | 33.6 | ||
| Conservative | Kevin Peter Towill | 286 | 28.8 | ||
| Independent | Norman Thompson | 269 | 27.1 | ||
| BNP | James Fitton | 104 | 10.5 | ||
| Majority | 47 | 4.7 | |||
| Turnout | 992 | 31.6 | |||
| Liberal Democrats win (new seat) | |||||
| Party | Candidate | Votes | % | ||
|---|---|---|---|---|---|
| Conservative | Patrick John Handsford Lambshead | 511 | 44.2 | ||
| Liberal Democrats | John Rainbow | 171 | 14.8 | ||
| Independent | Eddie Yeoman | 168 | 14.5 | ||
| Independent | Tony Leverton | 165 | 14.3 | ||
| Independent | Pam Heywood | 141 | 12.2 | ||
| Majority | 340 | 29.4 | |||
| Turnout | 1,156 | 38.8 | |||
| Conservative win (new seat) | |||||
| Party | Candidate | Votes | % | ||
|---|---|---|---|---|---|
| Independent | Harry Heywood | 333 | 31.2 | ||
| Conservative | Phil Goldman | 305 | 28.5 | ||
| Liberal Democrats | Sandy Carter | 278 | 26.0 | ||
| Green | Jenny Alldis | 100 | 9.4 | ||
| Independent | Jozsef Varga | 53 | 5.0 | ||
| Majority | 28 | 2.6 | |||
| Turnout | 1,069 | 34.6 | |||
| Independent win (new seat) | |||||
| Party | Candidate | Votes | % | ||
|---|---|---|---|---|---|
| Conservative | Stephen Rushworth | 652 | 41.9 | ||
| Liberal Democrats | Sarah Clarissa Townrow | 373 | 24.0 | ||
| Mebyon Kernow | Ron Brown | 363 | 23.3 | ||
| BNP | Bob Smart | 86 | 5.5 | ||
| Green | Katherine Victoria Spear | 82 | 5.3 | ||
| Majority | 279 | 17.9 | |||
| Turnout | 1,556 | 44.7 | |||
| Conservative win (new seat) | |||||
| Party | Candidate | Votes | % | ||
|---|---|---|---|---|---|
| Conservative | Richard Hackett Pugh | 954 | 47.0 | ||
| Liberal Democrats | Jim Candy | 781 | 38.5 | ||
| UKIP | Iris Binstead | 293 | 14.4 | ||
| Majority | 173 | 8.5 | |||
| Turnout | 2,028 | 54.7 | |||
| Conservative win (new seat) | |||||
| Party | Candidate | Votes | % | ||
|---|---|---|---|---|---|
| Conservative | Tony Martin | 659 | 39.9 | ||
| Independent | Judith Mary Whiteley | 485 | 29.4 | ||
| Liberal Democrats | Chris Banks | 249 | 15.1 | ||
| Mebyon Kernow | Duane Glasby | 159 | 9.6 | ||
| Labour | Peter Richardson | 98 | 5.9 | ||
| Majority | 174 | 10.5 | |||
| Turnout | 1,650 | 41.7 | |||
| Conservative win (new seat) | |||||
| Party | Candidate | Votes | % | ||
|---|---|---|---|---|---|
| Independent | Mary Katherine May | 363 | 31.8 | ||
| Liberal Democrats | Cait Hutchings | 345 | 30.2 | ||
| Independent | Ted Wilkes | 188 | 16.5 | ||
| Conservative | Gill Grant | 178 | 15.6 | ||
| Independent | Scott Hands | 67 | 5.9 | ||
| Majority | 18 | 1.6 | |||
| Turnout | 1,141 | 32.9 | |||
| Independent win (new seat) | |||||
| Party | Candidate | Votes | % | ||
|---|---|---|---|---|---|
| Liberal Democrats | Christopher John Rowe | 398 | 37.1 | ||
| Conservative | Peter Douglas Sinclair | 320 | 29.8 | ||
| Mebyon Kernow | Matthew John Luke | 288 | 26.8 | ||
| Labour | Shirley Bowden | 67 | 6.2 | ||
| Majority | 78 | 7.3 | |||
| Turnout | 1,073 | 33.0 | |||
| Liberal Democrats win (new seat) | |||||
| Party | Candidate | Votes | % | ||
|---|---|---|---|---|---|
| Liberal Democrats | Tamsin Williams | 365 | 30.0 | ||
| Conservative | David Nebesnuick | 351 | 28.9 | ||
| UKIP | Oli Faulkner | 216 | 17.8 | ||
| Labour | Cornelius Michael John Olivier | 210 | 17.3 | ||
| Liberal | Malcolm Lawrence | 73 | 6.0 | ||
| Majority | 14 | 1.2 | |||
| Turnout | 1,215 | 37.2 | |||
| Liberal Democrats win (new seat) | |||||
| Party | Candidate | Votes | % | ||
|---|---|---|---|---|---|
| Liberal Democrats | Ruth Lewarne | 357 | 30.4 | ||
| Labour | John Payne | 332 | 28.3 | ||
| UKIP | Ricky Barnes | 199 | 16.9 | ||
| Conservative | Margaret Powell | 159 | 13.5 | ||
| Independent | Mike Waters | 128 | 10.9 | ||
| Majority | 25 | 2.1 | |||
| Turnout | 1,175 | 34.4 | |||
| Liberal Democrats win (new seat) | |||||
| Party | Candidate | Votes | % | ||
|---|---|---|---|---|---|
| Independent | Sue Pass | 618 | 37.8 | ||
| Liberal Democrats | Jan Ruhrmund | 484 | 29.6 | ||
| Conservative | Malcolm Ernest Pilcher | 333 | 20.4 | ||
| UKIP | Patricia Elizabeth Garnier | 136 | 8.3 | ||
| Labour | Mike Lovegrove | 62 | 3.8 | ||
| Majority | 134 | 8.2 | |||
| Turnout | 1,633 | 52.1 | |||
| Independent win (new seat) | |||||
| Party | Candidate | Votes | % | ||
|---|---|---|---|---|---|
| Independent | Michael Callan | 743 | 47.2 | ||
| Conservative | Rob Thomas | 351 | 22.3 | ||
| Independent | David Charles Hancock | 285 | 18.1 | ||
| Liberal Democrats | Joseph William Swain | 150 | 9.5 | ||
| Labour | David Norman Breacker | 44 | 2.8 | ||
| Majority | 392 | 24.9 | |||
| Turnout | 1,573 | 43.1 | |||
| Independent win (new seat) | |||||
| Party | Candidate | Votes | % | ||
|---|---|---|---|---|---|
| Independent | Andrew John Wallis | 395 | 31.5 | ||
| Liberal Democrats | Dick Powell | 378 | 30.2 | ||
| Independent | Maurice Keith Pascoe | 245 | 19.6 | ||
| Conservative | Ann Greenstreet | 234 | 18.7 | ||
| Majority | 17 | 1.4 | |||
| Turnout | 1,252 | 38.3 | |||
| Independent win (new seat) | |||||
| Party | Candidate | Votes | % | ||
|---|---|---|---|---|---|
| Conservative | Phil Tucker | 668 | 40.6 | ||
| Liberal Democrats | Bob Booker | 623 | 37.9 | ||
| UKIP | Rupert Powell | 184 | 11.2 | ||
| Mebyon Kernow | Paul Sousek | 88 | 5.3 | ||
| Independent | Barry Jordan | 82 | 5.0 | ||
| Majority | 45 | 2.7 | |||
| Turnout | 1,645 | 53.3 | |||
| Conservative win (new seat) | |||||
| Party | Candidate | Votes | % | ||
|---|---|---|---|---|---|
| Independent | Bob Egerton | 448 | 33.3 | ||
| Conservative | Viv Rogers | 385 | 28.6 | ||
| Independent | Shirley Anne Mugford | 217 | 16.1 | ||
| Liberal Democrats | Frederick Greenslade | 197 | 14.6 | ||
| Mebyon Kernow | Alan David January | 69 | 5.1 | ||
| Labour | Sheila Joyce Mackenzie | 30 | 2.2 | ||
| Majority | 63 | 4.7 | |||
| Turnout | 1,346 | 43.5 | |||
| Independent win (new seat) | |||||
| Party | Candidate | Votes | % | ||
|---|---|---|---|---|---|
| Conservative | George William Trubody | 682 | 33.7 | ||
| Independent | Rebecca Lingard | 553 | 27.3 | ||
| Liberal Democrats | Peter Martin Nicholas | 385 | 19.0 | ||
| UKIP | Russ Smith | 264 | 13.0 | ||
| Mebyon Kernow | Jeremy Evans | 141 | 7.0 | ||
| Majority | 129 | 6.4 | |||
| Turnout | 2,025 | 52.1 | |||
| Conservative win (new seat) | |||||
| Party | Candidate | Votes | % | ||
|---|---|---|---|---|---|
| Conservative | Mike Eddowes | 283 | 30.4 | ||
| Independent | Len Pascoe | 275 | 29.6 | ||
| Liberal Democrats | Bill Turner | 93 | 10.0 | ||
| Labour | Tony Bunt | 91 | 9.8 | ||
| Mebyon Kernow | Mike Hall | 81 | 8.7 | ||
| Independent | Lloyd Andrew Jenkin | 75 | 8.1 | ||
| Liberal | Charles Henry Skinner | 32 | 3.4 | ||
| Majority | 8 | 0.9 | |||
| Turnout | 930 | 31.8 | |||
| Conservative win (new seat) | |||||
| Party | Candidate | Votes | % | ||
|---|---|---|---|---|---|
| Independent | Lisa Dolley | 366 | 37.6 | ||
| Labour | Stephen Barnes | 278 | 28.6 | ||
| Conservative | Roger Pattinson | 206 | 21.2 | ||
| Liberal Democrats | Sam Horwood | 123 | 12.6 | ||
| Majority | 88 | 9.0 | |||
| Turnout | 973 | 32.1 | |||
| Independent win (new seat) | |||||
| Party | Candidate | Votes | % | ||
|---|---|---|---|---|---|
| Independent | Graeme Peter Hicks | 728 | 60.8 | ||
| Liberal Democrats | Mary Veneranda McWilliams | 227 | 19.0 | ||
| Conservative | Barbara Ruth Ellenbroek | 187 | 15.6 | ||
| Labour | Barney Simon Neild | 55 | 4.6 | ||
| Majority | 501 | 41.9 | |||
| Turnout | 1,197 | 39.2 | |||
| Independent win (new seat) | |||||
| Party | Candidate | Votes | % | ||
|---|---|---|---|---|---|
| Independent | John Wood | 601 | 53.2 | ||
| Liberal Democrats | Brian John Higman | 378 | 33.5 | ||
| Conservative | Rachel Beadle | 151 | 13.4 | ||
| Majority | 223 | 19.7 | |||
| Turnout | 1,130 | 39.5 | |||
| Independent win (new seat) | |||||
| Party | Candidate | Votes | % | ||
|---|---|---|---|---|---|
| Independent | Julian Ronald Ralph German | 1,089 | 65.2 | ||
| Conservative | Peter Stuart Woodbridge | 409 | 24.5 | ||
| Liberal Democrats | Mark David Hatwood | 173 | 10.4 | ||
| Majority | 680 | 40.7 | |||
| Turnout | 1,671 | 54.5 | |||
| Independent win (new seat) | |||||
| Party | Candidate | Votes | % | ||
|---|---|---|---|---|---|
| Liberal Democrats | Bryan David Preston | 618 | 51.8 | ||
| Conservative | David Andrew Yates | 436 | 36.6 | ||
| Green | Godfrey Richard Allen | 138 | 11.6 | ||
| Majority | 182 | 15.3 | |||
| Turnout | 1,192 | 39.0 | |||
| Liberal Democrats win (new seat) | |||||
| Party | Candidate | Votes | % | ||
|---|---|---|---|---|---|
| Liberal Democrats | Bob Austin | 718 | 60.1 | ||
| Conservative | Dennis John Dicker | 476 | 39.9 | ||
| Majority | 242 | 20.3 | |||
| Turnout | 1,194 | 36.5 | |||
| Liberal Democrats win (new seat) | |||||
| Party | Candidate | Votes | % | ||
|---|---|---|---|---|---|
| Independent | Derek Alan Holley | 651 | 47.0 | ||
| Conservative | Joe Ellison | 453 | 32.7 | ||
| Liberal Democrats | Fran Knight | 282 | 20.3 | ||
| Majority | 198 | 14.3 | |||
| Turnout | 1,386 | 41.4 | |||
| Independent win (new seat) | |||||
| Party | Candidate | Votes | % | ||
|---|---|---|---|---|---|
| Liberal Democrats | Colin Laurence Riches | 614 | 55.8 | ||
| Conservative | David Carter | 486 | 44.2 | ||
| Majority | 128 | 11.6 | |||
| Turnout | 1,100 | 31.7 | |||
| Liberal Democrats win (new seat) | |||||
| Party | Candidate | Votes | % | ||
|---|---|---|---|---|---|
| Liberal Democrats | Les Donnithorne | 874 | 58.4 | ||
| Conservative | Dawn Patricia Brown | 548 | 36.6 | ||
| Labour | Susan Ann Fry Webber | 75 | 5.0 | ||
| Majority | 326 | 21.8 | |||
| Turnout | 1,497 | 41.8 | |||
| Liberal Democrats win (new seat) | |||||
| Party | Candidate | Votes | % | ||
|---|---|---|---|---|---|
| Conservative | Richard Stewart | 829 | 59.4 | ||
| Liberal Democrats | Terry Ralph | 468 | 33.5 | ||
| Labour | Ann Phillips | 98 | 7.0 | ||
| Majority | 361 | 25.9 | |||
| Turnout | 1,395 | 43.3 | |||
| Conservative win (new seat) | |||||
| Party | Candidate | Votes | % | ||
|---|---|---|---|---|---|
| Liberal Democrats | Graham Eric Walker | 462 | 35.1 | ||
| Conservative | Bob Davidson | 444 | 33.7 | ||
| UKIP | Ian Kenwyn Proctor | 208 | 15.8 | ||
| Mebyon Kernow | Peter Morton-Nance | 140 | 10.6 | ||
| Labour | Peter Corby | 64 | 4.9 | ||
| Majority | 18 | 1.4 | |||
| Turnout | 1,318 | 35.9 | |||
| Liberal Democrats win (new seat) | |||||
| Party | Candidate | Votes | % | ||
|---|---|---|---|---|---|
| Conservative | Jenny Mason | 569 | 49.2 | ||
| Liberal Democrats | Sandra Elizabeth Heyward | 516 | 44.6 | ||
| Labour | Muriel Richardson | 72 | 6.2 | ||
| Majority | 53 | 4.6 | |||
| Turnout | 1,157 | 34.3 | |||
| Conservative win (new seat) | |||||
| Party | Candidate | Votes | % | ||
|---|---|---|---|---|---|
| Conservative | Steve Double | 379 | 35.4 | ||
| Liberal Democrats | John Ball Stocker | 312 | 29.1 | ||
| Independent | Steven David Honey | 289 | 27.0 | ||
| Labour | Andrea Hilary Lanxon | 91 | 8.5 | ||
| Majority | 67 | 6.3 | |||
| Turnout | 1,071 | 32.8 | |||
| Conservative win (new seat) | |||||
| Party | Candidate | Votes | % | ||
|---|---|---|---|---|---|
| Liberal Democrats | Roy Taylor | 584 | 55.6 | ||
| Conservative | Valerie Ann Bradford | 295 | 28.1 | ||
| Labour | Tom Riddle | 172 | 16.4 | ||
| Majority | 289 | 27.5 | |||
| Turnout | 1,051 | 28.7 | |||
| Liberal Democrats win (new seat) | |||||
| Party | Candidate | Votes | % | ||
|---|---|---|---|---|---|
| Conservative | Bill Maddern | 814 | 47.5 | ||
| Liberal Democrats | Sharon Julie Brolly | 554 | 32.3 | ||
| Green | Rob Pickering | 347 | 20.2 | ||
| Majority | 260 | 15.2 | |||
| Turnout | 1,715 | 46.4 | |||
| Conservative win (new seat) | |||||
| Party | Candidate | Votes | % | ||
|---|---|---|---|---|---|
| Liberal Democrats | Derris Rosslyn Watson | 774 | 45.3 | ||
| Conservative | Sharon Marie Hancock | 585 | 34.2 | ||
| UKIP | David Garth Lucas | 350 | 20.5 | ||
| Majority | 189 | 11.1 | |||
| Turnout | 1,709 | 46.9 | |||
| Liberal Democrats win (new seat) | |||||
| Party | Candidate | Votes | % | ||
|---|---|---|---|---|---|
| Independent | Pat Harvey | 450 | 32.7 | ||
| Independent | Paul Wills | 321 | 23.3 | ||
| Conservative | Deran Hancock | 313 | 22.7 | ||
| Liberal Democrats | Karen Elizabeth Blake | 242 | 17.6 | ||
| Labour | Judith Blakeburn | 50 | 3.6 | ||
| Majority | 129 | 9.4 | |||
| Turnout | 1,376 | 38.6 | |||
| Independent win (new seat) | |||||
| Party | Candidate | Votes | % | ||
|---|---|---|---|---|---|
| Independent | Mark Anthony Kaczmarek | 874 | 66.2 | ||
| Independent | John Thomas | 308 | 23.3 | ||
| Conservative | Jessie Rheel | 94 | 7.1 | ||
| Liberal Democrats | Janet Palmer | 45 | 3.4 | ||
| Majority | 566 | 42.8 | |||
| Turnout | 1,321 | 38.3 | |||
| Independent win (new seat) | |||||
| Party | Candidate | Votes | % | ||
|---|---|---|---|---|---|
| Independent | Fred Greenslade | 705 | 71.8 | ||
| Liberal Democrats | Martin David Wayman | 160 | 16.3 | ||
| Conservative | Lyndon Spencer Harrison | 117 | 11.9 | ||
| Majority | 545 | 55.5 | |||
| Turnout | 982 | 30.9 | |||
| Independent win (new seat) | |||||
| Party | Candidate | Votes | % | ||
|---|---|---|---|---|---|
| Conservative | Brian Allan Gisbourne | 539 | 39.3 | ||
| Independent | William Josiah Dawe | 346 | 25.2 | ||
| Liberal Democrats | Harvey Lander | 329 | 24.0 | ||
| Independent | Angus Lamond | 157 | 11.5 | ||
| Majority | 193 | 14.1 | |||
| Turnout | 1,371 | 48.1 | |||
| Conservative win (new seat) | |||||
| Party | Candidate | Votes | % | ||
|---|---|---|---|---|---|
| Mebyon Kernow | Dick Cole | 927 | 77.6 | ||
| Conservative | Jacqueline Fair | 177 | 14.8 | ||
| Liberal Democrats | Keith William Hugh Wonnacott | 91 | 7.6 | ||
| Majority | 750 | 62.8 | |||
| Turnout | 1,195 | 35.7 | |||
| Mebyon Kernow win (new seat) | |||||
| Party | Candidate | Votes | % | ||
|---|---|---|---|---|---|
| Conservative | Olive Eggleston | 821 | 51.1 | ||
| Liberal Democrats | Barbara Mary McTaggart | 424 | 26.4 | ||
| Green | Roger Michael Creagh-Osborne | 361 | 22.5 | ||
| Majority | 397 | 24.7 | |||
| Turnout | 1,606 | 47.0 | |||
| Conservative win (new seat) | |||||
| Party | Candidate | Votes | % | ||
|---|---|---|---|---|---|
| Liberal Democrats | Jeremy Charles Rowe | 771 | 52.2 | ||
| Conservative | Paul William Charlesworth | 705 | 47.8 | ||
| Majority | 66 | 4.5 | |||
| Turnout | 1,476 | 46.0 | |||
| Liberal Democrats win (new seat) | |||||
| Party | Candidate | Votes | % | ||
|---|---|---|---|---|---|
| Liberal Democrats | John Laurence Turner | 531 | 31.9 | ||
| Independent | Beryl Martin | 495 | 29.8 | ||
| UKIP | Stephanie McWilliam | 319 | 19.2 | ||
| Conservative | Michael John Wright | 317 | 19.1 | ||
| Majority | 36 | 2.2 | |||
| Turnout | 1,662 | 48.4 | |||
| Liberal Democrats win (new seat) | |||||
| Party | Candidate | Votes | % | ||
|---|---|---|---|---|---|
| Conservative | Joan Tanner | 378 | 27.6 | ||
| Green | Tim Andrewes | 354 | 25.8 | ||
| Liberal Democrats | Andrew Paul Mitchell | 235 | 17.1 | ||
| Independent | Mark Noall | 203 | 14.8 | ||
| UKIP | William Stuart Guppy | 157 | 11.4 | ||
| Labour | Matt Hurst | 45 | 3.3 | ||
| Majority | 24 | 1.7 | |||
| Turnout | 1,372 | 44.1 | |||
| Conservative win (new seat) | |||||
| Party | Candidate | Votes | % | ||
|---|---|---|---|---|---|
| Conservative | Joan Hilary Symons | 536 | 42.0 | ||
| Green | Ron Tulley | 336 | 26.3 | ||
| Liberal Democrats | Richard John Ryan | 183 | 14.3 | ||
| UKIP | Paul Fredric Jackson | 147 | 11.5 | ||
| Labour | Timothy John Pullen | 75 | 5.9 | ||
| Majority | 200 | 15.7 | |||
| Turnout | 1,277 | 40.8 | |||
| Conservative win (new seat) | |||||
| Party | Candidate | Votes | % | ||
|---|---|---|---|---|---|
| Independent | Chris Goninan | 790 | 51.4 | ||
| Liberal Democrats | Sandy Angove | 507 | 33.0 | ||
| Conservative | Ken Messenger | 161 | 10.5 | ||
| Independent | Peter Martin Beech | 80 | 5.2 | ||
| Majority | 283 | 18.4 | |||
| Turnout | 1,538 | 40.5 | |||
| Independent win (new seat) | |||||
| Party | Candidate | Votes | % | ||
|---|---|---|---|---|---|
| Independent | Pam Lyne | 673 | 35.2 | ||
| Conservative | Stephen William Sobey | 657 | 34.3 | ||
| Independent | Walter Norman Sanger | 356 | 18.6 | ||
| Liberal Democrats | Nicholas David Driver | 127 | 6.6 | ||
| Independent | Diane Ruth Cash | 67 | 3.5 | ||
| Labour | Rosanna Betty Phillips | 33 | 1.7 | ||
| Majority | 16 | 0.8 | |||
| Turnout | 1,913 | 54.0 | |||
| Independent win (new seat) | |||||
| Party | Candidate | Votes | % | ||
|---|---|---|---|---|---|
| Liberal Democrats | Robin Teverson | 496 | 39.0 | ||
| Conservative | Steve Serevena | 458 | 36.0 | ||
| Independent | Chris Dodwell | 318 | 25.0 | ||
| Majority | 38 | 3.0 | |||
| Turnout | 1,272 | 41.8 | |||
| Liberal Democrats win (new seat) | |||||
| Party | Candidate | Votes | % | ||
|---|---|---|---|---|---|
| Independent | Des Curnow | 730 | 58.1 | ||
| Conservative | John Henry Smith | 270 | 21.5 | ||
| Liberal Democrats | Kim Sheena Gwendoline Wonnacott | 213 | 17.0 | ||
| Labour | Pamela Ann Watling | 43 | 3.4 | ||
| Majority | 460 | 36.6 | |||
| Turnout | 1,256 | 34.3 | |||
| Independent win (new seat) | |||||
| Party | Candidate | Votes | % | ||
|---|---|---|---|---|---|
| Independent | John Lugg | 957 | 65.1 | ||
| Conservative | Henry James Kendall | 512 | 34.9 | ||
| Majority | 445 | 30.3 | |||
| Turnout | 1,469 | 46.7 | |||
| Independent win (new seat) | |||||
| Party | Candidate | Votes | % | ||
|---|---|---|---|---|---|
| Independent | Neil Plummer | 835 | 48.0 | ||
| Conservative | Mary Sheppard | 533 | 30.6 | ||
| Liberal Democrats | Dale Matthew Cox | 208 | 11.9 | ||
| Labour | Christina Mary Bunt | 101 | 5.8 | ||
| Liberal | Norma Verone Johns | 64 | 3.7 | ||
| Majority | 302 | 17.3 | |||
| Turnout | 1,741 | 44.4 | |||
| Independent win (new seat) | |||||
| Party | Candidate | Votes | % | ||
|---|---|---|---|---|---|
| Independent | Neil Burden | 906 | 56.4 | ||
| Liberal Democrats | Phil Hutty | 360 | 22.4 | ||
| Conservative | Vivian Thomas Chavasse Hall | 341 | 21.2 | ||
| Majority | 546 | 34.0 | |||
| Turnout | 1,607 | 54.6 | |||
| Independent win (new seat) | |||||
| Party | Candidate | Votes | % | ||
|---|---|---|---|---|---|
| Liberal Democrats | Chris Pascoe | 411 | 36.2 | ||
| Conservative | Mat Hill | 339 | 29.9 | ||
| Independent | Mike Davies | 205 | 18.1 | ||
| Mebyon Kernow | Kevin Joseph George Ostapenko-Denton | 70 | 6.2 | ||
| BNP | Gwen Jenkins | 58 | 5.1 | ||
| Labour | Margaret Ruth George | 51 | 4.5 | ||
| Majority | 72 | 6.3 | |||
| Turnout | 1,134 | 40.7 | |||
| Liberal Democrats win (new seat) | |||||
| Party | Candidate | Votes | % | ||
|---|---|---|---|---|---|
| Liberal Democrats | Glenton Bruce Brown | 716 | 44.8 | ||
| Independent | Anthony Charles Brewer | 449 | 28.1 | ||
| Conservative | Paul Michael Heath | 435 | 27.2 | ||
| Majority | 267 | 16.7 | |||
| Turnout | 1,600 | 47.1 | |||
| Liberal Democrats win (new seat) | |||||
| Party | Candidate | Votes | % | ||
|---|---|---|---|---|---|
| Liberal Democrats | Brian Hobbs | 584 | 56.0 | ||
| Conservative | John Crago | 458 | 44.0 | ||
| Majority | 126 | 12.1 | |||
| Turnout | 1,042 | 33.2 | |||
| Liberal Democrats win (new seat) | |||||
| Party | Candidate | Votes | % | ||
|---|---|---|---|---|---|
| Conservative | Mike Pearn | 576 | 63.2 | ||
| Liberal Democrats | Eric Leslie Parkin | 335 | 36.8 | ||
| Majority | 241 | 26.5 | |||
| Turnout | 911 | 28.3 | |||
| Conservative win (new seat) | |||||
| Party | Candidate | Votes | % | ||
|---|---|---|---|---|---|
| Conservative | Morwenna Ann Williams | 377 | 35.9 | ||
| Liberal Democrats | Tony Bunce | 336 | 32.0 | ||
| Mebyon Kernow | Alan Sanders | 336 | 32.0 | ||
| Majority | 41 | 3.9 | |||
| Turnout | 1,049 | 28.3 | |||
| Conservative win (new seat) | |||||
| Party | Candidate | Votes | % | ||
|---|---|---|---|---|---|
| Liberal Democrats | Rob Nolan | 578 | 39.6 | ||
| Conservative | Lorrie Patricia Eathorne-Gibbons | 512 | 35.1 | ||
| Green | Howard Newlove | 155 | 10.6 | ||
| Mebyon Kernow | Joanie Mary Anne Willett | 149 | 10.2 | ||
| Labour | Alan James Ogden | 65 | 4.5 | ||
| Majority | 66 | 4.5 | |||
| Turnout | 1,459 | 40.8 | |||
| Liberal Democrats win (new seat) | |||||
| Party | Candidate | Votes | % | ||
|---|---|---|---|---|---|
| Independent | Bert Biscoe | 743 | 45.6 | ||
| Liberal Democrats | Ros Cox | 387 | 23.7 | ||
| Conservative | Steve Chamberlain | 354 | 21.7 | ||
| Mebyon Kernow | Conan James Trevenen Jenkin | 70 | 4.3 | ||
| Labour | Robert John Harrison | 48 | 2.9 | ||
| Independent | Etienne Smuts | 29 | 1.8 | ||
| Majority | 356 | 21.8 | |||
| Turnout | 1,631 | 43.0 | |||
| Independent win (new seat) | |||||
| Party | Candidate | Votes | % | ||
|---|---|---|---|---|---|
| Liberal Democrats | Doris Ansari | 531 | 41.5 | ||
| Conservative | Jacqui Butler | 348 | 27.2 | ||
| Mebyon Kernow | Loic Rich | 293 | 22.9 | ||
| Green | Lindsay Diane Southcombe | 108 | 8.4 | ||
| Majority | 183 | 14.3 | |||
| Turnout | 1,280 | 32.9 | |||
| Liberal Democrats win (new seat) | |||||
| Party | Candidate | Votes | % | ||
|---|---|---|---|---|---|
| Conservative | Fiona Ferguson | 473 | 33.0 | ||
| Independent | Sarah Madeline Trevail | 467 | 32.5 | ||
| Liberal Democrats | Tom Stubbs | 433 | 30.2 | ||
| Labour | Anthony Frank Basnett | 62 | 4.3 | ||
| Majority | 6 | 0.4 | |||
| Turnout | 1,435 | 40.3 | |||
| Conservative win (new seat) | |||||
| Party | Candidate | Votes | % | ||
|---|---|---|---|---|---|
| Liberal Democrats | David Edward Hughes | 837 | 58.0 | ||
| Conservative | Geoff Arthur | 514 | 35.6 | ||
| Labour | Keith Watson | 92 | 6.4 | ||
| Majority | 323 | 22.4 | |||
| Turnout | 1,443 | 39.7 | |||
| Liberal Democrats win (new seat) | |||||
| Party | Candidate | Votes | % | ||
|---|---|---|---|---|---|
| Independent | Collin William Brewer | 591 | 44.1 | ||
| Conservative | Andrew Nicholas Victor Williams | 446 | 33.3 | ||
| Independent | Peter Meredith | 302 | 22.6 | ||
| Majority | 145 | 10.8 | |||
| Turnout | 1,339 | 43.0 | |||
| Independent win (new seat) | |||||
| Party | Candidate | Votes | % | ||
|---|---|---|---|---|---|
| Conservative | Scott Leslie Mann | 761 | 59.9 | ||
| Liberal Democrats | Iain Macfarlane Scott | 322 | 25.3 | ||
| UKIP | Miriel Damerell-O'Connor | 188 | 14.8 | ||
| Majority | 439 | 34.5 | |||
| Turnout | 1,271 | 42.0 | |||
| Conservative win (new seat) | |||||
| Party | Candidate | Votes | % | ||
|---|---|---|---|---|---|
| Independent | Mike Clayton | 521 | 31.7 | ||
| Mebyon Kernow | Loveday Jenkin | 327 | 19.9 | ||
| Conservative | Tony Hilton | 255 | 15.5 | ||
| UKIP | Brian George Bailey | 213 | 13.0 | ||
| Liberal Democrats | Ron Edgcumbe | 165 | 10.0 | ||
| Independent | Mike Boase | 113 | 6.9 | ||
| Labour | Betty Ross | 50 | 3.0 | ||
| Majority | 194 | 11.8 | |||
| Turnout | 1,644 | 44.3 | |||
| Independent win (new seat) | |||||
Changes 2009–2013 edit
In August 2010, Neil Plummer of Stithians left the Independent group and joined Mebyon Kernow.[9] He later left Mebyon Kernow and stood for re-election as an independent.
In June 2011 Liskeard North councillor Jan Powell defected from the Conservatives to join the Liberal Democrats.[10]
In May 2012 two Liberal Democrat councillors left the Liberal Democrat group to join the Independent Group. Chris Pascoe, the councillor for Threemilestone and Gloweth, resigned in protest over the national actions of the Liberal Democrat party and the introduction of the "pasty tax".[11] Graham Walker, councillor for St Austell Bethel, defected in protest over the coalition government's education policies.[12]
In September 2012 another Liberal Democrat councillor resigned from the party. Tamsin Williams, the member for Penzance Central, defected to Mebyon Kernow, having previously been a member of it in the 1990s. She was the second member to defect to Mebyon Kernow since 2009, and her change of allegiance came after "bad decisions made by the London parties."[13] During the same month of September 2012, one Independent councillor, Lisa Dolley, left the council's Independent Group to become an ungrouped independent.
In March 2013 Conservative cabinet member for Looe East, Armand Toms, defected to the Independents over the party's decision to freeze Council Tax rather than increase it.[14]
A total of 5 by-elections were held to Cornwall Council in the 2009–2013 term of office. They are illustrated in the table below.
| By-election | Date | Incumbent | Party | Winner | Party | Cause | ||
|---|---|---|---|---|---|---|---|---|
| St Keverne and Meneage | 20 September 2012 | Pam Lyne | Independent | Walter Sanger[15] | Conservative | Death | ||
| Wendron | 24 November 2011 | Mike Clayton | Independent | Loveday Jenkin[16] | Mebyon Kernow | Death[17] | ||
| Bude North and Stratton | 27 October 2011 | Nathan Bale | Liberal Democrats | David Parsons | Liberal Democrats | Resignation | ||
| Camborne North | 13 January 2011 | Bill Jenkin | Conservative | Jude Robinson[18] | Labour | Resignation | ||
| St Austell Bay | 26 November 2009 | Richard Stewart | Conservative | John Oxenham[19] | Liberal Democrats | Resignation | ||
References edit
- ^ "The Representation of the People (Form of Canvass) (England and Wales) Regulations 2006, Schedule Part 1". Legislation.gov.uk. 13 October 2011. Retrieved 18 April 2012.
- ^ "I have two homes. Can I register at both addresses?". The Electoral Commission. Archived from the original on 7 May 2019. Retrieved 5 January 2011.
- ^ "Electoral divisions". Cornwall County. 2 September 2009. Archived from the original on 25 July 2009. Retrieved 21 September 2009.
- ^ Oates, Martyn (13 May 2009). "First election for new authority". BBC. Archived from the original on 7 June 2009. Retrieved 21 September 2009.
- ^ "Lib Dems lose control of Cornwall". BBC. 5 June 2009. Archived from the original on 8 June 2009. Retrieved 21 September 2009.
- ^ "Committee details". Cornwall Council. Retrieved 27 September 2010.
- ^ "Cornwall Council elections – Thursday, 4 June 2009". Cornwall Council. 4 June 2009. Retrieved 21 September 2009.
- ^ "Cornwall Council elections - Thursday, 4th June, 2009". Election results by electoral divisions. Cornwall Council. Retrieved 16 December 2014.
- ^ Cllr Dick Cole (4 August 2010). "Cllr Neil Plummer joins MK Group". mebyonkernow.blogspot.com. Archived from the original on 13 January 2016. Retrieved 5 October 2015.
- ^ Smith, Graham (17 June 2011). "Jan Powell quits Tories and joins Lib Dems". BBC. Archived from the original on 20 August 2011. Retrieved 20 September 2011.
- ^ Davis, Miles (15 May 2012). "Cornwall Councillor Chris Pascoe Quits Lib Dems Over Pasty Tax". This is Cornwall. Archived from the original on 17 May 2012. Retrieved 16 May 2012.
- ^ "A highly respected Lib Dem Cllr has left the party in 'disillusion' at the Con/Dem coalition's education policies". Cornwall Community News. Archived from the original on 22 October 2013. Retrieved 20 May 2012.
- ^ "Penzance councillor joins Mebyon Kernow". This is Cornwall. Archived from the original on 14 September 2012. Retrieved 12 September 2012.
- ^ "Cornwall Council cabinet member Armand Toms quits Conservatives". BBC News Online. 14 March 2013. Archived from the original on 24 May 2013. Retrieved 26 January 2014.
- ^ "Election results for St Keverne and Meneage". Cornwall Council. 20 September 2012. Retrieved 4 February 2013.
- ^ "Mebyon Kernow triumph in Wendron election". Falmouth Packet. 25 November 2011. Archived from the original on 27 April 2015. Retrieved 26 November 2011.
- ^ Emma Goodfellow (26 September 2011). "Wendron Cornwall councillor Mike Clayton dies". Falmouth Packet. Retrieved 1 November 2020.
- ^ Thomas, David (14 January 2011). "Labour sees massive swing to triumph in Camborne North election for Cornwall Council". Falmouth Packet. Archived from the original on 2 October 2011. Retrieved 20 September 2011.
- ^ "Election results for St Austell Bay By-election". Cornwall Council. 26 November 2009. Retrieved 5 October 2015.
External links edit
- Election results Cornwall Council website