


Summary
Elections to Nottinghamshire County Council took place on 4 June 2009, having been delayed from 7 May, in order to coincide with elections to the European Parliament.
| ||||||||||||||||||||||||||||||||||||||||||||||||||||||
All 67 seats to Nottinghamshire County Council 34 seats needed for a majority | ||||||||||||||||||||||||||||||||||||||||||||||||||||||
|---|---|---|---|---|---|---|---|---|---|---|---|---|---|---|---|---|---|---|---|---|---|---|---|---|---|---|---|---|---|---|---|---|---|---|---|---|---|---|---|---|---|---|---|---|---|---|---|---|---|---|---|---|---|---|
| ||||||||||||||||||||||||||||||||||||||||||||||||||||||
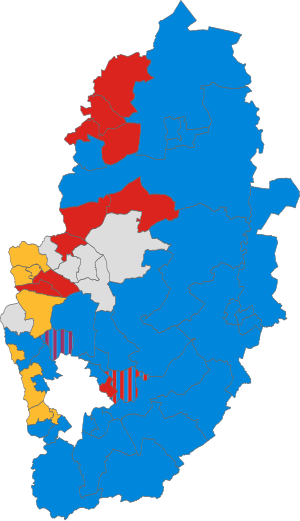 Map of the results of the election coloured by victorious party | ||||||||||||||||||||||||||||||||||||||||||||||||||||||
| ||||||||||||||||||||||||||||||||||||||||||||||||||||||
In the previous election, held on 5 May 2005, the Labour Party won a majority with 36 out of 67 seats. The Conservative Party were second with 26 seats, and the Liberal Democrats had five.[1] Following the 2005 election, there were three by-elections, which all saw swings against Labour. The Conservatives gained Hucknall and the Liberal Democrats Sutton-in-Ashfield North from Labour, and the Labour Party's majority in Mansfield East was reduced by nearly two-thirds.[2]
Campaign edit
A key local issue was the planned extension of the Nottingham Express Transit tram system to Clifton and Toton, which was opposed by the Conservatives.[3]
Results by District edit
Nottinghamshire County Council is made up of 67 seats in a total of 54 electoral divisions across 7 districts: Ashfield District, Bassetlaw District, Broxtowe Borough, Gedling Borough, Mansfield District, Newark & Sherwood District, and Rushcliffe Borough.[4]
Ashfield District edit
(10 seats, 8 electoral divisions)
Hucknall edit
| Party | Candidate | Votes | % | |
|---|---|---|---|---|
| Conservative | Mick Murphy | 2,690 | 11.06 | |
| UKIP | Tom Irvine | 2,541 | 10.45 | |
| Conservative | Kevin Thomas Rostance | 2,519 | 10.36 | |
| Conservative | Robert Rankin | 2,498 | 10.27 | |
| Labour | Chris Baron | 2,393 | 9.84 | |
| Labour | Dave Shaw | 2,258 | 9.29 | |
| Labour | Trev Locke | 2,213 | 9.10 | |
| UKIP | Kenneth Browne | 1,204 | 4.95 | |
| UKIP | Mark Brinsley-Day | 1,202 | 4.94 | |
| Liberal Democrats | Kevin Moore | 1,125 | 4.63 | |
| Liberal Democrats | Harry Toseland | 1,058 | 4.35 | |
| BNP | Susan Carolyn Gamble | 905 | 3.72 | |
| Liberal Democrats | Austin Rathe | 881 | 3.62 | |
| English Democrat | Kevin Michael Worrall | 602 | 2.48 | |
| Independent | Geoff Thorpe | 223 | 0.92 | |
| Turnout | 8,104 | 34.07 | ||
Kirkby in Ashfield North edit
| Party | Candidate | Votes | % | |
|---|---|---|---|---|
| Labour | John Russell Knight | 842 | 26.38 | |
| BNP | Michael John Clarke | 722 | 22.62 | |
| Independent | Wendy Brenda Harvey | 597 | 18.70 | |
| Conservative | James Grant Thornton | 445 | 13.94 | |
| Liberal Democrats | Melvin William Grant | 412 | 12.91 | |
| Independent | Dave Spalding | 174 | 5.45 | |
| Turnout | 3,192 | 31.27 | ||
Kirkby in Ashfield South edit
| Party | Candidate | Votes | % | |
|---|---|---|---|---|
| Liberal Democrats | Rachel Elisabeth Madden | 1,752 | 39.29 | |
| Labour | Yvonne Davidson | 868 | 19.47 | |
| Conservative | Robert Copley | 614 | 13.77 | |
| BNP | Darran Paul Burke | 482 | 10.81 | |
| English Democrat | Tony Ellis | 295 | 6.62 | |
| Green | Lisa Jane Brown | 257 | 5.76 | |
| Independent | Tony Brown | 191 | 4.28 | |
| Turnout | 4,459 | 40.39 | ||
Selston edit
| Party | Candidate | Votes | % | |
|---|---|---|---|---|
| Independent | Gail Turner | 1,593 | 36.68 | |
| Liberal Democrats | Robert James Sears-Piccavey | 1,037 | 23.88 | |
| BNP | Edward Holmes | 734 | 16.90 | |
| Labour | Stephen John Mays | 557 | 12.83 | |
| Conservative | Brian William Jarvis | 343 | 7.90 | |
| Green | Kevin Bradford | 79 | 1.82 | |
| Turnout | 4,343 | 43.40 | ||
Sutton in Ashfield Central edit
| Party | Candidate | Votes | % | |
|---|---|---|---|---|
| Liberal Democrats | Michelle Gent | 801 | 29.64 | |
| Labour | Edward David Walter Llewellyn-Jones | 696 | 25.76 | |
| Conservative | Christine Margaret Vernon | 384 | 14.21 | |
| BNP | Jane Helen Clarke | 347 | 12.84 | |
| Independent | Leslie Matthews | 276 | 10.21 | |
| Independent | Tony Johnson | 198 | 7.33 | |
| Turnout | 2,702 | 31.26 | ||
Sutton in Ashfield East edit
| Party | Candidate | Votes | % | |
|---|---|---|---|---|
| Labour | Steven Terence Carroll | 772 | 27.32 | |
| Liberal Democrats | Philip Ashley Smith | 628 | 22.22 | |
| Conservative | John Matson Baker | 426 | 15.07 | |
| Independent | Tony Wallis | 401 | 14.19 | |
| Independent | David Michael Parker | 300 | 10.62 | |
| BNP | Paul Jeffrey Gamble | 299 | 10.58 | |
| Turnout | 2,826 | 32.05 | ||
Sutton in Ashfield North edit
| Party | Candidate | Votes | % | |
|---|---|---|---|---|
| Liberal Democrats | Jason Bernard Zadrozny | 1,038 | 35.40 | |
| Labour | Trish Phillips | 738 | 25.17 | |
| Conservative | Michael Peter Laing Halls | 562 | 19.17 | |
| BNP | Michael John Clarke | 418 | 14.26 | |
| Turnout | 2,932 | 34.32 | ||
Sutton in Ashfield West edit
| Party | Candidate | Votes | % | |
|---|---|---|---|---|
| Liberal Democrats | Fiona Asbury | 1,066 | 36.48 | |
| Labour | David John Kirkham | 758 | 25.94 | |
| Conservative | Michael Maurice Champion | 522 | 17.86 | |
| BNP | Hilda Holmes | 382 | 13.07 | |
| Turnout | 2,922 | 32.98 | ||
Bassetlaw District edit
(9 seats, 9 electoral divisions)
Blyth & Harworth edit
| Party | Candidate | Votes | % | |
|---|---|---|---|---|
| Labour | Sheila Janice Place | 1,663 | 52.71 | |
| Conservative | Chris Wanless | 1,492 | 47.29 | |
| Turnout | 3,226 | 34.13 | ||
Misterton edit
| Party | Candidate | Votes | % | |
|---|---|---|---|---|
| Conservative | Liz Yates | 3,321 | 76.45 | |
| Labour | David Challinor | 1,023 | 23.55 | |
| Turnout | 4,477 | 42.52 | ||
Retford East edit
| Party | Candidate | Votes | % | |
|---|---|---|---|---|
| Conservative | Wendy Quigley | 1,933 | 62.05 | |
| Labour | Mick Storey | 1,182 | 37.95 | |
| Turnout | 3,182 | 37.30 | ||
Retford West edit
| Party | Candidate | Votes | % | |
|---|---|---|---|---|
| Conservative | Mike Quigley | 1,305 | 46.26 | |
| Labour | James Trebor Arthur Napier | 942 | 33.39 | |
| Liberal Democrats | David Anthony Hassett | 574 | 20.35 | |
| Turnout | 2,853 | 34.25 | ||
Tuxford edit
| Party | Candidate | Votes | % | |
|---|---|---|---|---|
| Conservative | John Marshall Hempsall | 2,511 | 61.02 | |
| Liberal Democrats | Brian Sydney Cane | 910 | 22.11 | |
| Labour | Marilyn McCarthy | 694 | 16.87 | |
| Turnout | 4,179 | 44.95 | ||
Worksop East edit
| Party | Candidate | Votes | % | |
|---|---|---|---|---|
| Labour | Glynn Gilfoyle | 1,525 | 54.19 | |
| Independent | Geoff Coe | 762 | 27.08 | |
| Conservative | Tracey Lee Taylor | 527 | 18.73 | |
| Turnout | 2,871 | 30.64 | ||
Worksop North edit
| Party | Candidate | Votes | % | |
|---|---|---|---|---|
| Labour | Sybil Jacqueline Fielding | 1,711 | 54.54 | |
| Conservative | Jonathan Neil Sheppard | 1,426 | 45.46 | |
| Turnout | 3,228 | 31.38 | ||
Worksop North East & Carlton edit
| Party | Candidate | Votes | % | |
|---|---|---|---|---|
| Labour | Alan Rhodes | 1,669 | 51.07 | |
| Conservative | Bill Graham | 1,599 | 48.93 | |
| Turnout | 3,362 | 36.26 | ||
Worksop West edit
| Party | Candidate | Votes | % | |
|---|---|---|---|---|
| Conservative | Michael Bennett | 1,403 | 50.81 | |
| Labour | David Daniel Potts | 909 | 32.92 | |
| Liberal Democrats | Mark Peter Hunter | 449 | 16.26 | |
| Turnout | 2,789 | 33.27 | ||
Broxtowe Borough edit
(10 seats, 8 electoral divisions)
Beauvale edit
| Party | Candidate | Votes | % | |
|---|---|---|---|---|
| Conservative | David Taylor | 1,532 | 43.31 | |
| BNP | Dave Brown | 698 | 19.73 | |
| Liberal Democrats | Bob Charlesworth | 657 | 18.58 | |
| Labour | Jen Cole | 650 | 18.38 | |
| Turnout | 3,554 | 43.56 | ||
Beeston North edit
| Party | Candidate | Votes | % | |
|---|---|---|---|---|
| Liberal Democrats | Steve Carr | 2,026 | 53.12 | |
| Conservative | Philip Hopkinson | 905 | 23.73 | |
| Labour | Kate Foale | 549 | 14.39 | |
| Green | Paul David Anderson | 334 | 8.76 | |
| Turnout | 3,833 | 48.54 | ||
Beeston South & Attenborough edit
| Party | Candidate | Votes | % | |
|---|---|---|---|---|
| Conservative | Eric Kerry | 1,889 | 41.02 | |
| Labour | Pat Lally | 1,700 | 36.92 | |
| Liberal Democrats | Graham Morley Hopcroft | 432 | 9.38 | |
| Green | Sylvia Anne Rule | 306 | 6.64 | |
| BNP | Wayne Shelbourn | 278 | 6.04 | |
| Turnout | 4,619 | 51.16 | ||
Bramcote & Stapleford edit
| Party | Candidate | Votes | % | |
|---|---|---|---|---|
| Liberal Democrats | Stan Heptinstall | 3,281 | 21.03 | |
| Liberal Democrats | Brian Wombwell | 3,095 | 19.84 | |
| Conservative | John Doddy | 2,528 | 16.21 | |
| Conservative | Philip Brooks-Stephenson | 2,245 | 14.39 | |
| Labour | John William McGrath | 1,418 | 9.09 | |
| Labour | Geoff Ward | 1,119 | 7.17 | |
| UKIP | Chris Cobb | 1,013 | 6.49 | |
| Green | Emma Kathryn Fawcett | 507 | 3.25 | |
| Green | Mary Evelyn Venning | 394 | 2.53 | |
| Turnout | 7,814 | 45.49 | ||
Chilwell & Toton edit
| Party | Candidate | Votes | % | |
|---|---|---|---|---|
| Conservative | Tom Pettengell | 3,388 | 24.40 | |
| Conservative | Richard Ian Jackson | 3,356 | 24.17 | |
| Labour | Ed Jacobs | 1,442 | 10.39 | |
| Labour | Atul Joshi | 1,135 | 8.17 | |
| Liberal Democrats | Dave Pearson | 1,076 | 7.75 | |
| Liberal Democrats | Christine Wombwell | 998 | 7.19 | |
| UKIP | Keith Willoughby Marriott | 786 | 5.66 | |
| Green | Richard David Eddleston | 658 | 4.74 | |
| BNP | Mary Clifton | 546 | 3.93 | |
| Green | David Knight Mitchell | 500 | 3.60 | |
| Turnout | 6,769 | 42.60 | ||
Eastwood edit
| Party | Candidate | Votes | % | |
|---|---|---|---|---|
| Liberal Democrats | Keith Longdon | 1,539 | 49.66 | |
| Labour | Milan Radulovic | 888 | 28.65 | |
| Conservative | Graham Kilbourne | 672 | 21.68 | |
| Turnout | 3,151 | 38.26 | ||
Kimberley & Trowell edit
| Party | Candidate | Votes | % | |
|---|---|---|---|---|
| Liberal Democrats | Ken Rigby | 1,585 | 36.29 | |
| Conservative | Shane Easom | 1,342 | 30.73 | |
| Labour | Richard Robinson | 912 | 20.88 | |
| BNP | Kevin Lambert | 402 | 9.21 | |
| Green | Gordon Brian Stoner | 126 | 2.89 | |
| Turnout | 4,377 | 49.01 | ||
Nuthall edit
| Party | Candidate | Votes | % | |
|---|---|---|---|---|
| Conservative | Philip John Owen | 1,752 | 50.16 | |
| Independent | Sue Wildey | 1,741 | 49.84 | |
| Turnout | 3,526 | 45.33 | ||
Gedling Borough edit
(10 seats, 6 electoral divisions)
Arnold North edit
| Party | Candidate | Votes | % | |
|---|---|---|---|---|
| Conservative | Gerald Vincent Clarke | 3,343 | 25.50 | |
| Conservative | Veronica Caroline Pepper | 3,255 | 24.83 | |
| Labour | Pauline Annette Allan | 1,995 | 15.22 | |
| Labour | John Robert Stocks | 1,805 | 13.77 | |
| Liberal Democrats | Sandra Yvonne Thornley | 1,361 | 10.38 | |
| Liberal Democrats | Roger Mark Patterson | 1,352 | 10.31 | |
| Turnout | 6,869 | 37.09 | ||
Arnold South edit
| Party | Candidate | Votes | % | |
|---|---|---|---|---|
| Conservative | Rodney Gordon Kempster | 3,257 | 22.28 | |
| Conservative | Melvyn Alfred Shepherd | 2,948 | 20.17 | |
| Labour | Peter Graham Barnes | 2,210 | 15.12 | |
| Labour | Paul Richard Key | 2,044 | 13.98 | |
| Liberal Democrats | Andrew Julian Swift | 1,521 | 10.41 | |
| Liberal Democrats | Tadeusz Edward Zdzislaw Jones | 1,502 | 10.28 | |
| UKIP | Anthony Robin Ellwood | 1,135 | 7.76 | |
| Turnout | 7,793 | 41.98 | ||
Calverton edit
| Party | Candidate | Votes | % | |
|---|---|---|---|---|
| Conservative | Mark Spencer (British politician) | 2,229 | 70.47 | |
| Labour | Michael John Hope | 934 | 29.53 | |
| Turnout | 3,236 | 40.70 | ||
Carlton East edit
| Party | Candidate | Votes | % | |
|---|---|---|---|---|
| Labour | William John Clarke | 2,165 | 16.03 | |
| Conservative | Allen Malpass Clarke | 2,144 | 15.87 | |
| Labour | James O'Riordan | 2,099 | 15.54 | |
| Conservative | Cheryl Beverly Clarke | 2,035 | 15.06 | |
| Liberal Democrats | Richard James Dawson Berry | 1,960 | 14.51 | |
| Liberal Democrats | Richard Ian MacDuff Fife | 1,811 | 13.41 | |
| BNP | Stephen Arthur Adcock | 739 | 5.47 | |
| Green | Jean Katimertzis | 556 | 4.12 | |
| Turnout | 7,106 | 41.11 | ||
Carlton West edit
| Party | Candidate | Votes | % | |
|---|---|---|---|---|
| Labour | Seamus Martin Creamer | 2,191 | 16.76 | |
| Labour | Darrell Eduard Pulk | 2,152 | 16.47 | |
| Conservative | Thomas Lewis Butcher | 2,030 | 15.53 | |
| Conservative | Eric John Collin | 2,025 | 15.49 | |
| Liberal Democrats | Paul Anthony Hughes | 1,072 | 8.20 | |
| Liberal Democrats | Christopher Norman Fredrick William Pratt | 994 | 7.61 | |
| UKIP | Deva Indera Asanga Kumarasiri | 974 | 7.45 | |
| UKIP | Anthony Jeffrey Prior | 971 | 7.43 | |
| BNP | William Christopher Bell | 660 | 5.05 | |
| Turnout | 6,784 | 38.81 | ||
Newstead edit
| Party | Candidate | Votes | % | |
|---|---|---|---|---|
| Conservative | Christopher Paul Barnfather | 2,454 | 73.85 | |
| Labour | Carol Ann Wright | 869 | 26.15 | |
| Turnout | 3,323 | 42.95 | ||
Mansfield District edit
(9 seats, 5 electoral divisions)
Mansfield East edit
| Party | Candidate | Votes | % | |
|---|---|---|---|---|
| Mansfield Independent Forum | Bob Cross | 1,891 | 19.60 | |
| Mansfield Independent Forum | Martin Wright | 1,883 | 19.52 | |
| Labour | Helen Holt | 1,629 | 16.89 | |
| Conservative | Brian Marshall | 1,558 | 16.15 | |
| Labour | Chris Winterton | 1,423 | 14.75 | |
| Conservative | Muriel Ragis | 1,262 | 13.08 | |
| Turnout | 5,677 | 31.34 | ||
Mansfield North edit
| Party | Candidate | Votes | % | |
|---|---|---|---|---|
| Labour | Joyce Bosnjak | 1,758 | 15.93 | |
| Labour | Parry Tsimbiridis | 1,494 | 13.54 | |
| UKIP | Andrea Hamilton | 1,335 | 12.10 | |
| UKIP | David Hamilton | 1,328 | 12.04 | |
| Mansfield Independent Forum | Mick Barton | 1,033 | 9.36 | |
| Conservative | Drew Stafford | 1,007 | 9.13 | |
| Conservative | Janet Susan Ward | 908 | 8.23 | |
| Mansfield Independent Forum | David Smith | 764 | 6.92 | |
| Liberal Democrats | Veronica Moya Goddard | 756 | 6.85 | |
| Liberal Democrats | Marc Hollingworth | 651 | 5.90 | |
| Turnout | 5,787 | 32.19 | ||
Mansfield South edit
| Party | Candidate | Votes | % | |
|---|---|---|---|---|
| Mansfield Independent Forum | Tom Appleby | 2,043 | 17.74 | |
| Mansfield Independent Forum | Stephen Neil Garner | 1,960 | 17.02 | |
| Conservative | Nick Bennett | 1,791 | 15.55 | |
| Conservative | Philip Keith Smith | 1,483 | 12.88 | |
| Labour | Albert Haynes | 1,259 | 10.93 | |
| Labour | David Charles Harrison | 1,187 | 10.31 | |
| Liberal Democrats | Adrian Mark Bacon | 698 | 6.06 | |
| Liberal Democrats | Kristyna Adela Ellis | 610 | 5.30 | |
| English Democrat | Diane Bilgrami | 487 | 4.23 | |
| Turnout | 6,121 | 32.02 | ||
Mansfield West edit
| Party | Candidate | Votes | % | |
|---|---|---|---|---|
| Mansfield Independent Forum | June Stendall | 2,034 | 21.12 | |
| Mansfield Independent Forum | Vic Bobo | 1,675 | 17.40 | |
| Labour | Paul Henshaw | 1,520 | 15.79 | |
| Labour | John Carter | 1,511 | 15.69 | |
| Conservative | Mark Stuart Fretwell | 889 | 9.23 | |
| Conservative | Fraser McFarland | 716 | 7.44 | |
| Liberal Democrats | Anna Ellis | 653 | 6.78 | |
| Liberal Democrats | Nicholas Spencer | 631 | 6.55 | |
| Turnout | 5,141 | 30.21 | ||
Warsop edit
| Party | Candidate | Votes | % | |
|---|---|---|---|---|
| Labour | John Allin | 1,371 | 48.50 | |
| Mansfield Independent Forum | John Milnes | 677 | 23.95 | |
| Conservative | Michael William Ward | 583 | 20.62 | |
| Liberal Democrats | Victoria Tracey Zadrozny | 196 | 6.93 | |
| Turnout | 2,846 | 30.62 | ||
Newark & Sherwood District edit
(10 seats, 10 electoral divisions)
Balderton edit
| Party | Candidate | Votes | % | |
|---|---|---|---|---|
| Conservative | Keith Walker | 1,401 | 59.11 | |
| Liberal Democrats | Neil Allen | 559 | 23.59 | |
| Labour | Carola Richards | 410 | 17.30 | |
| Turnout | 2,399 | 31.37 | ||
Blidworth edit
| Party | Candidate | Votes | % | |
|---|---|---|---|---|
| Independent | Geoff Merry | 852 | 34.68 | |
| Labour | Yvonne Woodhead | 802 | 32.64 | |
| Conservative | Rod Allen | 496 | 20.19 | |
| Independent | Kevan Wakefield | 307 | 12.49 | |
| Turnout | 2,468 | 32.69 | ||
Collingham edit
| Party | Candidate | Votes | % | |
|---|---|---|---|---|
| Conservative | Vincent Henry Dobson | 2,160 | 61.98 | |
| Liberal Democrats | Marylyn Rayner | 1,325 | 38.02 | |
| Turnout | 3,550 | 36.70 | ||
Farndom & Muskham edit
| Party | Candidate | Votes | % | |
|---|---|---|---|---|
| Conservative | Sue Saddington | 2,178 | 68.86 | |
| Liberal Democrats | Antony Barson | 657 | 20.77 | |
| Labour | Brian James Howes | 328 | 10.37 | |
| Turnout | 3,183 | 47.61 | ||
Farnsfield & Lowdham edit
| Party | Candidate | Votes | % | |
|---|---|---|---|---|
| Conservative | Andy Stewart | 3,333 | 79.13 | |
| Labour | Celia Brooks | 879 | 20.87 | |
| Turnout | 4,302 | 50.06 | ||
Newark East edit
| Party | Candidate | Votes | % | |
|---|---|---|---|---|
| Conservative | Peter David Prebble | 1,267 | 51.63 | |
| Liberal Democrats | Chris Harrison | 746 | 30.40 | |
| Labour | John Bell | 441 | 17.97 | |
| Turnout | 2,483 | 31.52 | ||
Newark West edit
| Party | Candidate | Votes | % | |
|---|---|---|---|---|
| Conservative | Keith Frank Girling | 980 | 42.61 | |
| Independent | Gill Dawn | 483 | 21.00 | |
| Labour | Ian Wallace Campbell | 450 | 19.57 | |
| Liberal Democrats | Declan Patrick Logue | 387 | 16.83 | |
| Turnout | 2,313 | 32.16 | ||
Ollerton & Boughton edit
| Party | Candidate | Votes | % | |
|---|---|---|---|---|
| Labour | Stella Marie Smedley | 1,202 | 40.61 | |
| Conservative | Mary Brown | 1,042 | 35.20 | |
| Independent | Mick McLelland | 716 | 24.19 | |
| Turnout | 2,980 | 34.24 | ||
Rufford edit
| Party | Candidate | Votes | % | |
|---|---|---|---|---|
| Independent | Les Ward | 1,309 | 35.60 | |
| Conservative | Mike Butler | 1,259 | 34.24 | |
| Labour | Andrew Freeman | 1,109 | 30.16 | |
| Turnout | 3,718 | 37.07 | ||
Southwell & Caunton edit
| Party | Candidate | Votes | % | |
|---|---|---|---|---|
| Conservative | Bruce Laughton | 2,765 | 52.06 | |
| Liberal Democrats | Peter Richard Bloomfield Harris | 2,281 | 42.95 | |
| Labour | Glenn Bardill | 265 | 4.99 | |
| Turnout | 5,350 | 56.00 | ||
Rushcliffe Borough edit
(9 seats, 8 electoral divisions)
Bingham edit
| Party | Candidate | Votes | % | |
|---|---|---|---|---|
| Conservative | Martin William Suthers | 2,020 | 48.71 | |
| Liberal Democrats | George Davidson | 1,207 | 29.11 | |
| Independent | Terry Coleman | 510 | 12.30 | |
| Labour | Alan Richard Tiplady | 410 | 9.89 | |
| Turnout | 4,166 | 43.92 | ||
Cotgrave edit
| Party | Candidate | Votes | % | |
|---|---|---|---|---|
| Conservative | Richard Langton Butler | 1,807 | 53.05 | |
| Labour | Andrew William Clayworth | 522 | 15.33 | |
| Liberal Democrats | Diane Jean Rotherham | 387 | 11.36 | |
| UKIP | Rach Wolfe | 367 | 10.78 | |
| BNP | Tony Woodward | 323 | 9.48 | |
| Turnout | 3,420 | 40.21 | ||
Keyworth edit
| Party | Candidate | Votes | % | |
|---|---|---|---|---|
| Conservative | John Elliott Cottee | 2,484 | 56.11 | |
| Liberal Democrats | Debbie Boote | 1,313 | 29.66 | |
| Green | Tony Latham | 371 | 8.38 | |
| Labour | Richard Theodore Parry Crawley | 259 | 5.85 | |
| Turnout | 4,454 | 53.17 | ||
Radcliffe on Trent edit
| Party | Candidate | Votes | % | |
|---|---|---|---|---|
| Conservative | Kay Cutts | 2,724 | 58.77 | |
| Labour | Steve Collins | 784 | 16.91 | |
| Liberal Democrats | Susan Jennifer Hull | 613 | 13.23 | |
| Green | Andrew Peter Mattison | 514 | 11.09 | |
| Turnout | 4,665 | 48.33 | ||
Ruddington edit
| Party | Candidate | Votes | % | |
|---|---|---|---|---|
| Conservative | Reg Adair | 1,918 | 48.68 | |
| Liberal Democrats | Barbara Venes | 981 | 24.90 | |
| Labour | Ian Paul Wilson | 403 | 10.23 | |
| UKIP | Pete Wolfe | 398 | 10.10 | |
| Independent | David John Hall | 240 | 6.09 | |
| Turnout | 3,957 | 45.55 | ||
Soar Valley edit
| Party | Candidate | Votes | % | |
|---|---|---|---|---|
| Conservative | Lynn Sykes | 2,502 | 59.60 | |
| Liberal Democrats | Sheila Ann Gauld | 885 | 21.08 | |
| Labour | Paul David Morrissey | 811 | 19.32 | |
| Turnout | 4,262 | 45.82 | ||
West Bridgford Central & South edit
| Party | Candidate | Votes | % | |
|---|---|---|---|---|
| Conservative | Michael John Cox | 3,432 | 20.14 | |
| Conservative | Barrie Cooper | 3,401 | 19.96 | |
| Green | Sue Mallender | 1,787 | 10.49 | |
| Green | Richard Mallender | 1,616 | 9.48 | |
| Labour | Liz Plant | 1,578 | 9.26 | |
| Labour | Alistair MacInnes | 1,563 | 9.17 | |
| Liberal Democrats | Keith Michael Jamieson | 1,223 | 7.18 | |
| Liberal Democrats | Steve Travis | 1,217 | 7.14 | |
| UKIP | Matthew Eric Faithfull | 623 | 3.66 | |
| Turnout | 8,820 | 43.25 | ||
West Bridgford West edit
| Party | Candidate | Votes | % | |
|---|---|---|---|---|
| Conservative | Gordon Wheeler | 2,189 | 44.58 | |
| Liberal Democrats | Karrar Ahmad Khan | 1,597 | 32.53 | |
| Labour | Peter Joseph Vallelly | 545 | 11.10 | |
| Green | Simon Ronald Anthony | 311 | 6.33 | |
| English Democrat | Barrie Michael Worrall | 268 | 5.46 | |
| Turnout | 4,926 | 50.31 | ||
By-Elections between June 2009 – April 2013 edit
By-elections are called when a representative Councillor resigns or dies, so are unpredictable. A by-election is held to fill a political office that has become vacant between the scheduled elections.
1. Newark East - 17 September 2009
| Party | Candidate | Votes | % | ±% | |
|---|---|---|---|---|---|
| Conservative | Stuart Wallace | 517 | 45.2 | -6.4 | |
| Liberal Democrats | Chris Harrison | 322 | 28.1 | -2.3 | |
| Labour | Glenn Bardill | 198 | 17.3 | -0.7 | |
| UKIP | Terry Coleman | 107 | 9.4 | +9.4 | |
| Majority | 195 | 17.1 | |||
| Turnout | 1,144 | 15.6 | |||
| Conservative hold | Swing | ||||
2. Mansfield South - 25 February 2010
| Party | Candidate | Votes | % | ±% | |
|---|---|---|---|---|---|
| Labour | Chris Winterton | 1,342 | 33.5 | +13.4 | |
| Mansfield Independent Forum | Andrew Tristram | 1,108 | 27.6 | -12.7 | |
| Conservative | Drew Stafford | 774 | 19.3 | -9.2 | |
| UKIP | Nick Bennet | 489 | 12.2 | +12.2 | |
| Liberal Democrats | Danielle Gent | 295 | 7.4 | -3.8 | |
| Majority | 234 | 5.9 | |||
| Turnout | 4,008 | 20.9 | |||
| Labour gain from Independent | Swing | ||||
3. Worksop West - 16 September 2010
| Party | Candidate | Votes | % | ±% | |
|---|---|---|---|---|---|
| Labour | Kevin Maurizio Greaves | 1,457 | 61.5% | ||
| Conservative | Alec Thorpe | 755 | 31.9% | ||
| Liberal Democrats | Leon Maurice Duveen | 88 | 3.7% | ||
| Independent | Ronald Dawes | 56 | 2.4% | ||
| Independent | Terry George Coleman | 13 | 0.6% | ||
| Majority | 702 | ||||
| Turnout | 2,369 | ||||
| Labour gain from Conservative | Swing | ||||
4. Chilwell & Toton - 15 March 2012
| Party | Candidate | Votes | % | ±% | |
|---|---|---|---|---|---|
| Conservative | John Doddy | 1,958 | 47.7 | +5.9 | |
| Liberal Democrats | David Watts | 1,375 | 33.5 | +20.6 | |
| UKIP | Lee Waters | 682 | 16.6 | +7.0 | |
| Majority | 583 | 14.2 | |||
| Turnout | 4,102 | 25.6 | |||
| Conservative hold | Swing | ||||
5. Rufford - 20 September 2012
| Party | Candidate | Votes | % | ±% | |
|---|---|---|---|---|---|
| Labour | John Peck | 1,557 | 58.0 | +27.8 | |
| Conservative | Daniel Mottishaw | 660 | 24.6 | -9.7 | |
| Nottinghamshire Independents | Jim Gregson | 346 | 12.9 | -22.7 | |
| UKIP | Carole Terzza | 123 | 4.6 | +4.6 | |
| Majority | 897 | 33.4 | |||
| Turnout | 2,686 | 24.52 | |||
| Labour gain from Independent | Swing | ||||
References edit
- ^ Nottinghamshire County Council, 2005 Election Results
- ^ Battle for your vote starts in key marginals, Nottingham Evening Post, 2009-05-14
- ^ The day before Notts' election, Nottingham Evening Post, 2009-06-03
- ^ "Electoral Division results". Nottinghamshire County Council. Retrieved 6 November 2010.
- ^ "Newark East by-election result". Nottinghamshire County Council. 18 September 2009. Retrieved 25 September 2009.
- ^ a b "Mansfield South by-election result". Nottinghamshire County Council. 26 February 2010. Retrieved 26 February 2010.