2010 United States state legislative elections

Summary

The 2010 United States state legislative elections were held on November 2, 2010, halfway through President Barack Obama's first term in office. Elections were held for 88 legislative chambers, with all states but Louisiana, Mississippi, New Jersey, and Virginia holding elections in at least one house. Kansas and New Mexico held elections for their lower, but not upper houses. Four territorial chambers in three territories and the District of Columbia were up as well.

2010 United States state legislative elections

← 2009 November 2, 2010 2011 →

88 legislative chambers in 46 states
  Majority party Minority party Third party
 
Party Republican Democratic Coalition
Chambers before 37 61 1[b]
Chambers after 57 40 1[b]
Overall change Increase 20 Decrease 21[a] Steady

Map of upper house elections:
     Democrats retained control
     Republicans gained control      Republicans retained control
     Coalition retained control
     Non-partisan legislature
     No regularly-scheduled elections

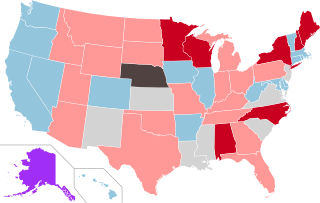
Map of lower house elections:
     Democrats retained control
     Republicans gained control      Republicans retained control
     Split body formed
     Non-partisan legislature
     No regularly-scheduled elections

Republicans scored record gains, gaining at least 680 total seats and taking control of 20 legislative chambers through election, while the Democrats lost 21 chambers.[1][2] The winners of this election cycle were slated to serve in their respective legislatures for either two or four-year terms, depending on state election rules.

Republicans made substantial gains in state legislatures across the nation. Twenty chambers flipped from Democratic to Republican control, giving Republicans full control of eleven state legislatures and control of one chamber in Colorado, Iowa, and New York.[3] Additionally, Republicans gained enough seats in the Oregon House of Representatives to produce a 30-30 party split, pushing Democrats into a power-sharing agreement that resulted in the election of two "co-speakers" (one from each party) to lead the chamber.[4] Republicans gained a total of 680 seats in state legislative races, breaking the previous record of 628 flipped seats set by Democrats in the post-Watergate elections of 1974.[5]

Six states saw both chambers switch from Democrat to Republican majorities: Alabama (where the Republicans won a majority and a trifecta for the first time since 1874), Maine (for the first time since 1964), Minnesota (for the first time since 1915 in partisan elections and 1973 in non-partisan elections), New Hampshire, North Carolina (for the first time since 1896), and Wisconsin. In addition, by picking up the lower chambers in Indiana, Ohio, Michigan, Montana[c] and Pennsylvania, Republicans gained control of both chambers in an additional five states. Further, Republicans picked up one chamber from Democrats in Colorado, Iowa, and New York to split control in those states. They expanded majorities in both chambers in Texas, Florida, and Georgia.[6][7] The Republican victories in legislative races gave the party unprecedented power over the redrawing of congressional and state legislative districts following the 2010 census.[8]

Summary table edit

Regularly-scheduled elections were held in 88 of the 99 state legislative chambers in the United States; nationwide, regularly-scheduled elections were held for 6,064 of the 7,383 legislative seats. Most legislative chambers held elections for all seats, but some legislative chambers that use staggered elections held elections for only a portion of the total seats in the chamber.[9] The chambers that were not up for election either hold regularly-scheduled elections in odd-numbered years, or have four-year terms and hold all regularly-scheduled elections in presidential election years.

Note that this table only covers regularly-scheduled elections; additional special elections took place concurrently with these regularly-scheduled elections.

State Upper House[9] Lower House[9]
Seats up Total % up Term Seats up Total % up Term
Alabama 35 35 100 4 105 105 100 4
Alaska 10 20 50 4 40 40 100 2
Arizona 30 30 100 2 60 60 100 2
Arkansas 18 35 51 2/4[d] 100 100 100 2
California 20 40 50 4 80 80 100 2
Colorado 17 35 49 4 65 65 100 2
Connecticut 36 36 100 2 151 151 100 2
Delaware 10 21 48 2/4[d] 41 41 100 2
Florida 20 40 50 2/4[d] 120 120 100 2
Georgia 56 56 100 2 180 180 100 2
Hawaii 12 25 48 2/4[d] 51 51 100 2
Idaho 35 35 100 2 70 70 100 2
Illinois 39 59 66 2/4[d] 118 118 100 2
Indiana 25 50 50 4 100 100 100 2
Iowa 25 50 50 4 100 100 100 2
Kansas 0 40 0 4 125 125 100 2
Kentucky 19 38 50 4 100 100 100 2
Louisiana 0 39 0 4 0 105 0 4
Maine 35 35 100 2 151 151 100 2
Maryland 47 47 100 4 141 141 100 4
Massachusetts 40 40 100 2 160 160 100 2
Michigan 38 38 100 4 110 110 100 2
Minnesota 67 67 100 2/4[d] 134 134 100 2
Mississippi 0 52 0 4 0 122 0 4
Missouri 17 34 50 4 163 163 100 2
Montana 25 50 50 4 100 100 100 2
Nebraska 24[e] 49[e] 49[e] 4 N/A (unicameral)
Nevada 11 21 52 4 42 42 100 2
New Hampshire 24 24 100 2 400 400 100 2
New Jersey 0 40 0 2/4[d] 0 80 0 2
New Mexico 0 42 100 4 70 70 100 2
New York 63 63 100 2 150 150 100 2
North Carolina 50 50 100 2 120 120 100 2
North Dakota 24 47 51 4 47 94 50 4
Ohio 16 33 52 4 99 99 100 2
Oklahoma 24 48 50 4 101 101 100 2
Oregon 15 30 50 4 60 60 100 2
Pennsylvania 25 50 50 4 203 203 100 2
Rhode Island 38 38 100 2 75 75 100 2
South Carolina 0 46 0 4 124 124 100 2
South Dakota 35 35 100 2 70 70 100 2
Tennessee 17 33 52 4 99 99 100 2
Texas 15 31 48 2/4[d] 150 150 100 2
Utah 14 29 48 4 75 75 100 2
Vermont 30 30 100 2 150 150 100 2
Virginia 0 40 0 4 0 100 0 2
Washington 25 49 49 4 98 98 100 2
West Virginia 17 34 50 4 100 100 100 2
Wisconsin 17 33 52 4 99 99 100 2
Wyoming 15 30 50 4 60 60 100 2
Total 1106 1972 56 N/A 4958 5411 92 N/A
 
State government trifectas after the 2010 gubernatorial and state legislative elections
     Democrats gained control
     Democrats retained control
     Split government formed
     Split government maintained
     Republicans retained control
     Republicans gained control

State Summaries edit

Alabama edit

All of the seats of the Alabama Legislature were up for election. Republicans won control of both state legislative chambers.

Alabama Senate
Party Before After Change
Republican 15 22   7
Democratic 20 12   8
Total 34 34
Alabama House of Representatives
Party Before After Change
Republican 45 62   17
Democratic 60 43   17
Total 105 105

Alaska edit

All of the seats of the Alaska House of Representatives and half of the Alaska Senate were up for election. Republicans maintained control of the Senate and the House retained coalition control.

Alaska Senate
Party Before After Change
Republican 4 10   6
Coalition 16 10   6
Total 20 20
Alaska House of Representatives
Party Before After Change
Republican 22 23   1
Democratic 18 17   1
Total 40 40

Arizona edit

All of the seats of the Arizona Legislature were up for election. Republicans maintained control of both state legislative chambers.

Arizona Senate
Party Before After Change
Republican 18 21   3
Democratic 12 9   3
Total 30 30
Arizona House of Representatives
Party Before After Change
Republican 36 40   4
Democratic 24 20   4
Total 60 60

Arkansas edit

All of the seats of the Arkansas House of Representatives and half of the Arkansas Senate were up for election. Democrats maintained control of both state legislative chambers.

Arkansas Senate
Party Before After Change
Republican 8 15   7
Democratic 27 20   7
Total 35 35
Arkansas House of Representatives
Party Before After Change
Republican 28 46   18
Democratic 72 54   18
Total 100 100

California edit

All of the seats of the California House of Representatives and half of the California Senate were up for election. Democrats maintained control of both state legislative chambers.

California State Senate
Party Before After Change
Democratic 26 26  
Republican 14 14  
Total 40 40
California State Assembly
Party Before After Change
Democratic 50 51   1
Republican 29 29  
Total 80 80

Colorado edit

All of the seats of the Colorado House of Representatives and half of the Colorado Senate were up for election. Republicans won control of the House and Democrats maintained control of the Senate.

Colorado Senate
Party Before After Change
Democratic 21 19   2
Republican 14 16   2
Total 35 35
Colorado House of Representatives
Party Before After Change
Democratic 37 33   4
Republican 27 32   5
Total 65 65

Connecticut edit

All of the seats of the Connecticut Legislature were up for election. Democrats maintained control of both state legislative chambers.

Connecticut State Senate
Party Before After Change
Democratic 24 23   1
Republican 12 13   1
Total 36 36
Connecticut House of Representatives
Party Before After Change
Democratic 114 97   17
Republican 37 54   17
Total 151 151

Delaware edit

All of the seats of the Delaware House of Representatives and half of the Delaware Senate were up for election. Democrats maintained control of both state legislative chambers.

Delaware Senate
Party Before After Change
Democratic 15 14   1
Republican 6 7   1
Total 21 21
Delaware House of Representatives
Party Before After Change
Democratic 24 26   2
Republican 17 15   2
Total 41 41

Florida edit

All of the seats of the Florida House of Representatives and half of the Florida Senate were up for election. Republicans maintained control of both state legislative chambers.


Florida Senate
Party Before After Change
Republican 26 28   2
Democratic 14 12   2
Total 40 40
Florida House of Representatives
Party Before After Change
Republican 76 81   5
Democratic 44 39   5
Total 120 120

Georgia edit

All of the seats of the Georgia Legislature were up for election. Republicans maintained control of both state legislative chambers.

Georgia State Senate
Party Before After Change
Republican 34 35   1
Democratic 22 21   1
Total 56 56
Georgia House of Representatives
Party Before After Change
Republican 103 111   8
Democratic 73 65   8
Total 180 180

Hawaii edit

All of the seats of the Hawaii House of Representatives and half of the Hawaii Senate were up for election. Democrats maintained control of both state legislative chambers.

Hawaii Senate
Party Before After Change
Democratic 23 24   1
Republican 2 1   1
Total 25 25
Hawaii House of Representatives
Party Before After Change
Democratic 45 43   2
Republican 6 8   2
Total 51 51

Idaho edit

All of the seats of the Idaho Legislature were up for election. Republicans maintained control of both state legislative chambers.

Idaho Senate
Party Before After Change
Republican 28 28  
Democratic 7 7  
Total 35 35
Idaho House of Representatives
Party Before After Change
Republican 52 57   5
Democratic 18 13   5
Total 70 70

Illinois edit

All of the seats of the Illinois House of Representatives and 2/3rds of the Illinois Senate were up for election. Democrats maintained control of both state legislative chambers.

Illinois Senate
Party Before After Change
Democratic 37 34   3
Republican 22 25   3
Total 59 59
Illinois House of Representatives
Party Before After Change
Democratic 70 64   6
Republican 48 54   6
Total 118 118

Indiana edit

All of the seats of the Indiana House of Representatives and half of the Indiana Senate were up for election. Republicans maintained control of the Senate and won control of the House of Representatives.

Indiana Senate
Party Before After Change
Republican 33 36   3
Democratic 17 14   3
Total 50 50
Indiana House of Representatives
Party Before After Change
Republican 48 60   12
Democratic 52 40   12
Total 100 100

Iowa edit

All of the seats of the Iowa House of Representatives and half of the Iowa Senate were up for election. Republicans won control of the House of Representatives and Democrats maintained control of the Senate.

Iowa Senate
Party Before After Change
Republican 18 23   5
Democratic 32 27   5
Total 50 50
Iowa House of Representatives
Party Before After Change
Republican 44 58   14
Democratic 56 42   14
Total 100 100

Kansas edit

All of the seats of the Kansas House of Representatives. Republicans maintained control of both state legislative chambers.

Kansas House of Representatives
Party Before After Change
Republican 77 92   15
Democratic 48 33   15
Total 125 125

Kentucky edit

All of the seats of the Kentucky House of Representatives and half of the Kentucky Senate were up for election. Republicans maintained control of the Senate and Democrats maintained control of the House of Representatives.

Kentucky Senate
Party Before After Change
Republican 21 23   2
Democratic 17 15   2
Total 38 38
Kentucky House of Representatives
Party Before After Change
Republican 35 42   7
Democratic 65 58   7
Total 100 100

Maine edit

All of the seats of the Maine Legislature were up for election. Republicans won control of both legislative chambers.

Maine Senate
Party Before After Change
Democratic 20 14   6
Republican 15 20   5
Total 35 35
Maine House of Representatives
Party Before After Change
Democratic 94 72   22
Republican 55 77   22
Independent 1 1  
Total 151 151

Maryland edit

All of the seats of the Maryland Legislature were up for election. Democrats maintained control of both state legislative chambers.

Maryland Senate
Party Before After Change
Democratic 33 35   2
Republican 14 12   2
Total 37 37
Maryland House of Delegates
Party Before After Change
Democratic 104 98   6
Republican 37 43   6
Total 141 141

Massachusetts edit

All of the seats of the Massachusetts Legislature were up for election. Democrats maintained control of both state legislative chambers.

Massachusetts Senate
Party Before After Change
Democratic 35 36   1
Republican 5 4   1
Total 40 40
Massachusetts House of Representatives
Party Before After Change
Democratic 145 130   15
Republican 15 30   15
Total 160 160

Michigan edit

All of the seats of the Michigan Legislature were up for election. Republicans won control of the House and maintained control of the Senate.

Michigan Senate
Party Before After Change
Republican 22 26   4
Democratic 16 12   4
Total 38 38
Michigan House of Representatives
Party Before After Change
Republican 42 63   21
Democratic 68 47   21
Total 110 110

Minnesota edit

All of the seats of the Minnesota Legislature were up. Republicans won control of both chambers.

Minnesota Senate
Party Before After Change
Democratic (DFL) 46 30   16
Republican 21 37   16
Total 67 67
Minnesota House of Representatives
Party Before After Change
Democratic (DFL) 87 62   25
Republican 47 72   25
Total 134 134

Missouri edit

All of the seats of the Missouri House of Representatives and half of the Missouri Senate were up for election. Republicans maintained control of both state legislative chambers.

Missouri Senate
Party Before After Change
Republican 23 22   1
Democratic 11 12   1
Total 34 34
Missouri House of Representatives
Party Before After Change
Republican 88 105   17
Democratic 75 58   17
Total 163 163

Montana edit

All of the seats of the Montana House of Representatives and half of the Montana Senate were up for election. Republicans won control of the House and maintained control of the Senate.

Montana Senate
Party Before After Change
Republican 28 28  
Democratic 22 22  
Total 50 50
Montana House of Representatives
Party Before After Change
Republican 50 67   17
Democratic 50 [f] 33   17
Total 100 100

Nebraska edit

Nebraska is the only U.S. state with a unicameral legislature; half of the seats of the Nebraska Legislature were up for election in 2014. Nebraska is also unique in that its legislature is officially non-partisan and holds non-partisan elections, although the Democratic and Republican parties each endorse legislative candidates. Republicans maintained control.

Nebraska Legislature
Party Before After Change
Republican 32 34   2
Democratic 17 15   2
Total 49 49

Nevada edit

All of the seats of the Nevada House of Representatives and half of the Nevada Senate were up for election. Democrats maintained control of both state legislative chambers.

Nevada Senate
Party Before After Change
Democratic 13 11   2
Republican 8 10   2
Total 21 21
Nevada Assembly
Party Before After Change
Democratic 28 26   2
Republican 14 16   2
Total 42 42

New Hampshire edit

All of the seats of the New Hampshire House of Representatives and half of the New Hampshire Senate were up for election. Republicans won control of both legislative chambers.

New Hampshire Senate
Party Before After Change
Republican 10 19   9
Democratic 14 5   9
Total 24 24
New Hampshire House of Representatives
Party Before After Change
Republican 174 298   124
Democratic 216 102   114
Total 400 400

New Mexico edit

All of the seats of the New Mexico House of Representatives. Democrats maintained control of the chamber.

New Mexico House of Representatives
Party Before After Change
Democratic 45 36   9
Republican 25 34   9
Total 70 70

New York edit

All of the seats of the New York Legislature were up for election. Republicans won control of the Senate, and Democrats maintained control of the Assembly.

New York State Senate
Party Before After Change
Democratic 32 30   2
Republican 30 32   2
Total 63 63
New York State Assembly
Party Before After Change
Democratic 105 99   6
Republican 43 50   7
Independent 2 1   1
Total 150 150

North Carolina edit

All of the seats of the North Carolina House of Representatives and half of the North Carolina Senate were up for election. Republicans won control of both state legislative chambers.

North Carolina Senate
Party Before After Change
Republican 20 30   10
Democratic 30 20   10
Total 50 50
North Carolina House of Representatives
Party Before After Change
Republican 52 67   15
Democratic 68 52   16
Total 120 120

North Dakota edit

All of the seats of the North Dakota House of Representatives and half of the North Dakota Senate were up for election. Republicans maintained control of both state legislative chambers.

North Dakota Senate
Party Before After Change
Republican 26 35   9
Democratic-NPL 21 12   9
Total 47 47
North Dakota House of Representatives
Party Before After Change
Republican 58 69   11
Democratic-NPL 36 25   11
Total 94 94

Ohio edit

All of the seats of the Ohio House of Representatives and half of the Ohio Senate were up for election. Republicans won control of the House of Repersentatives and maintained control of the Senate.

Ohio Senate
Party Before After Change
Republican 21 23   2
Democratic 12 10   2
Total 33 33
Ohio House of Representatives
Party Before After Change
Republican 46 58   12
Democratic 53 41   12
Total 99 99

Oklahoma edit

All of the seats of the Oklahoma House of Representatives and half of the Oklahoma Senate were up for election. Republicans maintained control of both state legislative chambers.

Oklahoma Senate
Party Before After Change
Republican 26 32   6
Democratic 22 16   6
Total 48 48
Oklahoma House of Representatives
Party Before After Change
Republican 62 69   7
Democratic 39 32   7
Total 101 101

Oregon edit

All of the seats of the Oregon House of Representatives and half of the Oregon Senate were up for election. Democrats maintained control of the Senate, and the House of Representatives became tied.

Oregon State Senate
Party Before After Change
Democratic 18 16   2
Republican 12 14   2
Total 30 30
Oregon House of Representatives
Party Before After Change
Democratic 36 30   6
Republican 24 30   6
Total 50 50

Pennsylvania edit

All of the seats of the Pennsylvania House of Representatives and half of the Pennsylvania Senate were up for election. Republicans maintained control of the Senate and won control of the House of Representatives.

Pennsylvania State Senate
Party Before After Change
Republican 30 30  
Democratic 20 20  
Total 50 50
Pennsylvania House of Representatives
Party Before After Change
Republican 99 112   13
Democratic 104 91   13
Total 203 203

Rhode Island edit

All of the seats of the Rhode Island Legislature were up for election. Democrats maintained control of both state legislative chambers.

Rhode Island Senate
Party Before After Change
Democratic 33 29   4
Republican 4 8   4
Total 38 38
Rhode Island House of Representatives
Party Before After Change
Democratic 69 66   3
Republican 6 9   3
Total 75 75

South Carolina edit

All of the seats of the South Carolina House of Representatives were up for election. Republicans maintained control of both state legislative chambers.

South Carolina House of Representatives
Party Before After Change
Republican 73 75   2
Democratic 51 49   2
Total 123 123

South Dakota edit

All of the seats of the South Dakota Legislature were up for election. Republicans maintained control of both state legislative chambers.

South Dakota Senate
Party Before After Change
Republican 21 30   9
Democratic 14 5   9
Total 35 35
South Dakota House of Representatives
Party Before After Change
Republican 46 50   4
Democratic 24 19   5
Total 70 70

Tennessee edit

All of the seats of the Tennessee House of Representatives and half of the Tennessee Senate were up for election. Republicans maintained control of both state legislative chambers.

Tennessee Senate
Party Before After Change
Republican 19 20   1
Democratic 14 13   1
Total 33 33
Tennessee House of Representatives
Party Before After Change
Republican 51 68   17
Democratic 48 31   17
Total 99 99

Texas edit

All of the seats of the Texas House of Representatives and half of the Texas Senate were up for election. Republicans maintained control of both state legislative chambers.

Texas Senate
Party Before After Change
Republican 19 19  
Democratic 12 12  
Total 31 31
Texas House of Representatives
Party Before After Change
Republican 77 98   21
Democratic 73 52   21
Total 150 150

Utah edit

All of the seats of the Utah House of Representatives and half of the Utah Senate were up for election. Republicans maintained control of both state legislative chambers.

Utah State Senate
Party Before After Change
Republican 21 22   1
Democratic 8 7   1
Total 29 29
Utah House of Representatives
Party Before After Change
Republican 53 59   6
Democratic 22 16   6
Total 75 75

Vermont edit

All of the seats of the Vermont Legislature were up for election. Democrats maintained control of both state legislative chambers.

Vermont Senate
Party Before After Change
Democratic 22 21   1
Republican 7 8   1
Progressive 1 1  
Total 30 30
Vermont House of Representatives
Party Before After Change
Democratic 94 94  
Republican 48 48  
Progressive 5 5  
Independent 3 3  
Total 150 150

Washington edit

All of the seats of the Washington House of Representatives and half of the Washington Senate were up for election. Democrats maintained control of both legislative chambers.

Washington State Senate
Party Before After Change
Democratic 31 27   4
Republican 18 22   4
Total 49 49
Washington House of Representatives
Party Before After Change
Democratic 61 55   6
Republican 37 43   6
Total 98 98

West Virginia edit

All of the seats of the West Virginia House of Delegates and half of the West Virginia Senate were up for election. Democrats maintained control of both state legislative chambers.

West Virginia Senate
Party Before After Change
Republican 8 7   1
Democratic 26 27   1
Total 34 34
West Virginia House of Delegates
Party Before After Change
Republican 29 35   6
Democratic 71 65   6
Total 100 100

Wisconsin edit

All of the seats of the Wisconsin Assembly and half of the Wisconsin Senate were up for election. Republicans won control of both state legislative chambers.

Wisconsin Senate
Party Before After Change
Republican 15 19   4
Democratic 18 14   4
Total 33 33
Wisconsin State Assembly
Party Before After Change
Republican 47 60   13
Democratic 50 38   12
Independent 2 1   1
Total 99 99

Wyoming edit

All of the seats of the Wyoming House of Representatives and half of the Wyoming Senate were up for election. Republicans maintained control of both state legislative chambers.

Wyoming Senate
Party Before After Change
Republican 23 26   3
Democratic 7 4   3
Total 30 30
Wyoming House of Representatives
Party Before After Change
Republican 41 51   10
Democratic 19 9   10
Total 60 60

Territorial and federal district summaries edit

American Samoa edit

All of the seats of the American Samoa Senate and the American Samoa House of Representatives were up for election. Members of the Senate serve four-year terms, while members of the House of Representatives serve two-year terms. Gubernatorial and legislative elections are conducted on a nonpartisan basis in American Samoa.

Guam edit

Guam Legislature
Party Before After Change
Democratic 9 9  
Republican 6 6  
Total 15 15

U.S. Virgin Islands edit

Virgin Islands Legislature
Party Before After Change
Democratic 10 10  
Independent 5 5  
Total 15 15

Washington, D.C. edit

District of Columbia Council
Party Before After Change
Democratic 11 11  
Independent 2 2  
Total 13 13

Notes edit

  1. ^ The Oregon House of Representatives was tied in the 2011-2013 session. This is not included in the total.
  2. ^ a b The Alaska Senate was controlled by a coalition of Democrats and Republicans. The minority caucus consists of Republicans who were not part of the majority coalition.
  3. ^ Prior to the 2010 election, the 100 seats in the Montana House of Representatives were evenly split between Democrats and Republicans, but the Democratic Party controlled the chamber by virtue of holding the governor's office.
  4. ^ a b c d e f g h The upper houses of Arkansas, Delaware, Florida, Hawaii, Illinois, Minnesota, New Jersey, and Texas use a 2-4-4 term length system.
  5. ^ a b c These figures represent the seats of Nebraska's unicameral legislature.
  6. ^ Prior to the 2010 election, the 100 seats in the Montana House of Representatives were evenly split between Democrats and Republicans, but the Democratic Party controlled the chamber by virtue of holding the governor's office.

References edit

  1. ^ Memoli, Michael A. (November 3, 2010). "State legislative gains give Republicans unprecedented clout to remake districts - Los Angeles Times". Articles.latimes.com. Retrieved June 4, 2013.
  2. ^ Balz, Dan (November 14, 2010). "The Republican takeover in the states". Washingtonpost.com. Retrieved June 4, 2013.
  3. ^ Storey, Tim. "GOP Makes Historic State Legislative Gains in 2010". Rasmussen Reports. Rasmussen Report, LLC. Retrieved 29 July 2014.
  4. ^ Cole, Michelle (Jan 11, 2011). "Oregon House makes history by electing two co-speakers". The Oregonian. Retrieved 29 July 2014.
  5. ^ "Devastation: GOP Picks Up 680 State Leg. Seats". November 4, 2010. Archived from the original on October 28, 2012. Retrieved November 4, 2010.
  6. ^ Taylor, Jessica (November 16, 2010). "Democrats' losses ran wide, deep". Politico. Retrieved February 29, 2024.
  7. ^ Daigneau, Elizabeth (2010-11-03). "2010 State Legislatures: GOP Chalks Up Historic Gains". Governing. Retrieved 2024-02-29.
  8. ^ Daley, David (2017). Ratf**ked. New York, NY: Liveright Publishing Corporation. pp. xi–xxviii. ISBN 978-1-63149-321-8.
  9. ^ a b c "2018 Legislative Races by State and Legislative Chamber". National Conference of State Legislatures.