


Summary
The 2011 Ontario general election was held on October 6, 2011, to elect members of the 40th Legislative Assembly of Ontario. The Ontario Liberal Party was elected to a minority government, with the Progressive Conservative Party of Ontario (PC Party) serving as the Official Opposition and the Ontario New Democratic Party (NDP) serving as the third party. In the final result, Premier McGuinty's party fell one seat short of winning a majority government.
| |||||||||||||||||||||||||||||||||||||||||||||||||
107 seats in the 40th Legislative Assembly of Ontario 54 seats needed for a majority | |||||||||||||||||||||||||||||||||||||||||||||||||
|---|---|---|---|---|---|---|---|---|---|---|---|---|---|---|---|---|---|---|---|---|---|---|---|---|---|---|---|---|---|---|---|---|---|---|---|---|---|---|---|---|---|---|---|---|---|---|---|---|---|
| Opinion polls | |||||||||||||||||||||||||||||||||||||||||||||||||
| Turnout | 48.2% ( | ||||||||||||||||||||||||||||||||||||||||||||||||
| |||||||||||||||||||||||||||||||||||||||||||||||||
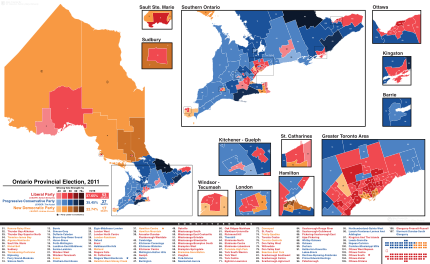 Popular vote by riding. As this is an FPTP election, seat totals are not determined by popular vote, but instead via results by each riding. Riding names are listed at the bottom. | |||||||||||||||||||||||||||||||||||||||||||||||||
| |||||||||||||||||||||||||||||||||||||||||||||||||


Under amendments passed by the Legislature in December 2005, Ontario elections were now held on fixed dates, namely the first Thursday of October every four years.[2] The writ of election was issued by Lieutenant Governor David Onley on September 7, 2011.
The election saw a then–record low voter turnout of 48.2%,[1] only to be surpassed by the 2022 Ontario general election with 43.53%.
Timeline edit
- 2007
- October 10, 2007: Elections held for members of the Ontario Legislature in the 39th Legislative Assembly of Ontario.
- November 29, 2007: The 39th Legislative Assembly of Ontario officially opens with the Speech from the Throne.
- 2008
- February 23, 2008: John Tory's continued leadership of the Progressive Conservative party is endorsed by 66.9% of delegates at a leadership review.
- June 14, 2008: Premier Dalton McGuinty receives the support of 95.4% of delegates from the Ontario Liberal Party's mandatory leadership review.
- June 14, 2008: NDP leader Howard Hampton announces he will be stepping down as party leader at the March 7, 2009 NDP leadership convention.
- 2009
- January 9, 2009: Progressive Conservative MPP Laurie Scott announces her resignation from the legislature to allow party leader John Tory, who has been without a seat since his defeat in Don Valley West in the 2007 election, to re-enter the legislature.
- March 5, 2009: In the Haliburton—Kawartha Lakes—Brock by-election following Scott's resignation, Tory is defeated by Liberal candidate Rick Johnson.
- March 6, 2009: John Tory resigns as Progressive Conservative leader pending the selection of an interim party leader.
- March 7, 2009: Andrea Horwath is elected leader of the Ontario NDP at the party's 2009 leadership convention.
- June 27, 2009: Tim Hudak is elected leader of the Progressive Conservative party at its 2009 leadership election and also becomes the new Leader of the Opposition.
- September 17, 2009: Eric Hoskins is elected as the MPP for the riding of St. Paul's following the resignation of Michael Bryant on June 7, 2009.
- November 4, 2009: Mike Schreiner is affirmed as the new leader of the Green Party of Ontario, receiving 97% approval from the party membership defeating the None of the Above ballot option, in the 2009 leadership election.
- 2010
- January 29, 2010: Bob Runciman resigns his seat to accept appointment to the Senate of Canada.
- February 1, 2010: Jim Watson resigns his seat to run for Mayor in the 2010 Ottawa municipal election
- February 4, 2010: Glen Murray is elected as the MPP for the riding of Toronto Centre following the resignation of George Smitherman on January 4, 2010.
- March 4, 2010: Bob Chiarelli is elected as the MPP for the riding of Ottawa West—Nepean and Steve Clark is elected as the MPP for the riding of Leeds—Grenville.
- December 16, 2010: Peter Fonseca resigned from cabinet to run for the federal Liberals in the riding of Mississauga East—Cooksville in the 2011 federal election.[3]
- 2011
- June 3, 2011: Essex MPP Bruce Crozier dies of an aortic aneurysm.[4]
- September 7, 2011: Official election call, Premier McGuinty formally asks the Lt. Governor to dissolve the legislature. The campaign will be 29 days long.
- September 21–30, 2011: Advance polling stations open for early voting from 10:00 a.m. until 8:00 p.m.[5]
- September 27, 2011: The televised Leaders debate aired on CBC, CHCH, CTV, Global, TVOntario and Sun News Network, with Liberal leader and Premier Dalton McGuinty, Progressive Conservative leader Tim Hudak and New Democratic Party leader Andrea Horwath.[6]
- October 6, 2011: Ontario general election from 9:00 a.m. until 9:00 p.m. EDT (8:00 a.m. to 8:00 p.m. CDT in north-western part of the province).
Party leadership edit
In March 2009, PC Party leader John Tory stepped down as leader, with Tim Hudak elected to be his successor. Also in March 2009, Andrea Horwath replaced Howard Hampton as leader of the NDP at the leadership election. Thus, both the Progressive Conservatives and the NDP went into the election with a new leader. Green Party of Ontario leader Frank de Jong stepped down in November 2009; their leadership convention confirmed Mike Schreiner as their new leader. Dalton McGuinty won 95 percent support for his leadership at an Ontario Liberal annual general meeting after the 2007 election, and ran again in 2011.
Incumbents not running for reelection edit
Results edit
| Party | Party leader | Candidates | Seats | Popular vote | ||||||
|---|---|---|---|---|---|---|---|---|---|---|
| 2007 | Dissol. | 2011 | Change | # | % | Change | ||||
| Liberal | Dalton McGuinty | 107 | 71 | 70 | 53 | 18 |
1,625,102 | 37.65% | 4.7% | |
| Progressive Conservative | Tim Hudak | 107 | 26 | 25 | 37 | 11 |
1,530,076 | 35.45% | 3.8% | |
| New Democratic | Andrea Horwath | 107 | 10 | 10 | 17 | 7 |
981,508 | 22.74% | 5.9% | |
| Green | Mike Schreiner | 107 | – | – | – | – | 126,021 | 2.92% | 5.1% | |
| Libertarian | Sam Apelbaum | 51 | – | – | – | – | 19,447 | 0.45% | 0.3% | |
| Family Coalition | Phil Lees | 31 | – | – | – | – | 9,524 | 0.22% | 0.6% | |
| Freedom | Paul McKeever | 57 | – | – | – | – | 9,253 | 0.21% | 0.1% | |
| Independent | 36 | – | – | – | – | 9,021 | 0.21% | – | ||
| Communist | Elizabeth Rowley | 9 | – | – | – | – | 1,162 | 0.03% | 0.01% | |
| Northern Ontario Heritage | Edward Deibel | 3 | – | – | – | – | 676 | 0.02% | – | |
| Special Needs | Danish Ahmed | 4 | – | – | – | – | 667 | 0.02% | 0.01% | |
| Reform | Bradley J. Harness | 4 | – | – | – | – | 647 | 0.01% | 0.01% | |
| Paramount Canadians | Ranvir Dogra | 4 | – | – | – | – | 562 | 0.01% | – | |
| Confederation of Regions | vacant | 3 | – | – | – | – | 559 | 0.01% | – | |
| Socialist | Michael Laxer | 5 | – | – | – | – | 519 | 0.01% | – | |
| People's Political Party | Kevin Clarke | 4 | – | – | – | – | 386 | – | – | |
| Vegan Environmental | Paul Figueiras | 3 | – | – | – | – | 366 | – | – | |
| Republican | Trueman Tuck | 3 | – | – | – | – | 232 | – | – | |
| The Only Party | Michael Green | 3 | – | – | – | – | 188 | – | – | |
| Human Rights | Marilyn McCormick | 2 | – | – | – | – | 170 | – | – | |
| Canadians' Choice | Bahman Yazdanfar | 3 | – | – | – | – | 156 | – | – | |
| Paupers | John Turmel | 2 | – | – | – | – | 140 | < .01% | – | |
| Vacant | 2 | |||||||||
| Total | 655 | 107 | 107 | 107 | 4,316,382 | 100% | ||||
| Source: "40TH GENERAL ELECTION - SUMMARY OF VALID BALLOTS CAST" (PDF). Elections Ontario. Archived from the original (PDF) on May 1, 2014. Retrieved May 17, 2014. | ||||||||||
Summary edit
| Party | 2007 | Gain from(loss to) | 2011 | |||
| Lib | PC | NDP | ||||
| Liberal | 71 | (11) | (7) | 53 | ||
| Progressive Conservative | 26 | 11 | 37 | |||
| New Democratic | 10 | 7 | 17 | |||
| Total | 107 | 18 | (11) | (7) | 107 | |
Regional analysis edit
| Party | Toronto | 905 Belt | Ham/Niagara | Central | East | Midwest | Southwest | North | Total | |
|---|---|---|---|---|---|---|---|---|---|---|
| Liberal | 17 | 14 | 3 | 1 | 7 | 3 | 4 | 4 | 53 | |
| Conservative | 3 | 3 | 10 | 7 | 8 | 4 | 2 | 37 | ||
| New Democratic | 5 | 1 | 4 | 2 | 5 | 17 | ||||
| Total | 22 | 18 | 10 | 11 | 14 | 11 | 10 | 11 | 107 | |
Synopsis of results edit
| Riding | 2007 | Winning party | Turnout [a 2] |
Votes[a 3] | ||||||||||||||
|---|---|---|---|---|---|---|---|---|---|---|---|---|---|---|---|---|---|---|
| Party | Votes | Share | Margin # |
Margin % |
Lib | PC | NDP | Green | Ind | Other | Total | |||||||
| Ajax—Pickering | Lib | Lib | 19,606 | 47.34% | 4,888 | 11.80% | 44.84% | 19,606 | 14,718 | 5,952 | 843 | – | 299 | 41,418 | ||||
| Algoma—Manitoulin | Lib | NDP | 11,585 | 44.52% | 4,188 | 16.09% | 49.43% | 7,397 | 6,141 | 11,585 | 684 | – | 217 | 26,024 | ||||
| Ancaster—Dundas—Flamborough—Westdale | Lib | Lib | 21,648 | 43.70% | 4,516 | 9.12% | 56.45% | 21,648 | 17,132 | 8,521 | 1,477 | – | 765 | 49,543 | ||||
| Barrie | Lib | PC | 17,527 | 40.66% | 2,521 | 5.85% | 46.00% | 15,006 | 17,527 | 8,171 | 1,909 | – | 497 | 43,110 | ||||
| Beaches—East York | NDP | NDP | 17,925 | 46.82% | 4,112 | 10.74% | 51.64% | 13,813 | 5,333 | 17,925 | 1,025 | – | 189 | 38,285 | ||||
| Bramalea—Gore—Malton | Lib | NDP | 16,626 | 38.16% | 2,277 | 5.23% | 40.71% | 14,349 | 9,896 | 16,626 | 1,091 | 491 | 1,119 | 43,572 | ||||
| Brampton—Springdale | Lib | Lib | 15,663 | 44.43% | 2,909 | 8.25% | 40.54% | 15,663 | 12,754 | 5,378 | 900 | – | 562 | 35,257 | ||||
| Brampton West | Lib | Lib | 19,224 | 43.76% | 4,790 | 10.90% | 38.29% | 19,224 | 14,434 | 8,331 | 1,432 | – | 509 | 43,930 | ||||
| Brant | Lib | Lib | 16,867 | 37.08% | 1,106 | 2.43% | 48.23% | 16,867 | 15,761 | 11,006 | 957 | 244 | 649 | 45,484 | ||||
| Bruce—Grey—Owen Sound | PC | PC | 19,567 | 47.37% | 8,678 | 21.01% | 54.70% | 10,889 | 19,567 | 6,133 | 2,654 | 1,478 | 585 | 41,306 | ||||
| Burlington | PC | PC | 20,061 | 40.41% | 2,152 | 4.33% | 54.83% | 17,909 | 20,061 | 9,370 | 1,129 | – | 1,175 | 49,644 | ||||
| Cambridge | PC | PC | 15,947 | 37.69% | 1,954 | 4.62% | 46.04% | 13,993 | 15,947 | 10,414 | 1,056 | 271 | 629 | 42,310 | ||||
| Carleton—Mississippi Mills | PC | PC | 28,246 | 50.29% | 9,102 | 16.21% | 53.50% | 19,144 | 28,246 | 6,371 | 1,857 | – | 549 | 56,167 | ||||
| Chatham-Kent—Essex | Lib | PC | 15,121 | 41.78% | 3,490 | 9.64% | 49.41% | 11,631 | 15,121 | 8,415 | 1,027 | – | – | 36,194 | ||||
| Davenport | Lib | NDP | 14,367 | 45.93% | 1,414 | 4.52% | 45.59% | 12,953 | 2,480 | 14,367 | 855 | 250 | 374 | 31,279 | ||||
| Don Valley East | Lib | Lib | 16,350 | 51.08% | 7,645 | 23.88% | 46.08% | 16,350 | 8,705 | 5,953 | 702 | – | 300 | 32,010 | ||||
| Don Valley West | Lib | Lib | 24,444 | 58.32% | 11,617 | 27.71% | 50.93% | 24,444 | 12,827 | 3,621 | 718 | – | 307 | 41,917 | ||||
| Dufferin—Caledon | PC | PC | 17,833 | 46.95% | 7,671 | 20.19% | 47.74% | 10,162 | 17,833 | 4,200 | 5,540 | – | 250 | 37,985 | ||||
| Durham | PC | PC | 22,393 | 49.07% | 8,999 | 19.72% | 49.74% | 13,394 | 22,393 | 8,027 | 1,221 | – | 596 | 45,631 | ||||
| Eglinton—Lawrence | Lib | Lib | 20,752 | 54.15% | 7,895 | 20.60% | 51.81% | 20,752 | 12,857 | 3,763 | 575 | 146 | 231 | 38,324 | ||||
| Elgin—Middlesex—London | Lib | PC | 19,771 | 47.86% | 8,696 | 21.05% | 51.28% | 11,075 | 19,771 | 9,201 | 981 | – | 283 | 41,311 | ||||
| Essex | Lib | NDP | 17,417 | 37.99% | 1,368 | 2.98% | 51.38% | 11,518 | 16,049 | 17,417 | 860 | – | – | 45,844 | ||||
| Etobicoke Centre | Lib | Lib | 21,916 | 51.48% | 7,960 | 18.70% | 52.62% | 21,916 | 13,956 | 5,099 | 837 | – | 761 | 42,569 | ||||
| Etobicoke—Lakeshore | Lib | Lib | 22,169 | 51.02% | 9,464 | 21.78% | 50.01% | 22,169 | 12,705 | 6,713 | 1,164 | 226 | 471 | 43,448 | ||||
| Etobicoke North | Lib | Lib | 12,081 | 48.46% | 6,009 | 24.10% | 40.15% | 12,081 | 6,072 | 5,426 | 541 | – | 811 | 24,931 | ||||
| Glengarry—Prescott—Russell | Lib | Lib | 17,345 | 43.18% | 1,372 | 3.42% | 47.81% | 17,345 | 15,973 | 5,721 | 770 | – | 363 | 40,172 | ||||
| Guelph | Lib | Lib | 19,815 | 42.43% | 7,861 | 16.83% | 50.27% | 19,815 | 11,954 | 11,150 | 3,234 | 100 | 444 | 46,697 | ||||
| Haldimand—Norfolk | PC | PC | 25,203 | 60.81% | 17,155 | 41.39% | 53.31% | 7,087 | 25,203 | 8,048 | 868 | – | 242 | 41,448 | ||||
| Haliburton—Kawartha Lakes—Brock | PC | PC | 22,352 | 45.43% | 5,830 | 11.85% | 54.98% | 16,522 | 22,352 | 8,517 | 1,562 | – | 245 | 49,198 | ||||
| Halton | PC | PC | 26,228 | 44.47% | 3,148 | 5.34% | 45.99% | 23,080 | 26,228 | 7,757 | 1,286 | 166 | 464 | 58,981 | ||||
| Hamilton Centre | NDP | NDP | 20,586 | 61.33% | 14,725 | 43.87% | 42.43% | 5,861 | 4,421 | 20,586 | 1,249 | 268 | 1,182 | 33,567 | ||||
| Hamilton East—Stoney Creek | NDP | NDP | 20,442 | 51.72% | 10,045 | 25.41% | 46.26% | 10,397 | 7,395 | 20,442 | 692 | – | 601 | 39,527 | ||||
| Hamilton Mountain | Lib | NDP | 20,492 | 45.16% | 5,798 | 12.78% | 50.45% | 14,694 | 8,641 | 20,492 | 748 | – | 798 | 45,373 | ||||
| Huron—Bruce | Lib | PC | 19,138 | 42.76% | 4,479 | 10.01% | 59.23% | 14,659 | 19,138 | 9,329 | 772 | 200 | 656 | 44,754 | ||||
| Kenora—Rainy River | NDP | NDP | 10,949 | 49.62% | 2,642 | 11.97% | 45.75% | 2,202 | 8,307 | 10,949 | 391 | – | 216 | 22,065 | ||||
| Kingston and the Islands | Lib | Lib | 21,028 | 48.84% | 10,787 | 25.06% | 45.03% | 21,028 | 9,610 | 10,241 | 1,594 | – | 578 | 43,051 | ||||
| Kitchener Centre | Lib | Lib | 15,392 | 39.23% | 323 | 0.82% | 49.16% | 15,392 | 15,069 | 7,385 | 938 | 137 | 317 | 39,238 | ||||
| Kitchener—Conestoga | Lib | PC | 18,017 | 44.18% | 3,541 | 8.68% | 46.62% | 14,476 | 18,017 | 7,165 | 1,121 | – | – | 40,779 | ||||
| Kitchener—Waterloo | PC | PC | 21,665 | 43.77% | 3,828 | 7.73% | 50.54% | 17,837 | 21,665 | 8,250 | 1,308 | 316 | 123 | 49,499 | ||||
| Lambton—Kent—Middlesex | Lib | PC | 19,379 | 45.74% | 6,956 | 16.42% | 54.08% | 12,423 | 19,379 | 8,882 | 987 | – | 701 | 42,372 | ||||
| Lanark—Frontenac—Lennox and Addington | PC | PC | 22,457 | 50.12% | 9,967 | 22.25% | 50.43% | 12,490 | 22,457 | 8,104 | 1,754 | – | – | 44,805 | ||||
| Leeds—Grenville | PC | PC | 24,314 | 63.60% | 17,651 | 46.17% | 50.64% | 6,663 | 24,314 | 5,822 | 1,319 | – | 111 | 38,229 | ||||
| London—Fanshawe | Lib | NDP | 13,953 | 40.77% | 4,275 | 12.49% | 45.82% | 9,678 | 9,075 | 13,953 | 852 | 192 | 475 | 34,225 | ||||
| London North Centre | Lib | Lib | 19,167 | 43.91% | 6,539 | 14.98% | 47.87% | 19,167 | 12,628 | 9,914 | 1,451 | – | 492 | 43,652 | ||||
| London West | Lib | Lib | 22,610 | 45.65% | 8,007 | 16.17% | 53.01% | 22,610 | 14,603 | 10,757 | 1,194 | – | 361 | 49,525 | ||||
| Markham—Unionville | Lib | Lib | 19,579 | 52.58% | 7,859 | 21.11% | 40.68% | 19,579 | 11,720 | 4,575 | 1,104 | – | 259 | 37,237 | ||||
| Mississauga—Brampton South | Lib | Lib | 15,579 | 46.04% | 5,292 | 15.64% | 36.43% | 15,579 | 10,287 | 5,420 | 1,247 | 616 | 691 | 33,840 | ||||
| Mississauga East—Cooksville | Lib | Lib | 15,535 | 45.74% | 4,238 | 12.48% | 40.50% | 15,535 | 11,297 | 5,704 | 934 | 199 | 294 | 33,963 | ||||
| Mississauga—Erindale | Lib | Lib | 20,552 | 45.03% | 4,258 | 9.33% | 43.91% | 20,552 | 16,294 | 7,768 | 853 | – | 176 | 45,643 | ||||
| Mississauga South | Lib | Lib | 20,375 | 50.71% | 5,876 | 14.62% | 51.25% | 20,375 | 14,499 | 4,044 | 860 | – | 401 | 40,179 | ||||
| Mississauga—Streetsville | Lib | Lib | 18,591 | 51.54% | 7,936 | 22.00% | 41.46% | 18,591 | 10,655 | 5,494 | 1,329 | – | 0 | 36,069 | ||||
| Nepean—Carleton | PC | PC | 29,985 | 54.48% | 15,141 | 27.51% | 49.91% | 14,844 | 29,985 | 8,127 | 1,641 | – | 440 | 55,037 | ||||
| Newmarket—Aurora | PC | PC | 21,425 | 47.24% | 5,271 | 11.62% | 49.33% | 16,154 | 21,425 | 6,514 | 1,256 | – | – | 45,349 | ||||
| Niagara Falls | Lib | Lib | 16,794 | 35.89% | 498 | 1.06% | 49.44% | 16,794 | 16,296 | 12,304 | 759 | 231 | 408 | 46,792 | ||||
| Niagara West—Glanbrook | PC | PC | 24,919 | 50.95% | 12,211 | 24.97% | 54.88% | 12,708 | 24,919 | 9,070 | 1,372 | – | 837 | 48,906 | ||||
| Nickel Belt | NDP | NDP | 16,876 | 54.86% | 9,425 | 30.64% | 49.55% | 7,451 | 5,625 | 16,876 | 810 | – | – | 30,762 | ||||
| Nipissing | Lib | PC | 15,381 | 50.11% | 6,606 | 21.52% | 51.86% | 8,775 | 15,381 | 5,567 | 971 | – | – | 30,694 | ||||
| Northumberland—Quinte West | Lib | PC | 19,279 | 39.80% | 707 | 1.46% | 51.88% | 18,572 | 19,279 | 8,589 | 1,483 | 159 | 357 | 48,439 | ||||
| Oak Ridges—Markham | Lib | Lib | 28,878 | 44.78% | 4,928 | 7.64% | 42.70% | 28,878 | 23,950 | 8,548 | 1,569 | 484 | 1,057 | 64,486 | ||||
| Oakville | Lib | Lib | 21,711 | 48.09% | 4,580 | 10.14% | 52.70% | 21,711 | 17,131 | 4,625 | 878 | 498 | 303 | 45,146 | ||||
| Oshawa | PC | PC | 16,719 | 42.25% | 2,403 | 6.07% | 44.26% | 6,921 | 16,719 | 14,316 | 1,035 | – | 582 | 39,573 | ||||
| Ottawa Centre | Lib | Lib | 23,646 | 46.81% | 8,931 | 17.68% | 53.73% | 23,646 | 9,257 | 14,715 | 2,184 | 309 | 400 | 50,511 | ||||
| Ottawa—Orléans | Lib | Lib | 21,857 | 46.44% | 2,854 | 6.06% | 52.65% | 21,857 | 19,003 | 4,979 | 886 | – | 337 | 47,062 | ||||
| Ottawa South | Lib | Lib | 21,842 | 48.86% | 6,897 | 15.43% | 51.19% | 21,842 | 14,945 | 5,988 | 1,442 | – | 490 | 44,707 | ||||
| Ottawa—Vanier | Lib | Lib | 19,619 | 51.51% | 10,690 | 28.07% | 46.81% | 19,619 | 8,929 | 7,466 | 1,719 | – | 352 | 38,085 | ||||
| Ottawa West—Nepean | Lib | Lib | 18,492 | 41.62% | 1,009 | 2.27% | 54.02% | 18,492 | 17,483 | 6,576 | 1,485 | – | 396 | 44,432 | ||||
| Oxford | PC | PC | 20,658 | 54.87% | 11,248 | 29.88% | 49.18% | 9,410 | 20,658 | 5,885 | 1,336 | – | 359 | 37,648 | ||||
| Parkdale—High Park | NDP | NDP | 18,365 | 46.20% | 3,488 | 8.77% | 51.79% | 14,877 | 4,668 | 18,365 | 1,325 | 289 | 228 | 39,752 | ||||
| Parry Sound—Muskoka | PC | PC | 19,417 | 54.09% | 12,880 | 35.88% | 51.79% | 6,537 | 19,417 | 6,527 | 3,251 | – | 167 | 35,899 | ||||
| Perth—Wellington | Lib | PC | 14,845 | 40.09% | 210 | 0.57% | 51.89% | 14,635 | 14,845 | 5,836 | 918 | – | 791 | 37,025 | ||||
| Peterborough | Lib | Lib | 19,430 | 39.93% | 4,107 | 8.44% | 53.18% | 19,430 | 15,323 | 12,460 | 1,235 | – | 210 | 48,658 | ||||
| Pickering—Scarborough East | Lib | Lib | 18,201 | 46.66% | 5,168 | 13.25% | 49.69% | 18,201 | 13,033 | 6,424 | 1,096 | – | 252 | 39,006 | ||||
| Prince Edward—Hastings | Lib | PC | 18,816 | 42.28% | 3,130 | 7.03% | 51.74% | 15,686 | 18,816 | 7,379 | 2,049 | – | 573 | 44,503 | ||||
| Renfrew—Nipissing—Pembroke | PC | PC | 27,594 | 70.78% | 21,363 | 54.80% | 52.69% | 6,231 | 27,594 | 4,277 | 574 | – | 309 | 38,985 | ||||
| Richmond Hill | Lib | Lib | 18,042 | 46.92% | 4,279 | 11.13% | 42.49% | 18,042 | 13,763 | 4,987 | 1,268 | – | 394 | 38,454 | ||||
| St. Catharines | Lib | Lib | 17,166 | 40.21% | 1,705 | 3.99% | 51.00% | 17,166 | 15,461 | 8,624 | 1,066 | – | 378 | 42,695 | ||||
| St. Paul's | Lib | Lib | 25,048 | 58.39% | 16,076 | 37.48% | 50.41% | 25,048 | 8,972 | 7,124 | 1,180 | – | 573 | 42,897 | ||||
| Sarnia—Lambton | PC | PC | 19,570 | 48.32% | 9,263 | 22.87% | 51.75% | 8,819 | 19,570 | 10,307 | 567 | 1,077 | 160 | 40,500 | ||||
| Sault Ste. Marie | Lib | Lib | 16,109 | 54.95% | 7,072 | 24.12% | 49.35% | 16,109 | 3,477 | 9,037 | 519 | – | 172 | 29,314 | ||||
| Scarborough—Agincourt | Lib | Lib | 14,907 | 46.85% | 4,685 | 14.73% | 43.57% | 14,907 | 10,222 | 5,017 | 722 | – | 948 | 31,816 | ||||
| Scarborough Centre | Lib | Lib | 16,142 | 51.43% | 8,631 | 27.50% | 44.49% | 16,142 | 7,511 | 6,876 | 558 | – | 301 | 31,388 | ||||
| Scarborough—Guildwood | Lib | Lib | 15,607 | 48.93% | 6,470 | 20.29% | 47.65% | 15,607 | 9,137 | 6,194 | 413 | – | 543 | 31,894 | ||||
| Scarborough—Rouge River | Lib | Lib | 15,237 | 41.87% | 2,149 | 5.91% | 42.89% | 15,237 | 6,837 | 13,088 | 455 | – | 773 | 36,390 | ||||
| Scarborough Southwest | Lib | Lib | 14,585 | 44.09% | 4,181 | 12.64% | 47.78% | 14,585 | 7,061 | 10,404 | 777 | – | 250 | 33,077 | ||||
| Simcoe—Grey | PC | PC | 25,339 | 54.33% | 14,935 | 32.02% | 48.12% | 10,404 | 25,339 | 6,839 | 4,057 | – | – | 46,639 | ||||
| Simcoe North | PC | PC | 25,081 | 55.16% | 14,890 | 32.75% | 50.98% | 10,191 | 25,081 | 7,710 | 2,488 | – | – | 45,470 | ||||
| Stormont—Dundas—South Glengarry | Lib | PC | 21,463 | 55.25% | 13,050 | 33.60% | 51.40% | 8,413 | 21,463 | 8,021 | 551 | – | 396 | 38,844 | ||||
| Sudbury | Lib | Lib | 13,735 | 42.37% | 531 | 1.64% | 49.94% | 13,735 | 4,400 | 13,204 | 870 | 44 | 164 | 32,417 | ||||
| Thornhill | PC | PC | 20,971 | 46.71% | 2,598 | 5.79% | 45.35% | 18,373 | 20,971 | 4,024 | 756 | – | 772 | 44,896 | ||||
| Thunder Bay—Atikokan | Lib | Lib | 10,319 | 38.97% | 438 | 1.65% | 46.61% | 10,319 | 5,815 | 9,881 | 379 | 86 | – | 26,480 | ||||
| Thunder Bay—Superior North | Lib | Lib | 11,765 | 45.00% | 2,654 | 10.15% | 48.20% | 11,765 | 4,578 | 9,111 | 555 | – | 133 | 26,142 | ||||
| Timiskaming—Cochrane | Lib | NDP | 12,633 | 50.12% | 6,101 | 24.21% | 50.01% | 6,532 | 5,337 | 12,633 | 312 | – | 391 | 25,205 | ||||
| Timmins—James Bay | NDP | NDP | 11,479 | 49.47% | 2,964 | 12.77% | 46.84% | 2,870 | 8,515 | 11,479 | 233 | – | 108 | 23,205 | ||||
| Toronto Centre | Lib | Lib | 25,236 | 54.94% | 13,665 | 29.75% | 48.42% | 25,236 | 7,186 | 11,571 | 1,123 | – | 820 | 45,936 | ||||
| Toronto—Danforth | NDP | NDP | 20,062 | 54.01% | 8,693 | 23.40% | 49.30% | 11,369 | 3,488 | 20,062 | 1,354 | – | 875 | 37,148 | ||||
| Trinity—Spadina | NDP | NDP | 19,870 | 42.36% | 1,139 | 2.43% | 43.00% | 18,731 | 5,420 | 19,870 | 2,415 | – | 470 | 46,906 | ||||
| Vaughan | Lib | Lib | 26,174 | 53.02% | 10,754 | 21.78% | 41.08% | 26,174 | 15,420 | 5,594 | 694 | 169 | 1,316 | 49,367 | ||||
| Welland | NDP | NDP | 19,527 | 44.66% | 5,479 | 12.53% | 51.64% | 8,638 | 14,048 | 19,527 | 1,005 | – | 505 | 43,723 | ||||
| Wellington—Halton Hills | PC | PC | 23,495 | 55.62% | 12,161 | 28.79% | 51.11% | 11,334 | 23,495 | 6,106 | 1,309 | – | – | 42,244 | ||||
| Whitby—Oshawa | PC | PC | 24,499 | 48.17% | 7,511 | 14.77% | 49.69% | 16,988 | 24,499 | 7,865 | 1,139 | – | 371 | 50,862 | ||||
| Willowdale | Lib | Lib | 21,984 | 50.84% | 7,456 | 17.24% | 45.40% | 21,984 | 14,528 | 5,556 | 874 | – | 297 | 43,239 | ||||
| Windsor—Tecumseh | Lib | Lib | 15,946 | 42.83% | 3,718 | 9.99% | 44.69% | 15,946 | 7,751 | 12,228 | 830 | – | 476 | 37,231 | ||||
| Windsor West | Lib | Lib | 14,127 | 41.31% | 3,583 | 10.48% | 41.57% | 14,127 | 8,476 | 10,544 | 1,051 | – | – | 34,198 | ||||
| York Centre | Lib | Lib | 14,694 | 45.36% | 3,188 | 9.84% | 45.74% | 14,694 | 11,506 | 4,579 | 535 | 127 | 954 | 32,395 | ||||
| York—Simcoe | PC | PC | 20,425 | 52.78% | 10,929 | 28.24% | 42.91% | 9,496 | 20,425 | 6,607 | 1,479 | – | 690 | 38,697 | ||||
| York South—Weston | Lib | Lib | 13,805 | 44.55% | 734 | 2.37% | 44.86% | 13,805 | 3,441 | 13,071 | 474 | 45 | 151 | 30,987 | ||||
| York West | Lib | Lib | 11,455 | 50.49% | 3,554 | 15.66% | 39.24% | 11,455 | 2,735 | 7,901 | 287 | 203 | 107 | 22,688 | ||||
- = open seat
- = turnout is above provincial average
- = incumbent re-elected
- = incumbency arose from byelection gain
- ^ "2011 Ontario General Election". elections.on.ca. Elections Ontario. Retrieved June 20, 2023. Error in EO report re Willowdale corrected: "Alexander Brown for Willowdale". willowdalendp.ca. November 7, 2011. Archived from the original on November 7, 2011. Retrieved June 21, 2023.
- ^ including spoilt ballots
- ^ minor political parties receiving less than 1% of the popular vote are aggregated under "Other"; independent candidates are aggregated separately
Maps edit
-
 Support for Liberal Party candidates by riding
 -
 Support for Conservative Party candidates by riding
 -
 Support for New Democratic Party candidates by riding
 -
 Support for Green Party candidates by riding


Principal races edit
| Party in 1st place | Party in 2nd place | Total | |||
|---|---|---|---|---|---|
| Lib | PC | NDP | |||
| Liberal | – | 40 | 13 | 53 | |
| Progressive Conservative | 34 | – | 3 | 37 | |
| New Democratic | 13 | 4 | – | 17 | |
| Total | 47 | 44 | 16 | 107 | |
| Parties | Seats | |
|---|---|---|
| █ Liberal | █ Progressive Conservative | 74 |
| █ Liberal | █ New Democratic | 26 |
| █ Progressive Conservative | █ New Democratic | 7 |
| Total | 107 | |
| Parties | 1st | 2nd | 3rd | 4th | 5th | Total |
|---|---|---|---|---|---|---|
| █ Liberal | 53 | 47 | 7 | 107 | ||
| █ Progressive Conservative | 37 | 44 | 26 | 107 | ||
| █ New Democratic | 17 | 16 | 73 | 1 | 107 | |
| █ Green | 1 | 101 | 5 | 107 | ||
| █ Libertarian | 3 | 36 | 39 | |||
| █ Independent | 1 | 10 | 11 | |||
| █ Northern Ontario Heritage | 1 | 1 | 2 | |||
| █ Family Coalition | 21 | 21 | ||||
| █ Freedom | 18 | 18 | ||||
| █ Special Needs | 2 | 2 | ||||
| █ Communist | 1 | 1 | ||||
| █ Confederation of Regions | 1 | 1 | ||||
| █ Socialist | 1 | 1 |
Significant results among independent and minor party candidates edit
Those candidates not belonging to a major party, receiving more than 1,000 votes in the election, are listed below:
| Riding | Party | Candidates | Votes | Placed |
|---|---|---|---|---|
| Bruce—Grey—Owen Sound | █ Independent | Shane Jolley | 1,478 | 5th |
| Oak Ridges—Markham | █ Libertarian | Karl Boelling | 1,057 | 4th |
| Sarnia—Lambton | █ Independent | Andy Bruziewicz | 1,077 | 4th |
Seats changing hands edit
There were 18 seats that changed allegiance from the 2007 election.
| Source | Party | ||||||
|---|---|---|---|---|---|---|---|
| Lib | PC | NDP | Total | ||||
| Seats retained | Incumbents returned | 47 | 21 | 8 | 76 | ||
| Open seats held | 6 | 4 | 2 | 12 | |||
| Byelection loss reversed | 1 | 1 | |||||
| Seats changing hands | Incumbents defeated | 6 | 4 | 10 | |||
| Open seats gained | 5 | 3 | 8 | ||||
| Total | 53 | 37 | 17 | 107 | |||
Opinion polls edit
| Polling Firm | Date of Polling | Link | Liberal | PC | NDP | Green | Type of poll | Margin of error |
|---|---|---|---|---|---|---|---|---|
| Angus Reid | October 4–5, 2011 | 37 | 33 | 26 | 3 | Online | 3.6% | |
| EKOS | October 3–5, 2011 | 37.7 | 31.5 | 23.3 | 5.9 | Interactive voice response | 2.0% | |
| Forum Research | October 4, 2011 | HTML | 37 | 36 | 23 | 3 | Interactive voice response | 3.1% |
| Angus Reid | October 3–4, 2011 | 33 | 36 | 26 | 5 | Online | 2.1% | |
| Abacus Data | October 3–4, 2011 | HTML | 37 | 34 | 24 | 4 | Online | 3.1% |
| EKOS | October 2–4, 2011 | 39.0 | 29.7 | 23.1 | 6.6 | Interactive voice response | 2.2% | |
| Nanos Research | October 2–3, 2011 | 40.1 | 33.0 | 23.2 | 2.8 | Telephone | 4.2% | |
| EKOS | October 2–3, 2011 | 39.1 | 29.1 | 24.5 | 6.0 | Interactive voice response | 2.9% | |
| Nanos Research | October 1–3, 2011 | 37.7 | 33.2 | 25.8 | 2.1 | Telephone | 3.4% | |
| Ipsos Reid | September 30 – October 3, 2011 | 41 | 31 | 25 | 3 | Telephone | 3.1% | |
| Nanos Research | September 30 – October 2, 2011 | 35.9 | 36.4 | 25.7 | 1.2 | Telephone | 3.5% | |
| EKOS | September 29 – October 2, 2011 | 37.8 | 30.6 | 22.7 | 7.3 | Interactive voice response | 2.8% | |
| Nanos Research | September 29 – October 1, 2011 | 36.5 | 34 | 26.8 | 1.9 | Telephone | 3.5% | |
| Nanos Research | September 28–30, 2011 | 38.0 | 35.3 | 24.6 | 1.8 | Telephone | 3.5% | |
| Angus Reid | September 28–30, 2011 | 33 | 34 | 26 | 6 | Online | 3.1% | |
| Leger Marketing | September 28–29, 2011 | PDF[permanent dead link] | 32 | 34 | 29 | 5 | Online | 3.1% |
| Nanos Research | September 28–29, 2011 | 37.7 | 34.4 | 25.5 | 2.0 | Telephone | 4.3% | |
| Environics | September 26–28, 2011 | HTML | 35 | 36 | 25 | 3 | Online | |
| Abacus Data | September 23–25, 2011 | 33 | 37 | 23 | 6 | Online | 2.9% | |
| EKOS | September 21–25, 2011 | 34.9 | 31.4 | 24.7 | 7.6 | Interactive voice response | 2.3% | |
| Forum Research | September 22–23, 2011 | HTML | 35 | 35 | 23 | 5 | Interactive voice response | 0.5% |
| Angus Reid | September 13–15, 2011 | HTML | 32 | 36 | 26 | 6 | Online | 3.1% |
| Leger Marketing | September 12–15, 2011 | PDF[permanent dead link] | 33 | 36 | 26 | 5 | Online | 3.1% |
| Abacus Data | September 9–12, 2011 | HTML | 32 | 41 | 20 | 6 | Online | 3.2% |
| Nanos Research | September 10–11, 2011 | 38.1 | 34.7 | 24.3 | 2.7 | Telephone | 4.9% | |
| Ipsos Reid | September 7–11, 2011 | HTML Archived September 23, 2011, at the Wayback Machine | 38 | 37 | 24 | 1 | Telephone | 3.5% |
| Harris-Decima | August 25 – September 4, 2011 | HTML | 40 | 29 | 24 | 6 | Telephone | 3.8% |
| Nanos Research | August 30 – September 1, 2011 | 31.9 | 35.4 | 22.8 | 4.1 | Telephone | 3.1% | |
| Forum Research | August 29–30, 2011 | HTML | 30 | 35 | 26 | 7 | Interactive voice response | 2.0% |
| Angus Reid | August 25–28, 2011 | 31 | 38 | 24 | 6 | Online | 3.1% | |
| Nanos Research | August 10–13, 2011 | 37.6 | 42.1 | 16.2 | 3.4 | Telephone | 3.4% | |
| Ipsos Reid | July 29 – August 4, 2011 | HTML Archived October 9, 2011, at the Wayback Machine | 36 | 38 | 23 | 3 | Telephone | 4.9% |
| Forum Research | July 27–28, 2011 | HTML | 28 | 38 | 24 | 7 | Interactive voice response | 2.1% |
| Ipsos Reid | June 7 – July 7, 2011 | HTML Archived October 3, 2011, at the Wayback Machine | 31 | 42 | 22 | 5 | Telephone | 3.5% |
| Forum Research | June 21–22, 2011 | HTML | 26 | 41 | 22 | 8 | Interactive voice response | 1.7% |
| Ipsos Reid | May 17 – June 9, 2011 | HTML | 34 | 40 | 20 | 6 | Telephone | 3.5% |
| Nanos Research | May 14–15, 2011 | 34 | 41 | 19 | 5 | Telephone | 4.7% | |
| Nanos Research | March 8–11, 2011 | 35 | 44 | 16 | 4 | Telephone | 4.9% | |
| Nanos Research | January 31 – February 3, 2011 | 39 | 43 | 13 | 5 | Telephone | 4.7% | |
| Ipsos Reid | January 20, 2011 | HTML Archived January 29, 2011, at the Wayback Machine | 35 | 38 | 17 | 9 | Telephone | |
| Ipsos Reid | November 18, 2010 | HTML[permanent dead link] | 32 | 41 | 20 | 7 | ||
| Angus Reid | September 28, 2010 | 29 | 41 | 22 | 8 | Online | 3.5% | |
| Ipsos Reid | August 21, 2010 | HTML | 35 | 36 | 18 | 11 | ||
| Ipsos Reid | June 19, 2010 | HTML | 37 | 32 | 20 | 11 | ||
| Nanos Research | February 9–10, 2010 | 41.4 | 37.9 | 12.8 | 7.9 | Telephone | 4.9% | |
| Ipsos Reid | December 13, 2009 | HTML | 38 | 34 | 15 | 10 | ||
| Angus Reid | December 4, 2009 | 27 | 41 | 20 | 11 | |||
| Nanos Research | October 24–25, 2009 | 36.6 | 35 | 17.2 | 9.8 | Telephone | 4.8% | |
| Environics | October 2009 | HTML[permanent dead link] | 32 | 37 | 19 | 11 | ||
| Environics | June 2009 | HTML[permanent dead link] | 44 | 32 | 15 | 8 | ||
| Environics | April 2009 | HTML | 44 | 29 | 17 | 11 | ||
| Environics | January 2009 | HTML[permanent dead link] | 45 | 32 | 12 | 11 | ||
| Environics | November 2008 | HTML[permanent dead link] | 35 | 30 | 21 | 13 | ||
| Environics | June 2008 | HTML[permanent dead link] | 41 | 31 | 16 | 12 | ||
| Environics | March 2008 | HTML | 38 | 30 | 19 | 12 | ||
| Environics | January 2008 | HTML[permanent dead link] | 45 | 34 | 18 | 2 | ||
| Environics | November 2007 | HTML[permanent dead link] | 44 | 31 | 22 | 3 | ||
| Election 2007 | October 10, 2007 | 42.3 | 31.6 | 16.8 | 8.0 |
Media endorsements edit
Liberals
- Barrie Advance [25]
- The Globe and Mail [26]
- Hamilton Spectator [27]
- Ottawa Citizen [28]
- Sudbury Star [29]
- Toronto Star [30]
- Waterloo Region Record [31]
- Windsor Star [32]
Progressive Conservatives
- Brampton Guardian [33]
- Metroland Durham Region Media Group [34]
- National Post [35]
Did not endorse
References edit
- ^ a b "Statistical Summary" (PDF). [Elections Ontario]. Archived (PDF) from the original on March 25, 2018. Retrieved March 24, 2018.
- ^ "Election Statute Law Amendment Act, 2005". Service Ontario e-laws. December 15, 2005. Archived from the original on June 13, 2011. Retrieved May 19, 2008.
- ^ "Robert Benzie and Susan Delacourt. "Ontario cabinet minister to seek federal seat." Toronto Star". Toronto Star. Archived from the original on October 23, 2012. Retrieved September 7, 2017.
- ^ Benzie, Robert (June 4, 2011). "Retiring Liberal MPP Bruce Crozier dead". The Toronto Star. Toronto. Archived from the original on June 7, 2011. Retrieved June 6, 2011.
- ^ "Elections Ontario - When to Vote". Wemakevotingeasy.ca. September 30, 2011. Archived from the original on October 6, 2011. Retrieved October 7, 2011.
- ^ "Ontario leaders' debate set for Sept. 27". CBC.ca. September 2, 2011. Archived from the original on September 3, 2011. Retrieved September 2, 2011.
- ^ Examiner staff (January 21, 2011). "Aileen Carroll won't seek a second term". The Barrie Examiner. Barrie, ON. Archived from the original on July 22, 2011. Retrieved June 6, 2011.
- ^ Benzie, Robert (July 5, 2010). "Conservative MPP Bill Murdoch to ride off into the sunset". The Toronto Star. Toronto. Archived from the original on October 24, 2012. Retrieved June 6, 2011.
- ^ The Canadian Press (February 21, 2011). "MPP Savoline will not seek re-election". The Hamilton Spectator. Hamilton. Archived from the original on July 17, 2011. Retrieved June 6, 2011.
- ^ Nugget, Carol-Ann (October 14, 2010). "MPP Gerry Martiniuk to retire from provincial politics in 2011". Cambridge Now. Cambridge, ON. Archived from the original on March 4, 2016. Retrieved June 6, 2011.
- ^ "Veteran Ontario MPP Norm Sterling loses bitter PC nomination battle " Archived March 4, 2016, at the Wayback Machine. Globe and Mail.
- ^ QMI Agency (November 25, 2010). "Hoy won't seek re-election". London Free Press. London, ON. Archived from the original on March 19, 2012. Retrieved June 6, 2011.
- ^ Liberal backbencher Tony Ruprecht won’t seek re-election Archived October 24, 2012, at the Wayback Machine "Toronto Star"
- ^ Liberal MPP Caplan not running again Archived October 24, 2012, at the Wayback Machine "Toronto Star"
- ^ Chant, Miranda (November 9, 2011). "Elgin-Middlesex-London MPP Calls it Quits". News/Talk 1290 CJBK. London, ON. Archived from the original on July 8, 2011. Retrieved June 6, 2011.
- ^ Sherwin, Fred (April 13, 2011). "Veteran MPP calls it a day after 41 years in politics". Orléans Online. Ottawa. Archived from the original on September 27, 2011. Retrieved June 6, 2011.
- ^ Robert, Benzie (July 30, 2011). "Former NDP leader Howard Hampton quits". The Toronto Star. Toronto. Archived from the original on October 24, 2012. Retrieved July 30, 2011.
- ^ Cramer, Brandi (November 19, 2011). "Smith steps aside: MPP recalls her accomplishments and regrets". North Bay Nugget. North Bay, ON. Archived from the original on July 20, 2011. Retrieved June 6, 2011.
- ^ "Longtime Pickering politician calls it quits"[permanent dead link]. Pickering News Advertiser.
- ^ The Canadian Press (March 25, 2011). "Veteran MPP Gerry Phillips the latest Ontario Liberal not seeking re-election". iPolitics.ca. Archived from the original on July 20, 2011. Retrieved June 6, 2011.
- ^ CTV staff (November 29, 2010). "Liberal MPP Bruce Crozier retires". CTV Ottawa. Ottawa. Archived from the original on October 22, 2012. Retrieved June 6, 2011.
- ^ Blizzard, Christine (January 13, 2011). "MPP David Ramsay won't run again". The Toronto Sun. Toronto. Archived from the original on September 16, 2011. Retrieved June 6, 2011.
- ^ Talaga, Tanya (June 3, 2011). "NDP's Peter Kormos to retire". The Toronto Star. Toronto. Archived from the original on October 24, 2012. Retrieved June 3, 2011.
- ^ Benzie, Robert; Rob Ferguson (June 10, 2011). "Liberals lose a star: Sandra Pupatello won't seek re-election". Toronto Star. Toronto. Archived from the original on October 24, 2012. Retrieved June 10, 2011.
- ^ "Simcoe County Breaking News - Simcoe County's Online Newspaper". Simcoe.com. Archived from the original on March 15, 2012. Retrieved April 15, 2019.
- ^ Canada. "Dalton McGuinty's Liberals the best choice for Ontario's challenges". Toronto: The Globe and Mail. Archived from the original on October 23, 2011. Retrieved October 7, 2011.
- ^ "Liberals, despite faults, are the best option". TheSpec. Archived from the original on October 6, 2011. Retrieved October 7, 2011.
- ^ Ottawa Citizen October 4, 2011. "Hold your nose and vote Liberal". Ottawacitizen.com. Archived from the original on December 16, 2011. Retrieved October 7, 2011.
{{cite web}}: CS1 maint: numeric names: authors list (link) - ^ "Liberals best fit for Sudbury - Point of View - The Sudbury Star - Ontario, CA". The Sudbury Star. October 3, 2011. Retrieved October 7, 2011.[permanent dead link]
- ^ "Liberals best choice for Ontario's future". thestar.com. Toronto. September 30, 2011. Archived from the original on January 5, 2012. Retrieved October 7, 2011.
- ^ "Editorial: Liberals offer voters best hope". TheRecord. September 30, 2011. Archived from the original on November 6, 2011. Retrieved October 7, 2011.
- ^ The Windsor Star October 1, 2011 (October 1, 2011). "Ontario votes". Windsorstar.com. Archived from the original on December 9, 2011. Retrieved October 7, 2011.
{{cite web}}: CS1 maint: numeric names: authors list (link) - ^ "EDITORIAL: Vote for change". BramptonGuardian Article. September 29, 2011. Archived from the original on April 6, 2012. Retrieved October 7, 2011.
- ^ "Progressive Conservatives the party to lead Ontario". DurhamRegion Article. September 29, 2011. Archived from the original on October 10, 2011. Retrieved October 7, 2011.
- ^ "On Thursday, Ontarians should vote Conservative". Nationalpost.com. October 3, 2011. Retrieved October 7, 2011.[permanent dead link]
- ^ "Ontario deserves better | Editorial | Opinion". Toronto Sun. Archived from the original on October 7, 2011. Retrieved October 7, 2011.
- ^ "Editorial: None of the above | Editorial | Opinion". Ottawa Sun. October 1, 2011. Archived from the original on November 2, 2011. Retrieved October 7, 2011.
External links edit
- Elections Ontario
- Elections Ontario, 2011 General Election
- Election Almanac - Ontario Provincial Election 2011
- Detailed interactive map of poll-level results