


Summary
The 2012 United States presidential election in South Dakota took place on November 6, 2012, as part of the 2012 United States presidential election in which all 50 states plus the District of Columbia participated. South Dakota voters chose three electors to represent them in the Electoral College via a popular vote pitting incumbent Democratic President Barack Obama and his running mate, Vice President Joe Biden, against Republican challenger and former Massachusetts Governor Mitt Romney and his running mate, Congressman Paul Ryan.
| ||||||||||||||||||||||||||
| ||||||||||||||||||||||||||
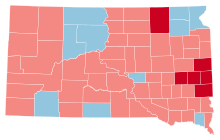
 County Results
| ||||||||||||||||||||||||||
| ||||||||||||||||||||||||||


Prior to the election, all seventeen news organizations making predictions for the election considered this a state Romney would win, or otherwise considered as a safe red state. South Dakota has not voted for a Democratic presidential nominee since Lyndon B. Johnson carried it in his 44-state landslide in 1964. South Dakota, just as all of the other states in the Great Plains, is among the most Republican states in the country. According to a 2012 Gallup poll, South Dakota is the 9th most conservative state in the country, with Republicans having an 11 percentage point advantage over Democrats in terms of party affiliation or identification.[1] It is also the 10th whitest state in the country as of 2012, at 83.8%,[2] and has the 4th highest gun ownership rate in the country at 56.6%, according to The Washington Post.[3] Both of these voting blocs are relatively solid for the Republican Party.[4]
While Obama lost the state by only 8.41% in 2008, illustrating a potential resurgence of Democratic strength among the agrarian population as seen in states such as Iowa, the state was returned to the safe Republican column in 2012. Romney won South Dakota by an 18.02% margin of victory. Romney was able to win back southeast Dakota: Obama became competitive there in 2008, when he won Minnehaha County (and many of its suburbs), home to the state's largest city of Sioux Falls, by only 587 votes.[5] Romney carried upwards of 60% of the vote in many counties, with his best performance in the West River. He also flipped Brown County, where Aberdeen is.
Obama's best performance was in majority Native American counties in the west of the state. He carried 93.35% of the vote in Shannon County (now known as Oglala Lakota), home to the Pine Ridge Reservation and the Oglala Lakota tribe. The counties of Buffalo; Dewey; and Todd, where the Crow Creek; Cheyenne River and Standing Rock; and Rosebud reservations are located, respectively, also delivered great margins to the president. Clay County, home to the University of South Dakota, was the only county in the southeast to vote for Obama.
As of the 2020 presidential election, this is the most last time in which the Democratic candidate won Corson County, Day County, Marshall County, and Roberts County.
Primary elections edit
Democratic primary edit
Republican primary edit
| |||||||||||||||||||||||||||||||||||||||||
| |||||||||||||||||||||||||||||||||||||||||
 South Dakota results by county
Mitt Romney
(Note: Italicization indicates a withdrawn candidacy) | |||||||||||||||||||||||||||||||||||||||||

The Republican primary took place on June 5, 2012.[6] 25 delegates will be chosen, for a total of 28 delegates to go to the national convention.
| 2012 South Dakota Republican primary | |||
|---|---|---|---|
| Candidate | Votes | Percentage | Delegates |
| Mitt Romney | 34,033 | 66.1% | 25 |
| Ron Paul | 6,704 | 13.01% | 0 |
| Rick Santorum | 5,916 | 11.48% | 0 |
| Uncommitted | 2,797 | 5.43% | 0 |
| Newt Gingrich | 2,074 | 4.03% | 0 |
| Unpledged delegates: | 3 | ||
| Total: | 51,524 | 100.0% | 28 |
| Key: | Withdrew prior to contest |
General election edit
Results edit
| 2012 United States presidential election in South Dakota[7] | ||||||
|---|---|---|---|---|---|---|
| Party | Candidate | Running mate | Votes | Percentage | Electoral votes | |
| Republican | Mitt Romney | Paul Ryan | 210,610 | 57.89% | 3 | |
| Democratic | Barack Obama | Joe Biden | 145,039 | 39.87% | 0 | |
| Libertarian | Gary Johnson | Jim Gray | 5,795 | 1.59% | 0 | |
| Constitution | Virgil Goode | Jim Clymer | 2,371 | 0.65% | 0 | |
| Totals | 363,815 | 100.00% | 3 | |||
Results by county edit
| County[8] | Mitt Romney Republican |
Barack Obama Democratic |
Gary Johnson Libertarian |
Virgil Hamlin Goode, Jr. Constitution |
Margin | Total votes cast | |||||
|---|---|---|---|---|---|---|---|---|---|---|---|
| # | % | # | % | # | % | # | % | # | % | ||
| Aurora | 804 | 57.43% | 556 | 39.71% | 27 | 1.93% | 13 | 0.93% | 248 | 17.72% | 1,400 |
| Beadle | 4,230 | 58.24% | 2,881 | 39.67% | 107 | 1.47% | 45 | 0.62% | 1,349 | 18.57% | 7,263 |
| Bennett | 626 | 52.04% | 548 | 45.55% | 18 | 1.50% | 11 | 0.91% | 78 | 6.49% | 1,203 |
| Bon Homme | 1,830 | 59.53% | 1,167 | 37.96% | 55 | 1.79% | 22 | 0.72% | 663 | 21.57% | 3,074 |
| Brookings | 6,220 | 50.16% | 5,827 | 46.99% | 253 | 2.04% | 100 | 0.81% | 393 | 3.17% | 12,400 |
| Brown | 8,321 | 51.79% | 7,250 | 45.12% | 409 | 2.55% | 88 | 0.55% | 1,071 | 6.67% | 16,068 |
| Brule | 1,499 | 63.01% | 824 | 34.64% | 37 | 1.56% | 19 | 0.80% | 675 | 28.37% | 2,379 |
| Buffalo | 166 | 25.90% | 472 | 73.63% | 3 | 0.47% | 0 | 0.00% | -306 | -47.73% | 641 |
| Butte | 3,073 | 73.03% | 1,000 | 23.81% | 94 | 2.23% | 39 | 0.93% | 2,071 | 49.22% | 4,208 |
| Campbell | 616 | 78.27% | 153 | 19.44% | 12 | 1.52% | 6 | 0.76% | 463 | 58.83% | 787 |
| Charles Mix | 2,230 | 59.25% | 1,483 | 39.40% | 30 | 0.80% | 21 | 0.56% | 747 | 19.85% | 3,764 |
| Clark | 1,067 | 58.59% | 713 | 39.15% | 27 | 1.48% | 14 | 0.77% | 354 | 19.44% | 1,821 |
| Clay | 2,147 | 41.02% | 2,955 | 56.46% | 107 | 2.04% | 25 | 0.48% | -808 | -15.44% | 5,234 |
| Codington | 6,696 | 58.10% | 4,588 | 39.81% | 169 | 1.47% | 71 | 0.62% | 2,108 | 18.29% | 11,524 |
| Corson | 515 | 42.92% | 648 | 54.00% | 30 | 2.50% | 7 | 0.58% | -133 | -11.08% | 1,200 |
| Custer | 3,062 | 67.74% | 1,335 | 29.54% | 83 | 1.84% | 40 | 0.88% | 1,727 | 38.20% | 4,520 |
| Davison | 4,757 | 59.68% | 3,042 | 38.16% | 125 | 1.57% | 47 | 0.59% | 1,715 | 21.52% | 7,971 |
| Day | 1,320 | 45.95% | 1,497 | 52.11% | 33 | 1.15% | 23 | 0.80% | -177 | -6.16% | 2,873 |
| Deuel | 1,175 | 54.12% | 941 | 43.34% | 32 | 1.47% | 23 | 1.06% | 234 | 10.78% | 2,171 |
| Dewey | 663 | 34.99% | 1,207 | 63.69% | 15 | 0.79% | 10 | 0.53% | -544 | -28.70% | 1,895 |
| Douglas | 1,334 | 78.93% | 332 | 19.64% | 16 | 0.95% | 8 | 0.47% | 1,002 | 59.29% | 1,690 |
| Edmunds | 1,264 | 65.29% | 622 | 32.13% | 37 | 1.91% | 13 | 0.67% | 642 | 33.16% | 1,936 |
| Fall River | 2,258 | 64.22% | 1,140 | 32.42% | 75 | 2.13% | 43 | 1.22% | 1,118 | 31.80% | 3,516 |
| Faulk | 765 | 67.88% | 331 | 29.37% | 22 | 1.95% | 9 | 0.80% | 434 | 38.51% | 1,127 |
| Grant | 2,034 | 56.41% | 1,493 | 41.40% | 48 | 1.33% | 31 | 0.86% | 541 | 15.01% | 3,606 |
| Gregory | 1,507 | 70.06% | 599 | 27.85% | 31 | 1.44% | 14 | 0.65% | 908 | 42.21% | 2,151 |
| Haakon | 940 | 86.08% | 138 | 12.64% | 8 | 0.73% | 6 | 0.55% | 802 | 73.44% | 1,092 |
| Hamlin | 1,803 | 64.55% | 921 | 32.98% | 47 | 1.68% | 22 | 0.79% | 882 | 31.57% | 2,793 |
| Hand | 1,242 | 67.21% | 575 | 31.11% | 21 | 1.14% | 10 | 0.54% | 667 | 36.10% | 1,848 |
| Hanson | 1,627 | 67.34% | 760 | 31.46% | 16 | 0.66% | 13 | 0.54% | 867 | 35.88% | 2,416 |
| Harding | 638 | 86.33% | 82 | 11.10% | 16 | 2.17% | 3 | 0.41% | 556 | 75.23% | 739 |
| Hughes | 5,219 | 64.00% | 2,786 | 34.16% | 107 | 1.31% | 43 | 0.53% | 2,433 | 29.84% | 8,155 |
| Hutchinson | 2,451 | 71.56% | 923 | 26.95% | 25 | 0.73% | 26 | 0.76% | 1,528 | 44.61% | 3,425 |
| Hyde | 531 | 72.44% | 189 | 25.78% | 11 | 1.50% | 2 | 0.27% | 342 | 46.66% | 733 |
| Jackson | 661 | 59.76% | 426 | 38.52% | 9 | 0.81% | 10 | 0.90% | 235 | 21.24% | 1,106 |
| Jerauld | 538 | 53.48% | 452 | 44.93% | 11 | 1.09% | 5 | 0.50% | 86 | 8.55% | 1,006 |
| Jones | 490 | 80.46% | 108 | 17.73% | 9 | 1.48% | 2 | 0.33% | 382 | 62.73% | 609 |
| Kingsbury | 1,451 | 55.64% | 1,092 | 41.87% | 45 | 1.73% | 20 | 0.77% | 359 | 13.77% | 2,608 |
| Lake | 3,419 | 54.40% | 2,724 | 43.34% | 98 | 1.56% | 44 | 0.70% | 695 | 11.06% | 6,285 |
| Lawrence | 7,025 | 61.85% | 3,973 | 34.98% | 262 | 2.31% | 99 | 0.87% | 3,052 | 26.87% | 11,359 |
| Lincoln | 13,611 | 62.00% | 7,982 | 36.36% | 261 | 1.19% | 98 | 0.45% | 5,629 | 25.64% | 21,952 |
| Lyman | 933 | 59.46% | 605 | 38.56% | 24 | 1.53% | 7 | 0.45% | 328 | 20.90% | 1,569 |
| Marshall | 889 | 44.74% | 1,061 | 53.40% | 29 | 1.46% | 8 | 0.40% | -172 | -8.66% | 1,987 |
| McCook | 1,655 | 63.34% | 905 | 34.63% | 33 | 1.26% | 20 | 0.77% | 750 | 28.71% | 2,613 |
| McPherson | 921 | 75.80% | 272 | 22.39% | 12 | 0.99% | 10 | 0.82% | 649 | 53.41% | 1,215 |
| Meade | 7,566 | 69.95% | 2,928 | 27.07% | 214 | 1.98% | 109 | 1.01% | 4,638 | 42.88% | 10,817 |
| Mellette | 381 | 49.54% | 375 | 48.76% | 5 | 0.65% | 8 | 1.04% | 6 | 0.78% | 769 |
| Miner | 636 | 55.79% | 479 | 42.02% | 18 | 1.58% | 7 | 0.61% | 157 | 13.77% | 1,140 |
| Minnehaha | 40,342 | 52.68% | 34,674 | 45.28% | 1,118 | 1.46% | 449 | 0.59% | 5,668 | 7.40% | 76,583 |
| Moody | 1,535 | 50.61% | 1,429 | 47.12% | 47 | 1.55% | 22 | 0.73% | 106 | 3.49% | 3,033 |
| Pennington | 28,232 | 63.49% | 15,125 | 34.02% | 816 | 1.84% | 291 | 0.65% | 13,107 | 29.47% | 44,464 |
| Perkins | 1,205 | 75.79% | 319 | 20.06% | 39 | 2.45% | 27 | 1.70% | 886 | 55.73% | 1,590 |
| Potter | 1,029 | 74.51% | 339 | 24.55% | 10 | 0.72% | 3 | 0.22% | 690 | 49.96% | 1,381 |
| Roberts | 1,883 | 44.24% | 2,302 | 54.09% | 42 | 0.99% | 29 | 0.68% | -419 | -9.85% | 4,256 |
| Sanborn | 688 | 61.70% | 389 | 34.89% | 22 | 1.97% | 16 | 1.43% | 299 | 26.81% | 1,115 |
| Shannon | 188 | 5.98% | 2,937 | 93.39% | 14 | 0.45% | 6 | 0.19% | -2,749 | -87.41% | 3,145 |
| Spink | 1,670 | 54.92% | 1,300 | 42.75% | 54 | 1.78% | 17 | 0.56% | 370 | 12.17% | 3,041 |
| Stanley | 1,063 | 69.03% | 435 | 28.25% | 33 | 2.14% | 9 | 0.58% | 628 | 40.78% | 1,540 |
| Sully | 613 | 74.94% | 186 | 22.74% | 16 | 1.96% | 3 | 0.37% | 427 | 52.20% | 818 |
| Todd | 498 | 19.94% | 1,976 | 79.13% | 11 | 0.44% | 12 | 0.48% | -1,478 | -59.19% | 2,497 |
| Tripp | 1,905 | 70.79% | 737 | 27.39% | 23 | 0.85% | 26 | 0.97% | 1,168 | 43.40% | 2,691 |
| Turner | 2,715 | 64.49% | 1,411 | 33.52% | 47 | 1.12% | 37 | 0.88% | 1,304 | 30.97% | 4,210 |
| Union | 4,698 | 61.85% | 2,782 | 36.62% | 81 | 1.07% | 35 | 0.46% | 1,916 | 25.23% | 7,596 |
| Walworth | 1,731 | 70.31% | 671 | 27.25% | 41 | 1.67% | 19 | 0.77% | 1,060 | 43.06% | 2,462 |
| Yankton | 5,495 | 55.09% | 4,226 | 42.37% | 199 | 2.00% | 54 | 0.54% | 1,269 | 12.72% | 9,974 |
| Ziebach | 314 | 41.26% | 439 | 57.69% | 6 | 0.79% | 2 | 0.26% | -125 | -16.43% | 761 |
| Totals | 210,610 | 57.89% | 145,039 | 39.87% | 5,795 | 1.59% | 2,371 | 0.65% | 65,571 | 18.02% | 363,815 |
| Democratic Hold | Republican Hold Gain from Democratic |
Counties that flipped from Democratic to Republican edit
- Brookings (largest city: Brookings)
- Brown (largest city: Aberdeen)
- Lake (largest city: Madison)
- Miner (largest city: Howard)
- Minnehaha (largest city: Sioux Falls)
- Moody (largest city: Flandreau)
By congressional district edit
South Dakota has only one congressional district because of its small population compared to other states. This district, called the At-Large district because it covers the entire state, is equivalent to the statewide election results.
| District | Romney | Obama | Representative |
|---|---|---|---|
| At-large | 57.89% | 39.87% | Kristi Noem |
See also edit
References edit
- ^ Jones, Jeffrey M. (February 2, 2012). "More States Move to GOP in 2011". Gallup. Retrieved November 27, 2020.
- ^ "2012 American Community Survey 1-Year Estimates". American FactFinder, U.S. Census Bureau. Archived from the original on February 12, 2020. Retrieved March 23, 2014.
- ^ Cochran, Laura (May 26, 2006). "Gun Ownership by State". The Washington Post. Retrieved November 27, 2020.
- ^ Cohen, Micah (August 24, 2012). "In South Dakota, Only the Farm Trumps Conservatism". FiveThirtyEight. Retrieved November 27, 2020.
- ^ "South Dakota - Election Results 2008 - The New York Times". www.nytimes.com. Retrieved November 27, 2020.
- ^ "Primary and Caucus Printable Calendar". CNN. Retrieved January 12, 2012.
- ^ "South Dakota Secretary of State". Retrieved December 9, 2012.
- ^ Our Campaigns; SD US Presidential Election Race, November 06, 2012
External links edit
- The Green Papers: for South Dakota
- The Green Papers: Major state elections in chronological order