


Summary
Elections to Essex County Council took place on 4 May 2017 as part of the 2017 local elections.[2] All 75 councillors were elected from 70 electoral divisions, which each returned either one or two councillors by first-past-the-post voting for a four-year term of office.
| |||||||||||||||||||||||||||||||||||||||||||||||||||||||||||||||||||||||||||||||||||||||||||||||||||||||||||||||||||||||||||||||||||||||||||||
All 75 seats to Essex County Council 38 seats needed for a majority | |||||||||||||||||||||||||||||||||||||||||||||||||||||||||||||||||||||||||||||||||||||||||||||||||||||||||||||||||||||||||||||||||||||||||||||
|---|---|---|---|---|---|---|---|---|---|---|---|---|---|---|---|---|---|---|---|---|---|---|---|---|---|---|---|---|---|---|---|---|---|---|---|---|---|---|---|---|---|---|---|---|---|---|---|---|---|---|---|---|---|---|---|---|---|---|---|---|---|---|---|---|---|---|---|---|---|---|---|---|---|---|---|---|---|---|---|---|---|---|---|---|---|---|---|---|---|---|---|---|---|---|---|---|---|---|---|---|---|---|---|---|---|---|---|---|---|---|---|---|---|---|---|---|---|---|---|---|---|---|---|---|---|---|---|---|---|---|---|---|---|---|---|---|---|---|---|---|---|
| Turnout | 31.1% ( | ||||||||||||||||||||||||||||||||||||||||||||||||||||||||||||||||||||||||||||||||||||||||||||||||||||||||||||||||||||||||||||||||||||||||||||
| |||||||||||||||||||||||||||||||||||||||||||||||||||||||||||||||||||||||||||||||||||||||||||||||||||||||||||||||||||||||||||||||||||||||||||||
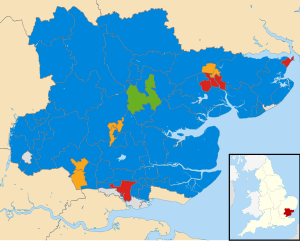 Map showing the results of the 2017 Essex County Council elections. | |||||||||||||||||||||||||||||||||||||||||||||||||||||||||||||||||||||||||||||||||||||||||||||||||||||||||||||||||||||||||||||||||||||||||||||
| |||||||||||||||||||||||||||||||||||||||||||||||||||||||||||||||||||||||||||||||||||||||||||||||||||||||||||||||||||||||||||||||||||||||||||||
The electoral divisions were the same as those used at the previous elections in 2009 and 2013. No elections were held in Thurrock or Southend-on-Sea, which are unitary authorities outside the area covered by the County Council.
Previous composition edit
2013 election edit
| Party | Seats | |
|---|---|---|
| Conservative | 42 | |
| UKIP | 9 | |
| Labour | 9 | |
| Liberal Democrats | 9 | |
| Green | 2 | |
| Tendring First | 1 | |
| Loughton Residents | 1 | |
| CIIP | 1 | |
| Independent | 1 | |
| Total | 75 | |
Composition of council seats before election edit
| Party | Seats | |
|---|---|---|
| Conservative | 44 | |
| Liberal Democrats | 9 | |
| Labour | 8 | |
| UKIP | 6 | |
| Green | 2 | |
| Loughton Residents | 1 | |
| CIIP | 1 | |
| R4U | 1 | |
| Holland Residents | 1 | |
| Independent | 1 | |
| Vacant | 1 | |
| Total | 75 | |
Changes between elections edit
In between the 2013 election and the 2017 election, the following council seats changed hands:
| Division | Date | Previous Party | New Party | Cause | Resulting Council Composition | ||||||||||||
|---|---|---|---|---|---|---|---|---|---|---|---|---|---|---|---|---|---|
| Con | UKIP | Lab | LDem | Grn | TF | LRes | CInd | Ind | R4U | HRA | |||||||
| Brightlingsea | 9 October 2014[3] | UKIP | Conservative | UKIP incumbent resigned. Conservatives won by-election. | 43 | 8 | 9 | 9 | 2 | 1 | 1 | 1 | 1 | 0 | 0 | ||
| Saffron Walden | 14 October 2014 | Independent | R4U | New Party Formed. | 43 | 8 | 9 | 9 | 2 | 1 | 1 | 1 | 0 | 1 | 0 | ||
| Basildon Westley Heights | 16 December 2014[4] | UKIP | Independent | Councillor quit party to sit as an independent member. | 43 | 7 | 9 | 9 | 2 | 1 | 1 | 1 | 1 | 1 | 0 | ||
| Bocking | 5 March 2015[5] | UKIP | Conservative | Sitting councillor died. Conservatives won by-election. | 44 | 6 | 9 | 9 | 2 | 1 | 1 | 1 | 1 | 1 | 0 | ||
| Tendring Rural East | 23 March 2016 [6] | UKIP | Independent | Councillor quit party to sit as an independent member. | 44 | 5 | 9 | 9 | 2 | 1 | 1 | 1 | 2 | 1 | 0 | ||
| Clacton East | 31 March 2016[7] | Tendring First | Holland Residents | Tendring First incumbent resigned. Holland-on-Sea Residents won by-election. | 44 | 5 | 9 | 9 | 2 | 0 | 1 | 1 | 2 | 1 | 1 | ||
| Laindon Park and Fryerns | 9 June 2016 [8] | Labour | UKIP | Sitting councillor died. UKIP won by-election. | 44 | 6 | 8 | 9 | 2 | 0 | 1 | 1 | 2 | 1 | 1 | ||
| Tendring Rural East | 28 July 2016 [9] | Independent | Conservative | Sitting councillor joined Conservatives. | 45 | 6 | 8 | 9 | 2 | 0 | 1 | 1 | 1 | 1 | 1 | ||
| Halstead | 5 December 2016 [10] | Conservative | Vacant | Sitting councillor died.[11] | 44 | 6 | 8 | 9 | 2 | 0 | 1 | 1 | 1 | 1 | 1 | ||
Summary edit
The election saw the Conservative Party retained overall control of the council, with an increased majority.
Results summary edit
| Party | Seats | Gains | Losses | Net gain/loss | Seats % | Votes % | Votes | +/− | |
|---|---|---|---|---|---|---|---|---|---|
| Conservative | 56 | 15 | 1 | +14 | 74.7 | 49.3 | 184,901 | +15.0 | |
| Labour | 6 | 1 | 4 | −3 | 8.0 | 16.9 | 63,470 | −0.5 | |
| Liberal Democrats | 7 | 0 | 2 | −2 | 9.3 | 13.7 | 51,524 | +2.8 | |
| Independent | 2 | 1 | 0 | +1 | 2.7 | 1.2 | 8,171 | +1.0 | |
| CIIP | 2 | 1 | 0 | +1 | 2.7 | 1.0 | 3,654 | +0.1 | |
| Green | 1 | 0 | 1 | −1 | 1.3 | 4.3 | 15,187 | −0.3 | |
| Loughton Residents | 1 | 0 | 0 | 1.3 | 0.8 | 2,824 | −0.3 | ||
| UKIP | 0 | 0 | 9 | −9 | 0.0 | 7.9 | 29,796 | −19.7 | |
| R4U | 0 | 0 | 1 | −1 | 0.0 | 1.4 | 5,231 | New | |
| Wickford Independents | 0 | 0 | 0 | 0.0 | 0.8 | 2,948 | New | ||
| Tendring First | 0 | 0 | 1 | 0.0 | 0.4 | 1,332 | −1.0 | ||
| BNP | 0 | 0 | 0 | 0.0 | 0.2 | 847 | −0.1 | ||
| South Woodham Ferrers Independents | 0 | 0 | 0 | 0.0 | 0.2 | 732 | 0.0 | ||
| Rayleigh Independents | 0 | 0 | 0 | 0.0 | 0.2 | 655 | New | ||
| English Democrat | 0 | 0 | 0 | 0.0 | 0.0 | 58 | −0.2 | ||
| Total | 75 | 372,834 | |||||||
Election of Group Leaders edit
David Finch (Hedingham) was re elected leader of the Conservative Group, with Kevin Bentley (Stanway and Pyefleet) as his deputy.
Michael Mackrory (Springfield) was re elected leader of the Liberal Democratic Group, with Anne Turrell (Mile End and Highwoods) as his deputy.
Ivan Henderson (Harwich) was re elected leader of the Labour Group, with Julie Young (Wivenhoe St Andrew) as his deputy.
Chris Pond (Loughton Central) was elected leader of the Non-Aligned Group with James Abbott (Witham Northern) as his deputy.
Election of Leader of the Council edit
David Finch the leader of the conservative group was duly elected leader of the council and formed a conservative administration.
Results by District edit
Basildon edit
| Party | Seats | +/- | Votes | % | +/- | |
|---|---|---|---|---|---|---|
| Conservative | 6 | 31,454 | 49.0 | +16.8 | ||
| Labour | 2 | 13,569 | 21.1 | −2.5 | ||
| Independent | 1 | 6,299 | 9.8 | +7.8 | ||
| UKIP | 0 | 8,327 | 13.0 | −20.4 | ||
| Liberal Democrat | 0 | 2,562 | 5.5 | +0.3 | ||
| Green | 0 | 701 | 1.1 | −1.6 | ||
Division Results
| Party | Candidate | Votes | % | ±% | |
|---|---|---|---|---|---|
| Independent | Kerry Smith * | 3,341 | 60.6 | New | |
| Conservative | Andrew Schrader | 1,329 | 24.1 | +1.9 | |
| Labour | Jack Ferguson | 546 | 9.9 | −10.4 | |
| Liberal Democrats | Benjamin Williams | 294 | 5.3 | −17.5 | |
| Majority | 2,012 | 36.5 | +33.5 | ||
| Turnout | 5,522 | 33.6 | +12.5 | ||
| Independent gain from UKIP | Swing | +31.3 | |||
| Party | Candidate | Votes | % | ±% | |
|---|---|---|---|---|---|
| Conservative | Anthony Hedley * | 6,223 | 69.6 | ||
| Conservative | Richard Moore | 5,623 | 62.9 | ||
| Labour | Santa Bennett | 1,082 | 12.1 | ||
| Liberal Democrats | Darren Kelliher | 926 | 10.4 | ||
| Labour | David Kirkman | 745 | 8.3 | ||
| Green | Oliver Alexander | 701 | 7.8 | ||
| Liberal Democrats | Clare Nice | 685 | 7.7 | ||
| UKIP | Kevin Piper | 628 | 7.0 | ||
| UKIP | Linda Allport-Hodge | 548 | 6.1 | ||
| Majority | 4,541 | 56.8 | |||
| Turnout | 8,951 | 32.6 | +6.5 | ||
| Conservative hold | Swing | +5.9 | |||
| Conservative hold | |||||
| Party | Candidate | Votes | % | ±% | |
|---|---|---|---|---|---|
| Conservative | Jeff Henry | 2,196 | 35.7 | ||
| Labour | Allan Davies | 2,154 | 35.1 | ||
| Conservative | Sandra Hillier | 2,077 | 33.8 | ||
| Labour | Adele Brown | 2,018 | 32.8 | ||
| UKIP | Derrick Fellowes | 1,405 | 22.9 | ||
| UKIP | Frank Ferguson * | 1,402 | 22.8 | ||
| Liberal Democrats | Elizabeth Grant | 317 | 5.2 | ||
| Liberal Democrats | Colin Grant | 296 | 4.8 | ||
| Majority | 77 | 1.3 | |||
| Turnout | 6,153 | 21.0 | +0.3 | ||
| Conservative gain from UKIP | Swing | +16.5 | |||
| Labour hold | |||||
Between 2013 and 2017, UKIP gained the Labour seat in a by-election, however it is shown as a hold as the comparison is made to the last full council election.
| Party | Candidate | Votes | % | ±% | |
|---|---|---|---|---|---|
| Conservative | Stephen Hillier | 2,654 | 37.8 | ||
| Labour | Patricia Reid | 2,605 | 37.1 | ||
| Labour | Paul Bishop | 2,452 | 34.9 | ||
| Conservative | Christopher Jackman | 2,313 | 32.9 | ||
| UKIP | Simon Breedon | 1,372 | 19.5 | ||
| UKIP | Stephen Ward | 1,113 | 15.8 | ||
| Liberal Democrats | Martin Howard | 351 | 5.0 | ||
| Liberal Democrats | Stephen Nice | 303 | 4.3 | ||
| BNP | Paul Borg | 161 | 2.3 | New | |
| BNP | Christine Winter | 126 | 1.8 | New | |
| Majority | 153 | 2.2 | |||
| Turnout | 7,037 | 22.2 | +2.2 | ||
| Conservative gain from Labour | Swing | +10.1 | |||
| Labour hold | |||||
| Party | Candidate | Votes | % | ±% | |
|---|---|---|---|---|---|
| Conservative | Tony Ball | 4,723 | 55.7 | ||
| Conservative | Malcolm Buckley * | 4,316 | 50.9 | ||
| Wickford Independents | David Harrison | 1,503 | 17.7 | New | |
| Wickford Independents | Eunice Brockman | 1,455 | 17.1 | New | |
| Labour | Louise Catling | 1,068 | 12.6 | ||
| UKIP | Mark Conroy | 1,009 | 11.9 | ||
| Labour | Peter Towler | 899 | 10.6 | ||
| UKIP | Anne Marie Waters | 850 | 10.0 | ||
| Liberal Democrats | David Radley | 390 | 4.6 | ||
| Majority | 2,813 | 33.2 | |||
| Turnout | 9,783 | 32.2 | +9.5 | ||
| Conservative hold | Swing | −0.0 | |||
| Conservative gain from UKIP | |||||
Braintree edit
| Party | Seats | +/- | Votes | % | +/- | |
|---|---|---|---|---|---|---|
| Conservative | 7 | 18,704 | 54.8 | +17.0 | ||
| Green | 1 | 3,527 | 10.3 | +2.2 | ||
| Labour | 0 | 6,264 | 18.3 | −3.4 | ||
| UKIP | 0 | 2,851 | 8.3 | −19.0 | ||
| Liberal Democrat | 0 | 2,792 | 8.2 | +3.7 | ||
Division Results
| Party | Candidate | Votes | % | ±% | |
|---|---|---|---|---|---|
| Conservative | Stephen Canning * | 2,143 | 55.3 | +23.1 | |
| Labour Co-op | Collette Gibson | 992 | 25.6 | −4.3 | |
| UKIP | Alan Rees | 367 | 9.5 | −23.2 | |
| Liberal Democrats | Barry Foskett | 218 | 5.6 | +3.4 | |
| Green | Poppy Gerrard-Abbott | 158 | 4.1 | +1.0 | |
| Majority | 1,151 | 29.7 | +29.2 | ||
| Turnout | 3,887 | 27.6 | −1.4 | ||
| Conservative gain from UKIP | Swing | +13.7 | |||
| Party | Candidate | Votes | % | ±% | |
|---|---|---|---|---|---|
| Conservative | Robert Mitchell * | 2,504 | 56.8 | +16.2 | |
| Labour | Moia Thorogood | 723 | 16.4 | −3.6 | |
| Liberal Democrats | Geoffrey Keig | 476 | 10.8 | +6.2 | |
| Green | Stephen Hicks | 429 | 9.7 | +3.8 | |
| UKIP | Norma Huxter | 275 | 6.2 | −21.6 | |
| Majority | 1,781 | 40.4 | +27.6 | ||
| Turnout | 4,412 | 32.9 | +3.5 | ||
| Conservative hold | Swing | +9.9 | |||
| Party | Candidate | Votes | % | ±% | |
|---|---|---|---|---|---|
| Conservative | Jean Schmitt | 1,922 | 51.4 | +18.6 | |
| Labour | Colin Riches | 1,067 | 28.6 | −3.3 | |
| UKIP | Sam Cowie | 338 | 9.0 | −18.1 | |
| Liberal Democrats | Laura Davies | 247 | 6.6 | +3.0 | |
| Green | Stephanie Bills | 163 | 4.4 | −0.1 | |
| Majority | 853 | 22.8 | +21.9 | ||
| Turnout | 3,741 | 26.0 | +0.8 | ||
| Conservative hold | Swing | +11.0 | |||
| Party | Candidate | Votes | % | ±% | |
|---|---|---|---|---|---|
| Conservative | Jo Beavis | 2,604 | 59.3 | +19.7 | |
| Labour | Garry Warren | 871 | 19.8 | −2.3 | |
| UKIP | Anthony Felton | 338 | 7.7 | −20.6 | |
| Liberal Democrats | Mark Jarman-Howe | 324 | 7.4 | +3.3 | |
| Green | Jenny Bishop | 230 | 5.2 | +0.3 | |
| BNP | Paul Hooks | 23 | 0.5 | −0.6 | |
| Majority | 1,733 | 39.5 | +28.3 | ||
| Turnout | 4,396 | 28.6 | +2.2 | ||
| Conservative hold | Swing | +11.0 | |||
| Party | Candidate | Votes | % | ±% | |
|---|---|---|---|---|---|
| Conservative | David Finch * | 3,222 | 64.9 | +16.2 | |
| Labour Co-op | Bill Edwards | 592 | 11.9 | −1.0 | |
| Liberal Democrats | Steve Bolter | 541 | 10.9 | +2.9 | |
| UKIP | David Huxter | 371 | 7.5 | −16.9 | |
| Green | Dawn Holmes | 242 | 4.9 | −0.1 | |
| Majority | 2,630 | 52.9 | +28.6 | ||
| Turnout | 4,985 | 34.1 | +2.8 | ||
| Conservative hold | Swing | +8.6 | |||
| Party | Candidate | Votes | % | ±% | |
|---|---|---|---|---|---|
| Conservative | Graham Butland * | 2,545 | 63.0 | +15.3 | |
| Labour | Juliet Walton | 486 | 12.0 | −1.7 | |
| Liberal Democrats | Graham Sheppard | 404 | 10.0 | +5.6 | |
| UKIP | Sean Carter | 319 | 7.9 | −20.2 | |
| Green | Bob Wright | 286 | 7.1 | +1.0 | |
| Majority | 2,059 | 51.0 | +31.4 | ||
| Turnout | 4,041 | 33.0 | +5.3 | ||
| Conservative hold | Swing | +8.5 | |||
| Party | Candidate | Votes | % | ±% | |
|---|---|---|---|---|---|
| Green | James Abbott * | 1,743 | 37.9 | +11.5 | |
| Conservative | Tom Cunningham | 1,650 | 35.8 | +11.4 | |
| Labour Co-op | Philip Barlow | 722 | 15.7 | −4.9 | |
| UKIP | David Hodges | 343 | 7.5 | −17.5 | |
| Liberal Democrats | Mark Scott | 145 | 3.2 | +0.4 | |
| Majority | 93 | 2.0 | +0.7 | ||
| Turnout | 4,616 | 32.6 | +0.3 | ||
| Green hold | Swing | +0.0 | |||
| Party | Candidate | Votes | % | ±% | |
|---|---|---|---|---|---|
| Conservative | Derrick Louis * | 2,114 | 51.1 | +13.3 | |
| Labour | Antony Gore | 811 | 19.6 | −4.0 | |
| UKIP | Christopher Darbon | 500 | 12.1 | −13.1 | |
| Liberal Democrats | Barry Fleet | 437 | 10.6 | +4.8 | |
| Green | Philip Hughes | 276 | 6.7 | +0.5 | |
| Majority | 1,303 | 31.5 | +18.9 | ||
| Turnout | 4,143 | 27.0 | +1.2 | ||
| Conservative hold | Swing | +8.7 | |||
Brentwood edit
| Party | Seats | +/- | Votes | % | +/- | |
|---|---|---|---|---|---|---|
| Conservative | 2 | 10,303 | 53.0 | +16.3 | ||
| Liberal Democrat | 2 | 6,042 | 31.1 | +5.7 | ||
| Labour | 0 | 1,690 | 8.7 | −0.4 | ||
| Green | 0 | 713 | 3.7 | +0.7 | ||
| UKIP | 0 | 694 | 3.6 | −22.1 | ||
Division Results
| Party | Candidate | Votes | % | ±% | |
|---|---|---|---|---|---|
| Conservative | Louise McKinlay | 3,533 | 72.1 | +24.1 | |
| Liberal Democrats | Dominic Naylor | 629 | 12.8 | +4.6 | |
| Labour | Emma Benson | 502 | 10.2 | +0.0 | |
| Green | Alistair Stephen | 235 | 4.8 | +1.2 | |
| Majority | 2,904 | 59.3 | +11.3 | ||
| Turnout | 4,919 | 32.0 | +4.1 | ||
| Conservative hold | Swing | +9.8 | |||
| Party | Candidate | Votes | % | ±% | |
|---|---|---|---|---|---|
| Liberal Democrats | Barry Aspinell * | 2,522 | 51.0 | +7.8 | |
| Conservative | John Kerslake | 1,746 | 35.3 | +7.9 | |
| Labour | Michele Wigram | 297 | 6.0 | −0.2 | |
| UKIP | Bryan Finegan | 270 | 5.5 | −14.8 | |
| Green | Wendy Stephen | 106 | 2.1 | −0.6 | |
| Majority | 776 | 15.7 | −0.1 | ||
| Turnout | 4,948 | 34.5 | +4.6 | ||
| Liberal Democrats hold | Swing | −0.1 | |||
| Party | Candidate | Votes | % | ±% | |
|---|---|---|---|---|---|
| Conservative | Lesley Wagland | 3,320 | 65.5 | +16.0 | |
| Liberal Democrats | Darryl Sankey | 804 | 15.9 | +13.0 | |
| UKIP | Alison Heales | 424 | 8.4 | −29.8 | |
| Labour | Tim Barrett | 349 | 6.9 | −1.3 | |
| Green | Paul Jeater | 174 | 3.4 | +0.4 | |
| Majority | 2,516 | 49.6 | +39.5 | ||
| Turnout | 5,075 | 35.2 | +6.1 | ||
| Conservative hold | Swing | +1.5 | |||
| Party | Candidate | Votes | % | ±% | |
|---|---|---|---|---|---|
| Liberal Democrats | David Kendall * | 2,087 | 46.1 | +7.2 | |
| Conservative | Andy Wiles | 1,704 | 37.6 | +10.9 | |
| Labour | Gareth Barrett | 542 | 12.0 | −0.8 | |
| Green | John Hamilton | 198 | 4.4 | +1.8 | |
| Majority | 383 | 8.5 | −3.7 | ||
| Turnout | 4,545 | 30.6 | +2.1 | ||
| Liberal Democrats hold | Swing | −1.9 | |||
Castle Point edit
| Party | Seats | +/- | Votes | % | +/- | |
|---|---|---|---|---|---|---|
| Conservative | 3 | 10,990 | 54.2 | +20.8 | ||
| CIIP | 2 | 3,654 | 18.0 | +3.5 | ||
| Labour | 0 | 2,635 | 13.0 | −0.4 | ||
| UKIP | 0 | 2,286 | 11.3 | −22.4 | ||
| Liberal Democrat | 0 | 506 | 2.5 | +0.9 | ||
| Green | 0 | 214 | 1.1 | −0.2 | ||
Division Results
| Party | Candidate | Votes | % | ±% | |
|---|---|---|---|---|---|
| CIIP | Dave Blackwell * | 1,976 | 47.3 | +3.0 | |
| Conservative | Chas Mumford | 1,359 | 32.5 | +17.0 | |
| UKIP | Sam Aubrey | 482 | 11.5 | −17.2 | |
| Labour | Maggie McArthur-Curtis | 319 | 7.6 | −1.3 | |
| Liberal Democrats | Paul Chaplin | 46 | 1.1 | +0.5 | |
| Majority | 617 | 14.8 | −0.8 | ||
| Turnout | 4,381 | 29.0 | +2.6 | ||
| CIIP hold | Swing | −7.0 | |||
| Party | Candidate | Votes | % | ±% | |
|---|---|---|---|---|---|
| CIIP | Peter May | 1,678 | 49.8 | +21.2 | |
| Conservative | Jay Blissett | 1,342 | 39.8 | +2.7 | |
| Labour | Jackie Reilly | 336 | 10.0 | +2.1 | |
| Liberal Democrats | Ian Gale | 15 | 0.4 | −0.3 | |
| Majority | 336 | 10.0 | +1.5 | ||
| Turnout | 3,371 | 24.6 | −1.7 | ||
| CIIP gain from Conservative | Swing | +9.2 | |||
| Party | Candidate | Votes | % | ±% | |
|---|---|---|---|---|---|
| Conservative | Jill Reeves * | 3,063 | 66.2 | +21.5 | |
| UKIP | Brian Lee | 560 | 12.1 | −21.5 | |
| Labour | Lee Dorrington | 550 | 11.9 | −0.6 | |
| Liberal Democrats | Geoff Duff | 241 | 5.2 | +2.1 | |
| Green | Douglas Copping | 214 | 4.6 | −1.4 | |
| Majority | 2,503 | 54.1 | +43.0 | ||
| Turnout | 4,636 | 33.0 | +3.0 | ||
| Conservative hold | Swing | +21.5 | |||
| Party | Candidate | Votes | % | ±% | |
|---|---|---|---|---|---|
| Conservative | Andrew Sheldon | 2,820 | 64.4 | +28.4 | |
| UKIP | Alan Bayley * | 711 | 16.2 | −25.7 | |
| Labour | Jack Rawlings | 644 | 14.7 | −4.4 | |
| Liberal Democrats | Francesca Sawle | 202 | 4.6 | +2.5 | |
| Majority | 2,109 | 48.2 | +42.3 | ||
| Turnout | 4,386 | 32.6 | +1.4 | ||
| Conservative gain from UKIP | Swing | +27.0 | |||
| Party | Candidate | Votes | % | ±% | |
|---|---|---|---|---|---|
| Conservative | Beverly Egan | 2,406 | 64.6 | +31.0 | |
| Labour | Joe Cooke | 786 | 21.1 | +2.5 | |
| UKIP | Sharon Ainsley | 533 | 14.3 | −25.5 | |
| Majority | 1,620 | 43.5 | +37.3 | ||
| Turnout | 3,733 | 30.5 | +2.8 | ||
| Conservative gain from UKIP | Swing | +28.2 | |||
Chelmsford edit
| Party | Seats | +/- | Votes | % | +/- | |
|---|---|---|---|---|---|---|
| Conservative | 6 | 20,220 | 44.0 | +11.4 | ||
| Liberal Democrat | 3 | 11,817 | 25.7 | +6.4 | ||
| Labour | 0 | 4,058 | 8.8 | −1.6 | ||
| UKIP | 0 | 2,235 | 4.9 | −18.5 | ||
| Independent | 0 | 1,786 | 3.9 | +2.0 | ||
| Green | 0 | 1,372 | 3.0 | -0.7 | ||
Division Results
| Party | Candidate | Votes | % | ±% | |
|---|---|---|---|---|---|
| Conservative | John Aldridge * | 2,916 | 54.2 | +10.4 | |
| Independent | Wendy Daden | 959 | 17.8 | New | |
| Liberal Democrats | Julia Frascona | 894 | 16.6 | +4.0 | |
| Labour | Connor Woolner | 423 | 7.9 | −0.7 | |
| Green | Reza Hossain | 184 | 3.4 | −0.7 | |
| Majority | 1,957 | 36.4 | +22.3 | ||
| Turnout | 5,387 | 35.9 | +5.9 | ||
| Conservative hold | Swing | −3.7 | |||
| Party | Candidate | Votes | % | ±% | |
|---|---|---|---|---|---|
| Conservative | John Spence * | 3,184 | 64.3 | +15.3 | |
| Liberal Democrats | Natacha Dudley | 746 | 15.1 | +4.8 | |
| Labour | Sandra Massey | 471 | 9.5 | −1.7 | |
| UKIP | Jesse Pryke | 316 | 6.4 | −18.3 | |
| Green | Colin Budgey | 237 | 4.8 | −0.1 | |
| Majority | 2,438 | 49.2 | +24.9 | ||
| Turnout | 4,960 | 30.6 | +5.1 | ||
| Conservative hold | Swing | +5.2 | |||
| Party | Candidate | Votes | % | ±% | |
|---|---|---|---|---|---|
| Conservative | Dick Madden * | 1,823 | 42.5 | +6.7 | |
| Liberal Democrats | Marie Goldman | 1,617 | 37.7 | +11.7 | |
| Labour | Edward Massey | 506 | 11.8 | −0.7 | |
| UKIP | John Theedom | 180 | 4.2 | −16.5 | |
| Green | Tony Lane | 165 | 3.8 | −1.3 | |
| Majority | 206 | 4.8 | −5.0 | ||
| Turnout | 4,292 | 33.3 | +5.1 | ||
| Conservative hold | Swing | −2.5 | |||
| Party | Candidate | Votes | % | ±% | |
|---|---|---|---|---|---|
| Liberal Democrats | Stephen Robinson * | 2,194 | 47.0 | +9.6 | |
| Conservative | Mike Holoway | 1,635 | 35.0 | +13.0 | |
| Labour | David Howell | 466 | 10.0 | −4.9 | |
| UKIP | Thomas Jones | 243 | 5.2 | −16.3 | |
| Green | Keith Wiffen | 131 | 2.8 | −1.4 | |
| Majority | 559 | 12.0 | −3.4 | ||
| Turnout | 4,676 | 34.3 | +5.2 | ||
| Liberal Democrats hold | Swing | −1.7 | |||
| Party | Candidate | Votes | % | ±% | |
|---|---|---|---|---|---|
| Liberal Democrats | Jude Deakin * | 1,735 | 39.1 | +10.5 | |
| Conservative | Graham Seeley | 1,534 | 34.6 | +8.7 | |
| Labour Co-op | Richard Hyland | 757 | 17.1 | +2.2 | |
| UKIP | Nigel Carter | 284 | 6.4 | −18.9 | |
| Green | Natalie Seaman | 129 | 2.9 | −0.4 | |
| Majority | 201 | 4.5 | +1.7 | ||
| Turnout | 4,450 | 29.7 | +3.8 | ||
| Liberal Democrats hold | Swing | +0.9 | |||
| Party | Candidate | Votes | % | ±% | |
|---|---|---|---|---|---|
| Conservative | Jenny Chandler * | 2,306 | 46.7 | +15.5 | |
| Liberal Democrats | Chris Shaw | 1,718 | 34.8 | +9.0 | |
| Labour | Chris Vince | 422 | 8.5 | −1.7 | |
| UKIP | Jeanette Howes | 360 | 7.3 | −22.3 | |
| Green | Liz Carlton | 134 | 2.7 | −0.6 | |
| Majority | 588 | 11.9 | +10.3 | ||
| Turnout | 4,939 | 31.3 | +2.0 | ||
| Conservative hold | Swing | +3.3 | |||
| Party | Candidate | Votes | % | ±% | |
|---|---|---|---|---|---|
| Conservative | Bob Massey | 1,554 | 45.7 | +11.9 | |
| SWFCTA | Jackie Birch | 732 | 21.5 | −7.1 | |
| UKIP | Kyle Jannece | 566 | 16.6 | −4.5 | |
| Labour | Mike Robertson | 185 | 5.4 | −5.5 | |
| Liberal Democrats | Noel Sutcliffe | 142 | 4.2 | +0.6 | |
| Independent | Chris Cheater | 117 | 3.4 | New | |
| Green | David Rey | 106 | 3.1 | +1.2 | |
| Majority | 822 | 24.2 | +19.1 | ||
| Turnout | 3,417 | 27.3 | +6.6 | ||
| Conservative hold | Swing | +9.5 | |||
| Party | Candidate | Votes | % | ±% | |
|---|---|---|---|---|---|
| Liberal Democrats | Mike Mackrory * | 2,464 | 46.1 | +10.6 | |
| Conservative | Jean Murray | 1,991 | 37.2 | +7.9 | |
| Labour | Russell Kennedy | 480 | 9.0 | −1.4 | |
| UKIP | Mark Gough | 286 | 5.3 | −14.6 | |
| Green | Angela Thompson | 126 | 2.4 | −2.4 | |
| Majority | 473 | 8.8 | +2.7 | ||
| Turnout | 5,353 | 33.9 | +2.2 | ||
| Liberal Democrats hold | Swing | +1.4 | |||
| Party | Candidate | Votes | % | ±% | |
|---|---|---|---|---|---|
| Conservative | Ian Grundy * | 3,277 | 68.2 | +19.9 | |
| Independent | Paul Clark | 710 | 14.8 | New | |
| Labour | Elaine Baldwin | 348 | 7.2 | −1.1 | |
| Liberal Democrats | Tom Willis | 307 | 6.4 | +2.3 | |
| Green | Steve Betteridge | 160 | 3.3 | −0.7 | |
| Majority | 2,567 | 53.5 | +40.4 | ||
| Turnout | 4,824 | 33.8 | +3.0 | ||
| Conservative hold | Swing | +2.6 | |||
Colchester edit
| Party | Seats | +/- | Votes | % | +/- | |
|---|---|---|---|---|---|---|
| Conservative | 4 | 18,568 | 42.3 | +12.8 | ||
| Labour | 3 | 9,078 | 20.7 | +0.8 | ||
| Liberal Democrat | 2 | 10,646 | 24.2 | +2.7 | ||
| Green | 0 | 2,402 | 5.5 | −1.2 | ||
| UKIP | 0 | 1,869 | 4.3 | −16.2 | ||
| Independent | 0 | 1,373 | 3.1 | New | ||
Division Results
| Party | Candidate | Votes | % | ±% | |
|---|---|---|---|---|---|
| Labour | Lee Scordis | 1,624 | 32.1 | +17.0 | |
| Liberal Democrats | Lyn Barton | 1,469 | 29.0 | −8.0 | |
| Conservative | Daniel Ellis | 1,290 | 25.5 | +14.0 | |
| Green | Mark Goacher | 466 | 9.2 | −4.4 | |
| UKIP | Ron Levy | 218 | 4.3 | −18.5 | |
| Majority | 155 | 3.1 | −11.1 | ||
| Turnout | 5,074 | 29.2 | +8.1 | ||
| Labour gain from Liberal Democrats | Swing | +12.5 | |||
| Party | Candidate | Votes | % | ±% | |
|---|---|---|---|---|---|
| Conservative | Anne Brown * | 3,688 | 68.6 | +24.8 | |
| Liberal Democrats | Thomas Stevenson | 725 | 13.5 | +7.1 | |
| Labour | Ian Yates | 552 | 10.3 | −0.4 | |
| Green | Blake Roberts | 413 | 7.7 | −0.5 | |
| Majority | 2,963 | 55.1 | +42.4 | ||
| Turnout | 5,393 | 36.2 | +4.6 | ||
| Conservative hold | Swing | +8.9 | |||
| Party | Candidate | Votes | % | ±% | |
|---|---|---|---|---|---|
| Conservative | Sue Lissimore * | 3,330 | 58.3 | +18.2 | |
| Liberal Democrats | William Glanville | 1,279 | 22.4 | −0.7 | |
| Labour | Sioux Blair-Jordan | 594 | 10.4 | −0.4 | |
| Green | Robbie Spence | 303 | 5.3 | −1.1 | |
| UKIP | Diane Baker | 202 | 3.5 | −16.0 | |
| Majority | 2,051 | 35.9 | +18.9 | ||
| Turnout | 5,714 | 41.1 | +5.7 | ||
| Conservative hold | Swing | +9.5 | |||
| Party | Candidate | Votes | % | ±% | |
|---|---|---|---|---|---|
| Labour | Dave Harris * | 2,178 | 51.5 | +7.5 | |
| Conservative | Pauline Hazell | 1,166 | 27.6 | +15.0 | |
| Liberal Democrats | Martin Goss | 600 | 14.2 | −10.4 | |
| UKIP | Bruno Hickman | 192 | 4.5 | −10.6 | |
| Green | Laura Pountney | 96 | 2.3 | −1.5 | |
| Majority | 1,012 | 23.9 | +4.6 | ||
| Turnout | 4,237 | 28.3 | +1.4 | ||
| Labour hold | Swing | −3.7 | |||
| Party | Candidate | Votes | % | ±% | |
|---|---|---|---|---|---|
| Conservative | John Jowers * | 2,555 | 49.0 | +2.0 | |
| Independent | John Akker | 1,058 | 20.3 | New | |
| Labour | Bry Mogridge | 533 | 10.2 | −5.2 | |
| UKIP | David Broise | 474 | 9.1 | −18.8 | |
| Liberal Democrats | Jo Hayes | 317 | 6.1 | +1.6 | |
| Green | Peter Banks | 281 | 5.4 | +0.1 | |
| Majority | 1,497 | 28.7 | +9.6 | ||
| Turnout | 5,227 | 36.4 | +8.4 | ||
| Conservative hold | Swing | −9.1 | |||
| Party | Candidate | Votes | % | ±% | |
|---|---|---|---|---|---|
| Liberal Democrats | Anne Turrell * | 2,104 | 46.5 | +7.3 | |
| Conservative | Thomas Rowe | 1,549 | 34.2 | +9.7 | |
| Labour | Michael Wagstaff | 464 | 10.3 | −1.0 | |
| Green | Amanda Kirke | 207 | 4.6 | −0.4 | |
| UKIP | Alex Knupffer | 200 | 4.4 | −15.6 | |
| Majority | 555 | 12.3 | −2.3 | ||
| Turnout | 4,534 | 29.5 | +5.2 | ||
| Liberal Democrats hold | Swing | −1.2 | |||
| Party | Candidate | Votes | % | ±% | |
|---|---|---|---|---|---|
| Liberal Democrats | John Baker | 1,885 | 43.3 | +6.7 | |
| Conservative | Darius Laws | 1,486 | 34.1 | +16.4 | |
| Labour | Judy Short | 514 | 11.8 | −2.4 | |
| UKIP | Jason Berry | 294 | 6.7 | −19.2 | |
| Green | Robert Brannan | 179 | 4.1 | −1.5 | |
| Majority | 399 | 9.2 | −1.5 | ||
| Turnout | 4,365 | 34.6 | +8.2 | ||
| Liberal Democrats hold | Swing | −4.9 | |||
| Party | Candidate | Votes | % | ±% | |
|---|---|---|---|---|---|
| Conservative | Kevin Bentley * | 2,842 | 54.9 | +14.1 | |
| Liberal Democrats | Jessica Scott-Boutell | 1,190 | 23.0 | +3.4 | |
| Labour | Alan Mogridge | 565 | 10.9 | −0.7 | |
| UKIP | John Pitts | 289 | 5.6 | −16.4 | |
| Green | Susan Allen | 287 | 5.5 | −0.4 | |
| Majority | 1,652 | 31.9 | +13.1 | ||
| Turnout | 5,181 | 35.7 | +6.2 | ||
| Conservative hold | Swing | +5.4 | |||
| Party | Candidate | Votes | % | ±% | |
|---|---|---|---|---|---|
| Labour | Julie Young * | 2,054 | 48.0 | −3.4 | |
| Liberal Democrats | Mark Cory | 1,077 | 25.2 | +14.8 | |
| Conservative | Michael McDonnell | 662 | 15.5 | +0.2 | |
| Independent | Chris Hill | 315 | 7.4 | New | |
| Green | Janita Le Fevre | 170 | 4.0 | −2.8 | |
| Majority | 977 | 22.8 | −12.4 | ||
| Turnout | 4,279 | 36.6 | +10.0 | ||
| Labour hold | Swing | −9.1 | |||
Epping Forest edit
| Party | Seats | +/- | Votes | % | +/- | |
|---|---|---|---|---|---|---|
| Conservative | 6 | 15,695 | 55.1 | +19.1 | ||
| Loughton Residents | 1 | 2,824 | 9.9 | −3.4 | ||
| Liberal Democrat | 0 | 4,445 | 15.6 | +5.7 | ||
| Labour | 0 | 3,071 | 10.8 | +2.3 | ||
| Green | 0 | 1,418 | 5.0 | +0.7 | ||
| UKIP | 0 | 994 | 3.5 | −23.2 | ||
| English Democrat | 0 | 58 | 0.2 | −0.2 | ||
Division Results
| Party | Candidate | Votes | % | ±% | |
|---|---|---|---|---|---|
| Conservative | Valerie Metcalfe * | 2,742 | 56.5 | +20.7 | |
| Green | Simon Heap | 1,093 | 22.5 | +15.3 | |
| Liberal Democrats | Joseph Barkham | 549 | 11.3 | +5.9 | |
| Labour | Jason Phillips | 466 | 9.6 | +1.8 | |
| Majority | 1,649 | 34.0 | +22.0 | ||
| Turnout | 4,872 | 30.3 | +3.3 | ||
| Conservative hold | Swing | +2.7 | |||
| Party | Candidate | Votes | % | ±% | |
|---|---|---|---|---|---|
| Conservative | Gagan Mohindra | 2,033 | 65.7 | +27.7 | |
| Liberal Democrats | Joanne Alexander-Sefre | 545 | 17.6 | +14.5 | |
| Labour | Mich Diamond-Conway | 518 | 16.7 | +6.2 | |
| Majority | 1,488 | 48.0 | +42.6 | ||
| Turnout | 3,120 | 22.4 | +0.1 | ||
| Conservative hold | Swing | +6.6 | |||
| Party | Candidate | Votes | % | ±% | |
|---|---|---|---|---|---|
| Conservative | Christopher Whitbread | 2,419 | 45.5 | +16.6 | |
| Liberal Democrats | Jon Whitehouse * | 2,275 | 42.8 | +5.0 | |
| Labour | Simon Bullough | 353 | 6.6 | +1.2 | |
| UKIP | Barry Johns | 264 | 5.0 | −19.4 | |
| Majority | 144 | 2.7 | −6.2 | ||
| Turnout | 5,319 | 38.7 | +5.7 | ||
| Conservative gain from Liberal Democrats | Swing | +5.8 | |||
| Party | Candidate | Votes | % | ±% | |
|---|---|---|---|---|---|
| Loughton Residents | Chris Pond * | 2,824 | 69.3 | +8.6 | |
| Conservative | Jonathan Hunter | 801 | 19.7 | +7.5 | |
| Labour | Angela Ayre | 328 | 8.1 | New | |
| Liberal Democrats | Paul Rissbrook | 121 | 3.0 | +0.7 | |
| Majority | 2,023 | 49.7 | +8.2 | ||
| Turnout | 4,080 | 28.8 | +5.7 | ||
| Loughton Residents hold | Swing | +0.5 | |||
| Party | Candidate | Votes | % | ±% | |
|---|---|---|---|---|---|
| Conservative | Anthony Jackson * | 3,081 | 78.5 | +30.9 | |
| Labour | Stefan Mullard | 500 | 12.7 | +0.7 | |
| Liberal Democrats | Arnold Verrall | 346 | 8.8 | +6.4 | |
| Majority | 2,581 | 65.7 | +51.5 | ||
| Turnout | 3,953 | 27.4 | +2.7 | ||
| Conservative hold | Swing | +15.1 | |||
| Party | Candidate | Votes | % | ±% | |
|---|---|---|---|---|---|
| Conservative | Maggie McEwen * | 2,336 | 68.2 | +17.3 | |
| Liberal Democrats | Brian Surtees | 432 | 12.6 | +6.2 | |
| Labour Co-op | Liam Preston | 316 | 9.2 | −0.2 | |
| UKIP | Lawrence Mendoza | 282 | 8.2 | −17.3 | |
| English Democrat | Robin Tilbrook | 58 | 1.7 | −1.5 | |
| Majority | 1,904 | 55.6 | +30.1 | ||
| Turnout | 3,429 | 27.7 | +3.4 | ||
| Conservative hold | Swing | +5.5 | |||
| Party | Candidate | Votes | % | ±% | |
|---|---|---|---|---|---|
| Conservative | Ricki Gadsby * | 2,283 | 59.7 | +19.0 | |
| Labour | Robert Greyson | 590 | 15.4 | +0.5 | |
| UKIP | Ron McEvoy | 448 | 11.7 | −24.4 | |
| Green | Dave Plummer | 325 | 8.5 | +5.9 | |
| Liberal Democrats | Timothy Vaughan | 177 | 4.6 | +1.7 | |
| Majority | 1,693 | 44.3 | +39.7 | ||
| Turnout | 3,833 | 22.8 | +2.3 | ||
| Conservative hold | Swing | +9.2 | |||
Harlow edit
| Party | Seats | +/- | Votes | % | +/- | |
|---|---|---|---|---|---|---|
| Conservative | 4 | 12,722 | 50.5 | +23.9 | ||
| Labour | 0 | 10,303 | 40.9 | +4.4 | ||
| Liberal Democrat | 0 | 1,217 | 4.8 | +1.2 | ||
| Green | 0 | 966 | 3.8 | +0.9 | ||
Division Results
| Party | Candidate | Votes | % | ±% | |
|---|---|---|---|---|---|
| Conservative | Michael Garnett | 2,512 | 51.0 | +23.2 | |
| Labour | Michael Danvers * | 2,036 | 41.3 | +4.3 | |
| Liberal Democrats | Lesley Rideout | 379 | 7.7 | +3.1 | |
| Majority | 476 | 9.7 | +0.5 | ||
| Turnout | 4,927 | 29.1 | +2.5 | ||
| Conservative gain from Labour | Swing | +9.4 | |||
| Party | Candidate | Votes | % | ±% | |
|---|---|---|---|---|---|
| Conservative | Eddie Johnson * | 2,468 | 58.0 | +25.5 | |
| Labour | Eugenie Harvey | 1,495 | 35.1 | +3.1 | |
| Liberal Democrats | Christopher Robins | 293 | 6.9 | +3.7 | |
| Majority | 973 | 22.9 | +22.4 | ||
| Turnout | 4,256 | 28.7 | +1.3 | ||
| Conservative hold | Swing | +11.2 | |||
| Party | Candidate | Votes | % | ±% | |
|---|---|---|---|---|---|
| Conservative | Michael Hardware | 3,940 | 46.7 | ||
| Conservative | Clive Souter | 3,802 | 45.1 | ||
| Labour | Karen Clempner * | 3,457 | 41.0 | ||
| Labour | Tony Durcan * | 3,315 | 39.3 | ||
| Green | Hannah Clare | 561 | 6.7 | ||
| Green | James Aicken | 405 | 4.8 | ||
| Liberal Democrats | Christopher Millington | 297 | 3.5 | ||
| Liberal Democrats | Robert Thurston | 248 | 2.9 | ||
| Majority | 345 | 4.1 | |||
| Turnout | 16,025 | 28.3 | +4.5 | ||
| Conservative gain from Labour | Swing | +8.8 | |||
| Conservative gain from Labour | |||||
Maldon edit
| Party | Seats | +/- | Votes | % | +/- | |
|---|---|---|---|---|---|---|
| Conservative | 3 | 8,400 | 53.7 | +9.2 | ||
| Labour | 0 | 1,753 | 11.2 | −3.6 | ||
| UKIP | 0 | 1,514 | 9.7 | −19.8 | ||
| Independent | 0 | 1,498 | 9.6 | New | ||
| Liberal Democrat | 0 | 1,210 | 7.7 | New | ||
| Green | 0 | 731 | 4.7 | −3.8 | ||
| BNP | 0 | 537 | 3.4 | +0.6 | ||
Division Results
| Party | Candidate | Votes | % | ±% | |
|---|---|---|---|---|---|
| Conservative | Mark Durham | 2,965 | 57.9 | +11.6 | |
| Labour | Keith Miller | 547 | 10.7 | −5.9 | |
| UKIP | Andrew Francis | 450 | 8.8 | −15.4 | |
| Liberal Democrats | Richard Lee | 434 | 8.5 | New | |
| BNP | Richard Perry | 422 | 8.2 | +3.6 | |
| Green | Edwyn Gerrard-Abbott | 304 | 6.0 | −2.5 | |
| Majority | 2,418 | 47.2 | +26.1 | ||
| Turnout | 5,122 | 31.5 | +0.4 | ||
| Conservative hold | Swing | +8.7 | |||
| Party | Candidate | Votes | % | ±% | |
|---|---|---|---|---|---|
| Conservative | Penny Channer * | 2,865 | 60.3 | +12.6 | |
| Labour | Lee Rigby | 680 | 14.3 | +0.6 | |
| Liberal Democrats | Neil Babbage | 533 | 11.2 | New | |
| UKIP | Tim Drain | 310 | 6.5 | −18.3 | |
| Green | Benjamin Finn | 246 | 5.2 | −6.0 | |
| BNP | Trevor Cable | 115 | 2.4 | +0.3 | |
| Majority | 2,185 | 46.0 | +23.4 | ||
| Turnout | 4,749 | 31.8 | +3.1 | ||
| Conservative hold | Swing | +6.0 | |||
| Party | Candidate | Votes | % | ±% | |
|---|---|---|---|---|---|
| Conservative | Ron Pratt | 2,570 | 44.5 | +4.7 | |
| Independent | Wendy Stamp | 1,498 | 26.0 | New | |
| UKIP | Beverly Acevedo | 754 | 13.1 | −25.8 | |
| Labour | Leslie McDonald | 526 | 9.1 | −4.8 | |
| Liberal Democrats | Ray Kay | 243 | 4.2 | New | |
| Green | Peter Lote | 181 | 3.1 | −2.9 | |
| Majority | 1,072 | 18.5 | +17.7 | ||
| Turnout | 5,772 | 31.7 | +5.5 | ||
| Conservative hold | Swing | −10.6 | |||
Rochford edit
| Party | Seats | +/- | Votes | % | +/- | |
|---|---|---|---|---|---|---|
| Conservative | 5 | 10,073 | 46.7 | +11.7 | ||
| UKIP | 0 | 2,700 | 12.5 | −15.7 | ||
| Labour | 0 | 2,318 | 10.7 | −2.4 | ||
| Liberal Democrat | 0 | 2,275 | 10.5 | −0.8 | ||
| Green | 0 | 1,996 | 9.2 | +0.4 | ||
| Rochford Residents | 0 | 1,400 | 6.5 | New | ||
| Rayleigh Independents | 0 | 655 | 3.0 | New | ||
| Independent | 0 | 173 | 0.8 | New | ||
Division Results
| Party | Candidate | Votes | % | ±% | |
|---|---|---|---|---|---|
| Conservative | Malcolm Maddocks * | 2,122 | 44.7 | +12.3 | |
| Liberal Democrats | Christopher Black | 1,462 | 30.8 | +5.6 | |
| UKIP | John Hayter | 835 | 17.6 | −2.6 | |
| Labour | Roger Neville | 331 | 7.0 | +0.7 | |
| Majority | 660 | 13.9 | +6.7 | ||
| Turnout | 4,800 | 36.7 | +5.7 | ||
| Conservative hold | Swing | +3.4 | |||
| Party | Candidate | Votes | % | ±% | |
|---|---|---|---|---|---|
| Conservative | June Lumley | 2,090 | 50.3 | +15.8 | |
| Rayleigh Independents | Jamie Burton | 655 | 15.8 | New | |
| Liberal Democrats | Christopher Stanley | 495 | 11.9 | −4.3 | |
| UKIP | Keith Gibbs * | 459 | 11.0 | −28.7 | |
| Labour | Samantha Reed | 328 | 7.9 | −1.7 | |
| Green | Andrew Strutt | 132 | 3.2 | New | |
| Majority | 1,435 | 34.5 | +29.2 | ||
| Turnout | 4,164 | 32.5 | +5.7 | ||
| Conservative gain from UKIP | Swing | +22.3 | |||
| Party | Candidate | Votes | % | ±% | |
|---|---|---|---|---|---|
| Conservative | Terry Cutmore * | 1,897 | 44.6 | +2.0 | |
| Rochford Resident | John Mason | 1,400 | 32.9 | New | |
| Labour | David Lench | 403 | 9.5 | −3.5 | |
| UKIP | Nicholas Cooper | 402 | 9.5 | −26.4 | |
| Liberal Democrats | Daniel Irlam | 148 | 3.5 | −5.1 | |
| Majority | 497 | 11.7 | +4.9 | ||
| Turnout | 4,255 | 31.8 | +5.7 | ||
| Conservative hold | Swing | −15.5 | |||
| Party | Candidate | Votes | % | ±% | |
|---|---|---|---|---|---|
| Conservative | Mike Steptoe | 1,683 | 45.6 | +9.2 | |
| Labour | Mark Daniels | 870 | 23.6 | −10.1 | |
| UKIP | Neil Hookway | 668 | 18.1 | −8.9 | |
| Independent | Robert Green | 173 | 4.7 | New | |
| Liberal Democrats | Tracy Arnold | 170 | 4.6 | +1.6 | |
| Green | Simon Cross | 128 | 3.5 | New | |
| Majority | 813 | 22.0 | +19.3 | ||
| Turnout | 3,701 | 29.7 | +5.7 | ||
| Conservative hold | Swing | +9.7 | |||
| Party | Candidate | Votes | % | ±% | |
|---|---|---|---|---|---|
| Conservative | Carole Weston | 2,281 | 48.1 | +17.6 | |
| Green | Michael Hoy * | 1,736 | 36.6 | −1.9 | |
| Labour | David Flack | 386 | 8.1 | −0.1 | |
| UKIP | Tina Hughes | 336 | 7.1 | −13.9 | |
| Majority | 545 | 11.5 | +3.5 | ||
| Turnout | 4,739 | 34.0 | +4.2 | ||
| Conservative gain from Green | Swing | +9.8 | |||
Tendring edit
| Party | Seats | +/- | Votes | % | +/- | |
|---|---|---|---|---|---|---|
| Conservative | 6 | 16,888 | 46.2 | +15.7 | ||
| Labour | 1 | 7,024 | 19.2 | +2.8 | ||
| Independent | 1 | 1,906 | 5.2 | New | ||
| UKIP | 0 | 5,361 | 14.7 | −14.3 | ||
| Liberal Democrat | 0 | 2,734 | 7.5 | −0.4 | ||
| Tendring First | 0 | 1,332 | 3.6 | −8.5 | ||
| Green | 0 | 1,272 | 3.5 | +0.3 | ||
Division Results
| Party | Candidate | Votes | % | ±% | |
|---|---|---|---|---|---|
| Conservative | Alan Goggin * | 2,490 | 47.5 | +22.9 | |
| Liberal Democrats | Gary Scott | 1,318 | 25.1 | −1.8 | |
| Labour | Frank Belgrove | 628 | 12.0 | −0.5 | |
| UKIP | Ben Smith | 602 | 11.5 | −18.9 | |
| Green | Bev Maltby | 205 | 3.9 | +0.4 | |
| Majority | 1,172 | 22.4 | +18.8 | ||
| Turnout | 5,253 | 35.7 | +3.5 | ||
| Conservative gain from UKIP | Swing | +20.9 | |||
| Party | Candidate | Votes | % | ±% | |
|---|---|---|---|---|---|
| Independent | Colin Sargeant * | 1,906 | 40.9 | New | |
| Conservative | Chris Amos | 1,458 | 31.3 | +4.4 | |
| UKIP | Mark Stephenson | 705 | 15.1 | −9.7 | |
| Labour | Robert Porter | 440 | 9.4 | −1.3 | |
| Liberal Democrats | Kane Silver | 82 | 1.8 | +0.0 | |
| Green | Sally McAtter | 74 | 1.6 | +0.0 | |
| Majority | 448 | 9.6 | +2.1 | ||
| Turnout | 4,678 | 35.8 | +2.1 | ||
| Independent gain from Tendring First | Swing | +18.2 | |||
Between 2013 and 2017, the seat was won by the Independent candidate in a by-election, however it is shown as a gain as it is compared to the previous full council election.
| Party | Candidate | Votes | % | ±% | |
|---|---|---|---|---|---|
| Conservative | Andy Wood * | 1,639 | 49.9 | +20.6 | |
| Labour Co-op | Samantha Atkinson | 725 | 22.1 | −2.8 | |
| UKIP | Andrew Pemberton | 724 | 22.0 | −2.9 | |
| Liberal Democrats | Barrie Coker | 125 | 3.8 | −2.2 | |
| Green | David Davis | 73 | 2.2 | −0.2 | |
| Majority | 914 | 27.8 | +23.4 | ||
| Turnout | 3,292 | 25.7 | +1.5 | ||
| Conservative hold | Swing | +11.7 | |||
| Party | Candidate | Votes | % | ±% | |
|---|---|---|---|---|---|
| Conservative | Paul Honeywood * | 1,805 | 51.0 | +12.8 | |
| Labour Co-op | Dan Casey | 874 | 24.7 | +4.2 | |
| UKIP | Roy Raby | 619 | 17.5 | −14.0 | |
| Liberal Democrats | Sean Duffy | 157 | 4.4 | +1.8 | |
| Green | Steven Kelly | 88 | 2.5 | −0.1 | |
| Majority | 931 | 26.3 | +21.9 | ||
| Turnout | 3,543 | 28.5 | +4.3 | ||
| Conservative hold | Swing | +8.6 | |||
| Party | Candidate | Votes | % | ±% | |
|---|---|---|---|---|---|
| Conservative | Mark Platt | 3,066 | 52.0 | +14.2 | |
| Tendring First | Terry Allen | 1,332 | 22.6 | +3.0 | |
| Labour | Andy White | 616 | 10.4 | −0.7 | |
| UKIP | Richard Everett | 563 | 9.5 | −19.1 | |
| Green | Susan Clutterbuck | 192 | 3.3 | +1.7 | |
| Liberal Democrats | Simon Banks | 131 | 2.2 | New | |
| Majority | 1,734 | 29.4 | +20.3 | ||
| Turnout | 5,925 | 38.1 | +2.4 | ||
| Conservative hold | Swing | +5.6 | |||
| Party | Candidate | Votes | % | ±% | |
|---|---|---|---|---|---|
| Labour | Ivan Henderson * | 2,427 | 51.4 | +10.3 | |
| Conservative | Ricky Callender | 1,374 | 29.1 | +7.8 | |
| UKIP | Aaron Hammond | 725 | 15.4 | −5.9 | |
| Liberal Democrats | Owen Bartholomew | 106 | 2.2 | −1.0 | |
| Green | Paul Clutterbuck | 88 | 1.9 | +0.2 | |
| Majority | 1,053 | 21.7 | +7.7 | ||
| Turnout | 4,726 | 35.6 | +4.5 | ||
| Labour hold | Swing | +1.2 | |||
| Party | Candidate | Votes | % | ±% | |
|---|---|---|---|---|---|
| Conservative | Andy Erskine * | 2,388 | 51.1 | +22.3 | |
| UKIP | Jeff Bray | 1,035 | 22.1 | −6.7 | |
| Labour | Maria Fowler | 762 | 16.3 | +1.0 | |
| Liberal Democrats | Matthew Bensilum | 279 | 6.0 | +2.0 | |
| Green | Chris Southall | 212 | 4.5 | +0.5 | |
| Majority | 1,353 | 29.0 | +22.8 | ||
| Turnout | 4,676 | 32.2 | +2.1 | ||
| Conservative gain from UKIP | Swing | +17.6 | |||
The Conservative candidate was elected previously as a UKIP candidate and subsequently switched their party affiliation. The seat is therefore shown as a gain.
| Party | Candidate | Votes | % | ±% | |
|---|---|---|---|---|---|
| Conservative | Carlo Guglielmi * | 2,668 | 59.5 | +21.6 | |
| Labour | Maison Urwin | 552 | 12.3 | New | |
| Liberal Democrats | Rain Welham-Cobb | 536 | 12.0 | −6.2 | |
| UKIP | Mary Newton | 388 | 8.6 | −19.9 | |
| Green | Duncan Gordon | 340 | 7.6 | −1.0 | |
| Majority | 2,116 | 47.2 | +17.7 | ||
| Turnout | 4,484 | 33.3 | +3.8 | ||
| Conservative hold | Swing | +4.7 | |||
Uttlesford edit
| Party | Seats | +/- | Votes | % | +/- | |
|---|---|---|---|---|---|---|
| Conservative | 4 | 10,884 | 45.6 | +2.9 | ||
| Residents for Uttlesford | 0 | 5,231 | 21.9 | +11.9 | ||
| Liberal Democrat | 0 | 4,278 | 17.9 | +1.3 | ||
| Labour | 0 | 1,707 | 7.1 | −1.1 | ||
| UKIP | 0 | 965 | 4.0 | −14.0 | ||
| Green | 0 | 815 | 3.4 | −1.0 | ||
Division Results
| Party | Candidate | Votes | % | ±% | |
|---|---|---|---|---|---|
| Conservative | Susan Barker * | 3,389 | 55.9 | +3.6 | |
| R4U | Alexander Armstrong | 1,457 | 24.0 | New | |
| Liberal Democrats | Lori Flawn | 402 | 6.6 | −1.2 | |
| Labour | Bill McCarthy | 399 | 6.6 | −2.9 | |
| UKIP | Alan Stannard | 283 | 4.7 | −20.8 | |
| Green | Ashley Payne | 133 | 2.2 | −2.6 | |
| Majority | 1,932 | 31.9 | +5.1 | ||
| Turnout | 6,063 | 31.4 | +3.6 | ||
| Conservative hold | Swing | −10.2 | |||
| Party | Candidate | Votes | % | ±% | |
|---|---|---|---|---|---|
| Conservative | John Moran | 2,468 | 35.6 | +2.1 | |
| R4U | Heather Asker | 2,201 | 31.8 | −2.5 | |
| Liberal Democrats | Joan Shibata | 1,211 | 17.5 | +7.5 | |
| Labour | Simon Trimnell | 619 | 8.9 | +0.8 | |
| Green | Sarah Allington | 246 | 3.6 | −0.4 | |
| UKIP | Raymond Tyler | 182 | 2.6 | −7.4 | |
| Majority | 267 | 3.8 | New | ||
| Turnout | 6,927 | 42.5 | +4.8 | ||
| Conservative gain from R4U | Swing | +2.3 | |||
| Party | Candidate | Votes | % | ±% | |
|---|---|---|---|---|---|
| Conservative | Raymond Gooding * | 2,317 | 37.4 | −3.3 | |
| Liberal Democrats | Melvin Caton | 1,711 | 27.6 | −4.1 | |
| R4U | Anthony Gerard | 1,573 | 25.4 | New | |
| Labour | Thomas van de Bilt | 284 | 4.6 | −2.6 | |
| UKIP | David Allum | 175 | 2.8 | −14.2 | |
| Green | Karmel Stannard | 132 | 2.1 | −1.3 | |
| Majority | 606 | 9.8 | +0.9 | ||
| Turnout | 6,192 | 40.4 | +3.0 | ||
| Conservative hold | Swing | +0.4 | |||
| Party | Candidate | Votes | % | ±% | |
|---|---|---|---|---|---|
| Conservative | Simon Walsh * | 2,710 | 57.7 | +10.7 | |
| Liberal Democrats | Antionette Wattebot | 954 | 20.3 | +3.6 | |
| Labour | Peter Simmons | 405 | 8.6 | +0.3 | |
| UKIP | Lorna Howe | 325 | 6.9 | −15.0 | |
| Green | Paul Allington | 304 | 6.5 | +0.4 | |
| Majority | 1,756 | 37.4 | +12.4 | ||
| Turnout | 4,698 | 33.6 | +4.6 | ||
| Conservative hold | Swing | +3.5 | |||
By-elections edit
Summary edit
| By-election | Date | Incumbent party | Winning party | ||
|---|---|---|---|---|---|
| Clacton East | 3 October 2019 | Independent | Independent | ||
Results edit
Clacton East edit
| Party | Candidate | Votes | % | ±% | |
|---|---|---|---|---|---|
| Independent | Mark Stephenson | 1,231 | 36.9 | +21.8 | |
| Conservative | Chris Amos | 1,223 | 36.6 | +5.3 | |
| Holland Residents | K.T. King | 537 | 16.1 | +16.1 | |
| Liberal Democrats | Callum Robertson | 140 | 4.2 | +2.4 | |
| Labour | Geoff Ely | 111 | 3.3 | −6.1 | |
| Green | Chris Southall | 97 | 2.9 | +1.3 | |
| Majority | 8 | 0.2 | −9.4 | ||
| Turnout | 3,339 | 25.3 | —10.5 | ||
| Independent hold | Swing | +8.3 | |||
Stephenson's vote share change is compared to the 2017 result when he stood as a UKIP candidate.
References edit
- ^ "Local Elections in England, May 2017" (PDF). Electoral Commission. October 2017. Archived (PDF) from the original on 19 July 2021.
- ^ "Upcoming elections & referendums". Electoral Commission. Archived from the original on 5 May 2018. Retrieved 15 September 2016.
- ^ "By-election for new Brightlingsea county councillor to take place next month". Clacton Gazette. 5 September 2014. Retrieved 19 April 2021.
- ^ "Kerry Smith quits UKIP over 'internal backstabbers'". BBC News. 16 December 2014. Retrieved 19 April 2021.
- ^ "Youngest councillor defeats UKIP to win Bocking by-election". BBC News. 6 March 2015. Retrieved 19 April 2021.
- ^ James Dwan (30 March 2016). "Ukip group deputy leader on Essex County Council quits party after getting 'squeezed' between rival EU campaigns". Harwich and Manningtree Standard. Retrieved 19 April 2021.
- ^ "Councillor Pierre Oxley from Clacton admits fraud by false representation after misusing grant funds". Clacton Gazette. 14 December 2015. Retrieved 19 April 2021.
- ^ Maurice Richmond (10 June 2016). "Ukip councillor, Frank Ferguson, wins Essex County Council by-election in Laindon Park and Fryerns". Echo News. Retrieved 19 April 2021.
- ^ "Ex-UKIP county council deputy leader and Harwich town councillor Andy Erskine has joined the Conservatives". Clacton and Frinton Gazette. 25 July 2016. Retrieved 19 April 2021.
- ^ "Funeral for dedicated councillor Joe Pike to take place next month". Halstead Gazette. 17 December 2016. Retrieved 19 April 2021.
- ^ No by-election was held as the death was sufficiently close to the upcoming County election.