


Summary
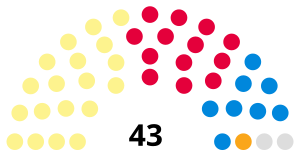
The 2017 Renfrewshire Council election took place on 4 May 2017 to elect members of Renfrewshire Council.[1] The election was first to use the twelve wards created as a result of the 2015-16 Boundary Commission review, with each ward electing three or four Councillors using the single transferable vote system, a form of proportional representation, with 43 Councillors being elected, a net increase of 3 members compared to the 2012 Council.
| ||||||||||||||||||||||||||||||||||||||||||||||||||||||||||||||||||||||||||||||||||
All 43 seats to Renfrewshire Council 22 seats needed for a majority | ||||||||||||||||||||||||||||||||||||||||||||||||||||||||||||||||||||||||||||||||||
|---|---|---|---|---|---|---|---|---|---|---|---|---|---|---|---|---|---|---|---|---|---|---|---|---|---|---|---|---|---|---|---|---|---|---|---|---|---|---|---|---|---|---|---|---|---|---|---|---|---|---|---|---|---|---|---|---|---|---|---|---|---|---|---|---|---|---|---|---|---|---|---|---|---|---|---|---|---|---|---|---|---|---|
| Turnout | 48.0% | |||||||||||||||||||||||||||||||||||||||||||||||||||||||||||||||||||||||||||||||||
| ||||||||||||||||||||||||||||||||||||||||||||||||||||||||||||||||||||||||||||||||||
 | ||||||||||||||||||||||||||||||||||||||||||||||||||||||||||||||||||||||||||||||||||
Election result edit
| Party | Seats | Gains | Losses | Net gain/loss | Seats % | Votes % | Votes | +/− | |
|---|---|---|---|---|---|---|---|---|---|
| SNP | 19 | 6 | 2 | +4 | 44.19 | 37.63 | 23,467 | +2.33 | |
| Labour | 13 | 1 | 10 | -9 | 30.23 | 28.22 | 17,599 | -19.38 | |
| Conservative | 8 | 7 | 0 | +7 | 18.6 | 21.04 | 13,124 | +11.94 | |
| Liberal Democrats | 1 | 0 | 0 | 0 | 2.33 | 4.14 | 2,580 | -0.26 | |
| Independent | 2 | 1 | 0 | +1 | 4.65 | 5.32 | 3,319 | +3.72 | |
| Scottish Green | 0 | - | - | - | - | 3.26 | 2,030 | New | |
| Scottish Socialist | 0 | - | - | - | - | 0.20 | 125 | -1.00 | |
| TUSC | 0 | - | - | - | - | 0.14 | 89 | -0.60 | |
| UKIP | 0 | - | - | - | - | 0.05 | 32 | New | |
Note: "Votes" are the first preference votes. The net gain/loss and percentage changes relate to the result of the previous Scottish local elections on 3 May 2007. This may differ from other published sources showing gain/loss relative to seats held at dissolution of Scotland's councils.
Ward results edit
Renfrew North and Braehead edit
- 2012: 2xLab; 1xSNP
- 2017: 2xSNP; 1xLab; 1xCon
- 2012-2017 Change: 1 additional seat compared to 2012. SNP gain one seat from Labour. Conservative gain extra seat.
| Party | Candidate | FPv% | Count | ||||||
|---|---|---|---|---|---|---|---|---|---|
| 1 | 2 | 3 | 4 | 5 | 6 | ||||
| SNP | John Shaw | 24.63 | 1,335 | ||||||
| Labour | Bill Brown (incumbent) | 20.37 | 1,104 | ||||||
| Conservative | Jane Strang | 19.99 | 1,084 | 1,087.37 | |||||
| SNP | Lisa-Marie Hughes | 15.35 | 832 | 1,049.78 | 1,050.58 | 1,050.64 | 1,065.58 | 1,087.77 | |
| Labour | Alexander Murrin (incumbent) | 11.9 | 645 | 652.68 | 667.86 | 668.52 | 696.99 | 736.99 | |
| Independent | Peter Morton | 2.82 | 153 | 155.8 | 156.47 | 156.79 | 178.51 | ||
| Scottish Green | Nathalie Rosset | 2.67 | 145 | 148.93 | 149.17 | 149.24 | 180.56 | 222.68 | |
| Liberal Democrats | Ross Stalker | 2.27 | 123 | 125.62 | 126.03 | 126.48 | |||
| Electorate: TBC Valid: 5,421 Spoilt: 137 Quota: 1,085 Turnout: 5,558 (45.9%) | |||||||||
Renfrew South and Gallowhill edit
- 2012: 2xLab; 1xSNP
- 2017: 2xSNP; 1xLab
- 2012-2017 Change: SNP gain one seat from Labour
| Party | Candidate | FPv% | Count | |||||||
|---|---|---|---|---|---|---|---|---|---|---|
| 1 | 2 | 3 | 4 | 5 | 6 | 7 | ||||
| SNP | Cathy McEwan (incumbent) | 26.98 | 1,079 | |||||||
| Conservative | Mark Dougan | 17.88 | 715 | 715.51 | 717.51 | 735.58 | 774.73 | 825.09 | ||
| SNP | Jim Paterson (incumbent) | 17.73 | 709 | 773.57 | 785.08 | 828.96 | 855.98 | 889.3 | 1,004.46 | |
| Labour | Edward Grady | 17.70 | 708 | 712.32 | 717.39 | 727.39 | 1,238.56 | |||
| Labour | Margaret Devine (incumbent) | 15.65 | 626 | 628.49 | 634.49 | 656.86 | ||||
| Scottish Green | Graham Batin | 2.85 | 114 | 115.61 | 130.76 | |||||
| TUSC | Richard Neville | 1.2 | 48 | 48.95 | ||||||
| Electorate: TBC Valid: 3,999 Spoilt: 106 Quota: 1,000 Turnout: 4,105 (44.2%) | ||||||||||
Paisley Northeast and Ralston edit
- 2012: 2xLab; 2xSNP
- 2017: 1xCon; 1xLab; 1xSNP
- 2012-2017 Change (vs Paisley East and Ralston): 1 less seat compared to 2012. Conservative gain one seat from Labour. SNP lose additional seat.
| Party | Candidate | FPv% | Count | |||||||||
|---|---|---|---|---|---|---|---|---|---|---|---|---|
| 1 | 2 | 3 | 4 | 5 | 6 | 7 | 8 | 9 | ||||
| Conservative | Neill Graham | 22.7 | 1,091 | 1,091 | 1,095 | 1,099 | 1,103 | 1,311 | ||||
| SNP | Jennifer Adam-McGregor | 18.2 | 874 | 881 | 888 | 932 | 941 | 1,009 | 1,020.72 | 1,024.12 | 1,882.34 | |
| SNP | John Clark | 17.9 | 862 | 863 | 865 | 899 | 905 | 946 | 958.89 | 964.13 | ||
| Labour | Jim Sharkey (incumbent) | 17.4 | 835 | 839 | 845 | 871 | 1,167 | 1,311 | ||||
| Liberal Democrats | Catriona Campbell | 11.7 | 562 | 566 | 577 | 606 | 618 | |||||
| Labour | Maureen Sharkey (incumbent) | 6.6 | 316 | 316 | 318 | 339 | ||||||
| Scottish Green | Duncan Macintosh | 3.53 | 170 | 185 | 201 | |||||||
| Independent | Billy Carlin | 1.05 | 50 | 58 | ||||||||
| Scottish Socialist | Lindsay Brown | 0.92 | 44 | |||||||||
| Electorate: TBC Valid: 4,804 Spoilt: 86 Quota: 1,202 Turnout: 4,890 (54.6%) | ||||||||||||
Paisley Northwest edit
- 2012: 2xLab; 2xSNP
- 2017: 2xSNP; 1xLab; 1xCon
- 2012-2017 Change: Conservative gain one seat from Labour
| Party | Candidate | FPv% | Count | ||||||||||
|---|---|---|---|---|---|---|---|---|---|---|---|---|---|
| 1 | 2 | 3 | 4 | 5 | 6 | 7 | 8 | 9 | 10 | ||||
| SNP | Kenny MacLaren (incumbent) | 26.8 | 1,303 | ||||||||||
| Labour | Karen Kennedy | 17.48 | 850 | 859.12 | 870.43 | 877.63 | 901.29 | 924.09 | 971.21 | 1,065.92 | |||
| SNP | Mags MacLaren (incumbent) | 16.68 | 811 | 1,100.22 | |||||||||
| Conservative | John McIntyre | 13.51 | 657 | 659.28 | 661.31 | 664.34 | 691.71 | 717.14 | 751.54 | 779.71 | 786.23 | 941.29 | |
| Labour | Tommy Williams (incumbent) | 10.14 | 493 | 498.32 | 505.61 | 512.38 | 526.86 | 555.85 | 593.33 | 639.63 | 703.45 | ||
| No label | Andy Doyle | 4.34 | 211 | 214.79 | 222.79 | 227.22 | 232.70 | 284.63 | |||||
| Scottish Green | Beth Douglas | 3.87 | 188 | 196.36 | 237.56 | 251.96 | 283.14 | 296.06 | 359.55 | ||||
| Independent | John Goudie McIntyre | 3.8 | 185 | 187.79 | 195.10 | 197.70 | 200.76 | ||||||
| Liberal Democrats | Jack Clark | 2.53 | 123 | 124.52 | 128.06 | 130.18 | |||||||
| Scottish Socialist | Sandra Webster | 0.86 | 42 | 42.51 | 48.83 | ||||||||
| Electorate: TBC Valid: 4,863 Spoilt: 126 Quota: 973 Turnout: 4,989 (39.4%) | |||||||||||||
Paisley East and Central edit
- 2017: 2xSNP; 1xLab
- New ward
| Party | Candidate | FPv% | Count | |||||||
|---|---|---|---|---|---|---|---|---|---|---|
| 1 | 2 | 3 | 4 | 5 | 6 | 7 | ||||
| SNP | John McNaughtan | 26.51 | 1,007 | |||||||
| Labour | Carolann Davidson††††† | 21.62 | 821 | 822.53 | 849.64 | 884.87 | 1,242.15 | |||
| Conservative | John Cameron | 16.8 | 638 | 638.28 | 666.34 | 677.34 | 691.34 | 746.62 | ||
| SNP | Will Mylet (incumbent)[3] | 16.01 | 608 | 658.09 | 669.32 | 792.11 | 805.51 | 842.67 | 937.67 | |
| Labour | Stuart McAusland | 10.82 | 411 | 411.85 | 417.91 | 438.97 | ||||
| Scottish Green | Daniel Speirs | 5.48 | 208 | 209.53 | 226.64 | |||||
| Liberal Democrats | Samantha Allan | 2.77 | 105 | 105.62 | ||||||
| Electorate: TBC Valid: 3,798 Spoilt: 87 Quota: 950 Turnout: 3,885 (42.6%) | ||||||||||
Paisley Southeast edit
- 2012: 2xLab; 1xSNP; 1xIndependent
- 2017: 1xLab; 1xSNP; 1xIndependent
- 2012-2017 Change (vs Paisley South): 1 less seat compared to 2012. Labour lose seat.
| Party | Candidate | FPv% | Count | |||||||||
|---|---|---|---|---|---|---|---|---|---|---|---|---|
| 1 | 2 | 3 | 4 | 5 | 6 | 7 | 8 | 9 | ||||
| SNP | Marie McGurk (incumbent) | 22.78 | 1,047 | 1,053 | 1,059 | 1,101 | 1,112 | 1,117.77 | 1,748.69 | |||
| Labour | Eddie Devine (incumbent) | 21.95 | 1,009 | 1,009 | 1,031 | 1,048 | 1,207 | |||||
| Conservative | Sheila Fulton | 15.12 | 695 | 695 | 717 | 728 | 751 | 758.69 | 765.69 | 792.15 | 1,047 | |
| SNP | Janette Swanson | 14.44 | 664 | 667 | 671 | 708 | 720 | 721.96 | ||||
| Independent | Paul Mack (incumbent)†† | 14.09 | 648 | 649 | 666 | 687 | 730 | 738.53 | 765.69 | 950.59 | 1,248.79 | |
| Labour | Ben Smith | 5.44 | 250 | 250 | 273 | 296 | ||||||
| Scottish Green | Emma McShane | 3.39 | 156 | 157 | 171 | |||||||
| Liberal Democrats | Michael Wilson | 2.48 | 114 | 115 | ||||||||
| Scottish Socialist | John Miller | 0.30 | 14 | |||||||||
| Electorate: TBC Valid: 4,597 Spoilt: 92 Quota: 1,150 Turnout: 4,689 (50.7%) | ||||||||||||
Paisley Southwest edit
- 2012: 2xLab; 1xSNP; 1xLib Dem
- 2017: 2xSNP; 1xLab; 1xLib Dem
- 2012-2017 Change: SNP gain one seat from Labour
| Party | Candidate | FPv% | Count | ||||||
|---|---|---|---|---|---|---|---|---|---|
| 1 | 2 | 3 | 4 | 5 | 6 | ||||
| Labour | Kevin Montgomery††††† | 25.95 | 1,457 | ||||||
| Liberal Democrats | Eileen McCartin (incumbent) | 17.69 | 993 | 1,091.11 | 1,149.57 | ||||
| SNP | Lorraine Cameron (incumbent) | 17.31 | 972 | 998.59 | 1,041.11 | 1,043.71 | 1,432.22 | ||
| Conservative | James Halpin | 13.38 | 751 | 793.87 | 803.25 | 813.41 | 819.65 | 824.78 | |
| SNP | Stephen Burns | 12.9 | 724 | 740.05 | 757.34 | 759.13 | 917.9 | 1,182.18 | |
| SNP | Brian McGuire | 9.98 | 560 | 581.78 | 601.47 | 603.2 | |||
| Scottish Green | Sean Lafferty | 2.8 | 157 | 184.05 | |||||
| Electorate: TBC Valid: 5,614 Spoilt: 103 Quota: 1,123 Turnout: 5,717 (48.8%) | |||||||||
Johnstone South and Elderslie edit
- 2012: 3xLab; 1xSNP
- 2017: 2xSNP; 1xLab; 1xCon
- 2012-2017 Change: SNP & Conservative each gain one seat from Labour.
| Party | Candidate | FPv% | Count | |||||||
|---|---|---|---|---|---|---|---|---|---|---|
| 1 | 2 | 3 | 4 | 5 | 6 | 7 | ||||
| Labour | John Hood (incumbent) | 26.15 | 1,448 | |||||||
| SNP | Jacqueline Cameron | 25.14 | 1,392 | |||||||
| Conservative | Alistair MacKay | 17.37 | 962 | 978.67 | 982.34 | 995.75 | 1,151.48 | |||
| SNP | Andy Steel | 11.63 | 644 | 659.73 | 907.41 | 973.39 | 1,052.27 | 1,054.46 | 1,235.16 | |
| No label | John Caldwell (incumbent) | 8.94 | 495 | 512.84 | 518.35 | 542.7 | ||||
| Labour | Thomas Dempster Wallace | 8.02 | 444 | 682.79 | 687.28 | 726.79 | 867.85 | 883.07 | ||
| Scottish Green | Megan Tait | 2.76 | 153 | 161.92 | 171.91 | |||||
| Electorate: TBC Valid: 5,538 Spoilt: 167 Quota: 1,108 Turnout: 5,705 (45.5%) | ||||||||||
Johnstone North, Kilbarchan, Howwood and Lochwinnoch edit
- 2012: 2xLab; 1xSNP
- 2017: 1xLab; 1xSNP; 1xCon; 1xIndependent
- 2012-2017 Change: 1 extra seat compared to 2012. Labour lose one seat to Conservative. Independent gain extra seat.
| Party | Candidate | FPv% | Count | |||||||||
|---|---|---|---|---|---|---|---|---|---|---|---|---|
| 1 | 2 | 3 | 4 | 5 | 6 | 7 | 8 | 9 | ||||
| Labour | Derek Bibby (incumbent) | 19.75 | 1,204 | 1,207 | 1,209 | 1,228 | ||||||
| SNP | Emma Rodden | 18.03 | 1,099 | 1,106 | 1,108 | 1,111 | 1,111.2 | 1,198.22 | 1,263.58 | |||
| Conservative | Bill Binks | 17.42 | 1,062 | 1,062 | 1,082 | 1,099 | 1,099.5 | 1,107.5 | 1,204.19 | 1,204.6 | 1,232.8 | |
| Independent | Andy Doig (incumbent)††† | 14.63 | 892 | 892 | 898 | 912 | 912.99 | 966.02 | 1,101.02 | 1,102.47 | 1,430.32 | |
| SNP | Graeme Ramsay Stockton | 13.6 | 829 | 830 | 830 | 833 | 833.19 | 881.2 | 906.28 | 944.49 | ||
| Labour | Christopher Gilmour (incumbent) | 10.06 | 613 | 616 | 616 | 621 | 626.13 | 657.2 | ||||
| Scottish Green | Sarah Anderson | 4.25 | 259 | 263 | 264 | 281 | 281.2 | |||||
| Liberal Democrats | William Duff | 1.35 | 82 | 83 | 83 | |||||||
| UKIP | Cheryl O'Brien | 0.53 | 32 | 33 | ||||||||
| Scottish Socialist | Geoff Knowles | 0.41 | 25 | |||||||||
| Electorate: TBC Valid: 6,095 Spoilt: 143 Quota: 1,220 Turnout: 6,238 (54.1%) | ||||||||||||
Houston, Crosslee and Linwood edit
- 2012: 2xLab; 2xSNP
- 2017: 2xLab; 1xSNP; 1xCon
- 2012-2017 Change: Conservative gain one seat from SNP.
| Party | Candidate | FPv% | Count | ||||||
|---|---|---|---|---|---|---|---|---|---|
| 1 | 2 | 3 | 4 | 5 | 6 | ||||
| Conservative | Scott Kerr | 27.96 | 1,574 | ||||||
| SNP | Audrey Doig (incumbent) | 21.39 | 1,204 | ||||||
| Labour | Jim Sheridan† | 16.61 | 935 | 993.78 | 996.21 | 1,023.71 | 1,078.51 | 1,221.98 | |
| Labour | Alison Dowling††††† | 13.96 | 786 | 853.30 | 857.65 | 884.82 | 974.53 | 1,210.50 | |
| SNP | Robert Innes | 13.75 | 774 | 787.63 | 848.89 | 928.70 | 954.76 | ||
| Scottish Green | Helen Speirs | 3.46 | 195 | 221.41 | 224.99 | ||||
| Liberal Democrats | Allan Heron | 2.88 | 162 | 271.62 | 272.9 | 318.61 | |||
| Electorate: TBC Valid: 5,630 Spoilt: 112 Quota: 1,127 Turnout: 5,742 (48.1%) | |||||||||
Bishopton, Bridge of Weir and Langbank edit
- 2012: 1xLab; 1xCon; 1xSNP
- 2017: 1xCon; 1xSNP; 1xLab
- 2012-2017 Change: No change
| Party | Candidate | FPv% | Count | ||||
|---|---|---|---|---|---|---|---|
| 1 | 2 | 3 | 4 | ||||
| Conservative | James MacLaren (incumbent) | 45.47 | 2,552 | ||||
| SNP | Natalie Don†††† | 31.77 | 1,783 | ||||
| Labour | Colin McCulloch††††† | 15.96 | 896 | 1,212.69 | 1,289 | 1,407.35 | |
| Liberal Democrats | Elliot Harrison | 3.78 | 212 | 537.68 | 578.49 | 733.70 | |
| Scottish Green | Ellen Höfer-Franz | 3.03 | 170 | 230.72 | 406.93 | ||
| Electorate: TBC Valid: 5,613 Spoilt: 44 Quota: 1,404 Turnout: 5,657 (55.1%) | |||||||
Erskine and Inchinnan edit
- 2012: 2xLab; 2xSNP
- 2017: 2xSNP; 1xLab; 1xCon
- 2012-2017 Change: Conservative gain one seat from Labour
| Party | Candidate | FPv% | Count | ||||||||
|---|---|---|---|---|---|---|---|---|---|---|---|
| 1 | 2 | 3 | 4 | 5 | 6 | 7 | 8 | ||||
| SNP | Iain Nicolson (incumbent) | 22.54 | 1,441 | ||||||||
| Conservative | Tom Begg | 20.85 | 1,333 | ||||||||
| Labour | Jim Harte (incumbent)†††††† | 14.45 | 924 | 928.05 | 936.11 | 947.19 | 973.08 | 994.73 | 1,173.1 | 1,910.16 | |
| SNP | Michelle Campbell | 14.3 | 914 | 1,043.40 | 1,044.82 | 1,049.93 | 1,059.46 | 1,125.24 | 1,277.61 | 1,323.5 | |
| Labour | Sam Mullin (incumbent) | 13.05 | 834 | 841.53 | 846.84 | 852.92 | 862.91 | 868.1 | 998.43 | ||
| Independent | Andy Cameron | 10.75 | 687 | 693.86 | 706.34 | 711.65 | 743.08 | 771.94 | |||
| Scottish Green | Mairi Cranie | 1.80 | 115 | 119.27 | 120.2 | 131.47 | 145.22 | ||||
| Liberal Democrats | John Boyd | 1.63 | 104 | 107.35 | 116.34 | 117.34 | |||||
| TUSC | Jim Halfpenny | 0.64 | 41 | 41.56 | 41.92 | ||||||
| Electorate: TBC Valid: 6,393 Spoilt: 136 Quota: 1,279 Turnout: 6,529 (49.4%) | |||||||||||
Changes since Election edit
- † In August 2018, Houston, Crosslee and Linwood Labour Cllr Jim Sheridan was suspended from the party following the discovery of anti-Semitic posts on Facebook.[4] He was reinstated following an investigation in January 2019.[5] In July 2021 he was suspended again.[6] In March 2022 he resigned from the Labour party[7]
- †† Paisley Southeast Cllr Paul Mack was disqualified from office by the Standards Commission for Scotland, with effect from 1 October 2020.[8] A by-election was due to be held on 14 December 2021, however Paul Mack appealed the decision to the Court of Session.[9] On 11 March 2022, the Court of Session ruled to the effect that Cllr Mack's disqualification was reduced to ten months, backdated to May 2021.[10]
- ††† On 22 October 2020 Johnstone North, Kilbarchan, Howwood and Lochwinnoch Cllr Andy Doig joined the Scotia Future party.[11]
- †††† Bishopton, Bridge of Weir and Langbank SNP Cllr Natalie Don was elected as a MSP for Renfrewshire North and West in the 2021 Scottish Parliament election.
- ††††† In December 2021 Councillors Dowling, Davidson, McCulloch and Montgomery were suspended from the Labour group, but this was overturned on 30 December.[12]
- †††††† In March 2022 Councillor Jim Harte was suspended from the Labour group.[13]
References edit
- ^ a b c d e f g h i j k l m "Candidates declared for the Renfrewshire Council election". renfrewshire.gov.uk. Renfrewshire Council. Archived from the original on 5 April 2017. Retrieved 4 April 2017.
- ^ "Renfrewshire LG Election results 2017". Retrieved 30 March 2021.
- ^ Sitting councillor for the preceding Paisley East and Ralston ward.
- ^ "Labour Party suspends former MP Jim Sheridan". BBC News. 18 August 2018. Retrieved 30 March 2021.
- ^ "Anti-Semitism row former MP Jim Sheridan reinstated". BBC News. 25 January 2019. Retrieved 30 March 2021.
- ^ Hutcheon, Paul (19 July 2021). "Scottish Labour councillor suspended for a second time over anti-semitism row". Daily Record. Retrieved 7 February 2022.
- ^ Nicol, Jacob (25 March 2022). "Labour councillor Jim Sheridan quits party after 40 years". The Gazette. Retrieved 31 March 2022.
- ^ Dunion, Kevin (28 September 2020). "Decision of the Hearing Panel of the Standards Commission for Scotland following the Hearing held at Renfrewshire House, Cotton Street, Paisley, on Thursday, 10 September 2020" (PDF). Standards Commission for Scotland. Retrieved 22 October 2020.
- ^ team, Renfrewshire Communications. "By-election for Ward 6 - Paisley Southeast". www.renfrewshire.gov.uk. Retrieved 26 November 2021.
- ^ Lady Dorrian, Lord Doherty, Lord Matthews. "Opinion of the Court" (PDF). www.scotcourts.gov.uk. Retrieved 31 March 2022.
{{cite web}}: CS1 maint: multiple names: authors list (link) - ^ Gordon, Tom (22 October 2020). "Former SNP politicians set up new party for 'real independence' outside EU". The Herald. Retrieved 22 October 2020.
- ^ Talbot, Carla (30 December 2021). "Renfrewshire Labour councillors have suspension over unpaid fees overturned". Daily Record/Paisley Daily Express. Retrieved 31 March 2022.
- ^ Brawn, Steph. "Councillor Jim Harte 'suspended' from Renfrewshire's Labour group". The Gazette. Retrieved 31 March 2022.