


Summary
The 2018 United States House of Representatives elections in Colorado were held on November 6, 2018, to elect the seven U.S. representatives from the state of Colorado, one from each of the state's seven congressional districts. The Republican and Democratic Party primaries in Colorado were held on June 26, 2018. The elections coincided with the gubernatorial election, as well as other elections to the House of Representatives, elections to the United States Senate, and various state and local elections.
| |||||||||||||||||||||||||
All 7 Colorado seats to the United States House of Representatives | |||||||||||||||||||||||||
|---|---|---|---|---|---|---|---|---|---|---|---|---|---|---|---|---|---|---|---|---|---|---|---|---|---|
| Turnout | 63.58% | ||||||||||||||||||||||||
| |||||||||||||||||||||||||

| |||||||||||||||||||||||||
Overview edit
Statewide edit
| Party | Candidates | Votes | Seats | ||||
|---|---|---|---|---|---|---|---|
| No. | % | No. | +/– | % | |||
| Democratic | 7 | 1,343,211 | 53.44 | 4 | 57.14 | ||
| Republican | 7 | 1,079,772 | 42.96 | 3 | 42.95 | ||
| Libertarian | 6 | 58,769 | 2.34 | 0 | 0.0 | ||
| Independent | 2 | 27,187 | 1.08 | 0 | 0.0 | ||
| Unity | 2 | 4,623 | 0.18 | 0 | 0.0 | ||
| Green | 5 | 207 | 0.01 | 0 | 0.0 | ||
| Write-in | 5 | 137 | 0.01 | 0 | 0.0 | ||
| Total | 34 | 2,513,906 | 100.0 | 7 | 100.0 | ||
By district edit
Results of the 2018 United States House of Representatives elections in Colorado by district:[1]
| District | Democratic | Republican | Others | Total | Result | ||||
|---|---|---|---|---|---|---|---|---|---|
| Votes | % | Votes | % | Votes | % | Votes | % | ||
| District 1 | 272,886 | 73.81% | 85,207 | 23.05% | 11,622 | 3.14% | 369,715 | 100.0% | Democratic hold |
| District 2 | 259,608 | 60.27% | 144,901 | 33.64% | 26,256 | 6.09% | 430,765 | 100.0% | Democratic hold |
| District 3 | 146,426 | 43.55% | 173,205 | 51.52% | 16,570 | 4.93% | 336,201 | 100.0% | Republican hold |
| District 4 | 145,544 | 39.38% | 224,038 | 60.61% | 38 | 0.01% | 369,620 | 100.0% | Republican hold |
| District 5 | 126,848 | 39.30% | 184,002 | 57.02% | 11,866 | 3.68% | 322,716 | 100.0% | Republican hold |
| District 6 | 187,639 | 54.10% | 148,685 | 42.87% | 10,498 | 3.03% | 346,822 | 100.0% | Democratic gain |
| District 7 | 204,260 | 60.42% | 119,734 | 35.42% | 14,073 | 4.16% | 338,067 | 100.0% | Democratic hold |
| Total | 1,343,211 | 53.43% | 1,079,772 | 42.95% | 90,924 | 3.62% | 2,513,907 | 100.0% | |
District 1 edit
| |||||||||||||||||
 DeGette: 60-70% 70-80% Stockham: 50-60% 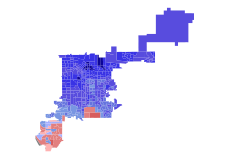 DeGette: 40–50% 50–60% 60–70% 70–80% 80–90% >90% Stockham: 40–50% 50–60% 60–70% No votes | |||||||||||||||||
| |||||||||||||||||


The 1st district is located in Central Colorado and includes most of the city of Denver. Incumbent Democrat Diana DeGette, who had represented the district since 1997, ran for re-election. He was re-elected with 68% of the vote in 2016. The district had a PVI of D+21.
Democratic primary edit
Candidates edit
Nominee edit
- Diana DeGette, incumbent U.S. Representative
Eliminated in primary edit
- Saira Rao, political activist, author, publisher, former Wall Street lawyer and television producer[2]
Eliminated at Convention edit
Endorsements edit
- State legislators
- Joe Salazar, state representative and candidate for attorney general in 2018[5]
- Organizations
- Local officials
- Rafel Espinoza, Denver City Council member
- Susan-Barnes Gelt, Denver City Council member
- Debbie Ortega, Denver City Council member
- Chaz Tedesco, Adams County Commissioner
- Individuals
- Tay Anderson, former candidate for Denver Public School Board of Education
- Denis Berckefeldt, former secretary of the Colorado Democratic Party and nominee for the 3rd district in 2002
- Buie Seawell, former Colorado Democratic Party Chair
- Gary Shteyngart, author
- Andrew Yang, founder of Venture for America and 2020 US Presidential candidate
Results edit
| Party | Candidate | Votes | % | |
|---|---|---|---|---|
| Democratic | Diana DeGette (incumbent) | 91,102 | 68.2 | |
| Democratic | Saira Rao | 42,398 | 31.8 | |
| Total votes | 133,500 | 100.0 | ||
Republican primary edit
Candidates edit
Nominee edit
Withdrawn edit
Results edit
| Party | Candidate | Votes | % | |
|---|---|---|---|---|
| Republican | Casper Stockham | 29,933 | 100.0 | |
| Total votes | 29,933 | 100.0 | ||
Libertarian primary edit
Candidates edit
Nominee edit
- Raymon Doane, tax examiner[11]
General election edit
Results edit
| Party | Candidate | Votes | % | |
|---|---|---|---|---|
| Democratic | Diana DeGette (incumbent) | 272,886 | 73.8 | |
| Republican | Casper Stockham | 85,207 | 23.1 | |
| Libertarian | Raymon Doane | 11,600 | 3.1 | |
| Write-in | 22 | 0.0 | ||
| Total votes | 369,715 | 100.0 | ||
| Democratic hold | ||||
District 2 edit
| |||||||||||||||||
 Neguse: 40-50% 50-60% 60-70% 70-80% Yu: 40-50% 50-60% 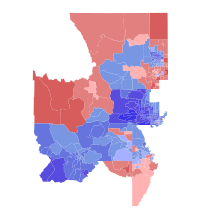 Neguse: 40–50% 50–60% 60–70% 70–80% 80–90% >90% Yu: 40–50% 50–60% 60–70% 70–80% | |||||||||||||||||
| |||||||||||||||||

The 2nd district is located in Northern Colorado and encompasses seven counties. Incumbent Democrat Jared Polis, who had represented the district since 2009, did not run re-election, instead running for Governor.[13] He was re-elected with 57% of the vote in 2016. The district had a PVI of D+9.
Democratic primary edit
Candidates edit
Nominee edit
- Joe Neguse, former regent for the University of Colorado, former executive director of the Colorado Department of Regulatory Agencies, and nominee for Secretary of State of Colorado in 2014[14]
Eliminated in primary edit
- Mark Williams, businessman and former chair of the Boulder County Democratic Party[15]
Withdrawn edit
- Kristopher Larsen, Mayor of Nederland[16]
- Howard Dotson, pastor and candidate for Loveland City Council in 2017[17]
- Kenneth Toltz, businessman and nominee for the 6th district in 2000[18]
Declined edit
- Kerry Donovan, state senator for the 5th District[19] (running for re-election)
- Steve Fenberg, state senator[20]
- Dan Gibbs, Summit County Commissioner and former state senator[20]
- Elise Jones, Boulder County Commissioner[20]
- Betsy Markey, former U.S. Representative and nominee for state treasurer in 2014[20]
- Shaun McGrath, former mayor of Boulder[17]
- Shannon Watts, founder of Moms Demand Action[20][21]
Endorsements edit
- U.S. Executive Branch officials
- Joe Biden, former U.S. Vice President
- Ken Salazar, former U.S. Senator, Colorado Attorney General and U.S. Secretary of the Interior
- Ray Mabus, former U.S. Secretary of the Navy
- U.S. Senators
- Kamala Harris, U.S. Senator from California
- U.S. Representatives
- Betsy Markey, former U.S. Representative from Colorado
- Barbara Lee, U.S. Representative from California
- Cedric Richmond, U.S. Representative from Louisiana
- Marcia Fudge, U.S. Representative from Ohio
- Jim Clyburn, U.S. Representative from South Carolina
- Gregory Meeks, U.S. Representative from New York
- Gabby Giffords, former U.S. Representative from Arizona
- Terri Sewell, former U.S. Representative from Alabama
- Statewide officials
- State Senators
- Joan Fitz-Gerald, former Senate President
- Dorothy Rupert, former
- Steve Fenberg, also co-founder of New Era Colorado with Neguse
- Rollie Heath, former
- Matt Jones, also candidate for Boulder County commissioner, D3
- Lucia Guzman, minority leader
- Rhonda Fields
- Angela Williams
- Nancy Todd
- Leroy Garcia
- Dominick Moreno
- Jeff Bridges
- Dan Pabon
- Andy Kerr
- John Kefalas
- Polly Baca, former
- Jeanne Nicholson, former
- Bob Bacon, former
- State Representatives
- Wilma Webb, former state representative
- Dickey Lee Hullinghorst, former speaker
- KC Becker, house majority leader
- Jonathan Singer
- Edie Hooton
- Mike Foote, candidate for District Attorney
- Faith Winter
- Leslie Herod
- James Coleman
- Jovan Melton
- Janet Buckner
- Daneya Esgar
- Alec Garnett
- Chris Hansen
- Tracy Kraft-Tharp
- Chris Kennedy
- Brittany Pettersen
- Matt Gray
- Diane Mitsch Bush, also candidate for US Congress, D3
- Millie Hamner
- Jeni Arndt
- Joann Ginal
- Mark Ferrandino, former speaker
- Claire Levy, former
- Alice Madden, former majority leader and candidate for CU Regent
- Ruth Wright, former
- Tom Plant, former
- Todd Saliman, former
- Joe Rice, former
- Angie Paccione, former
- Labor unions
- AFL-CIO
- American Federation of Teachers[23]
- Colorado Education Association
- Colorado Professional Fire Fighters
- Pipefitters #208
- Pipefitters #301
- Southwest Regional Council of Carpenters
- Organizations
- Blue Rising PAC
- Congressional Progressive Caucus
- Council for a Livable World
- Democracy for America
- End Citizens United
- Giffords
- Humane Society of the United States
- League of Conservation Voters
- NARAL Pro-Choice America
- Planned Parenthood Action Fund
Mayors
- Wellington Webb, former Mayor of Denver
- Suzanne Jones, Mayor of Boulder
- Connie Sullivan, Mayor of Lyons
- Bob Muckle, Mayor of Louisville
- Kris Larsen, Mayor of Nederland
- Will Toor, former Mayor of Boulder
- Susan Osbourne, former Mayor of Boulder
- Christine Berg, Mayor of Lafayette
- Leslie Durgen, former Mayor of Boulder
- Kevin Burns, Mayor of Dillon
- Susan Kirkpatrick, former Mayor of Fort Collins
- Jacki Marsh, Mayor of Loveland
City councilors (Boulder)
- Sam Weaver
- Jill Grano
- Bob Yates
- Macon Cowles, former
- Sally Martin, former
- Ken Wilson, former
- Robin Bohanan, former
- Francois Poinsatte, former
- Andy Schultehsis, former
- Jan Burton, former
- Andrew Schoemaker, former
- Angelique Espinoza, former
City councilors (other)
- Jamie Harkins, Lafayette
- Bette Erickson, Broomfield
- Sharron Tessier, Broomfield
- Guyleen Castriota, Broomfield
- Deven Shaff, Broomfield
- Stan Jezierski, Broomfield
- Bob Overbeck, Fort Collins
- Richard Ball, Loveland
- Leah Johnson, Loveland
- Kristi Stephens, Fort Collins, former
County officials (Boulder)
- Josie Heath, former commissioner
- Bean Pearlman, former commissioner
- Elise Jones, commissioner
- Deb Gardner, commissioner
- Cindy Domenico, commissioner
- Stan Garnett, former District Attorney
- Bob Hullinghorst, former treasurer
- Former Boulder County Democratic Party chair Dan Gould
- Former Boulder County Democratic Party chair Joel Davidow
- Former Boulder County Democratic Party vice chair Laura Spicer
- Paul Weissman, treasurer
- Joe Pelle, sheriff
County officials (others)
- Kathy Plomer, Adams 12 school board member
- Tom Mehling, Former Broomfield County Democratic Party chair
- Judy Enderle, Former Broomfield County Democratic Party chair
- Randy Wheelock, former Clear Creek county commissioner
- Sandy Briggs, former Summit County Democratic Party chair
- Bruce Brown, District Attorney, D5
- Jill Ryan, Eagle County commissioner
- Tim Mauch, Clear Creek County commissioner
- Beverly Breakstone, Summit County assessor
- Thomas Davidson, Summit County commissioner
- Karn Stiegelmeiser, Summit County commissioner
- Dan Gibbs, Summit County commissioner
Others
- Val Flores, state board of education member
- Aaron Brocket, Boulder mayor pro tem
- Rich Pelletier, former deputy campaign manager for Bernie Sanders
- Dr. Noah Finkelsteni, Director of Colorado Center for STEM Learning
- Neal Lurie, President of Center for Resource Conservation
- Sean Maher, former executive director of Boulder Small Business Development Center
- Suzy Ageton, former Boulder deputy mayor
- Nikhi Mankekar, deputy chairperson of Boulder Human Relations Commission
- Mark Lacis, Superior Town Trustee
- JoyAnn Ruscha (former Colorado political director for Bernie Sanders for president)
Results edit
| Party | Candidate | Votes | % | |
|---|---|---|---|---|
| Democratic | Joe Neguse | 76,829 | 65.7 | |
| Democratic | Mark Williams | 40,044 | 34.3 | |
| Total votes | 116,873 | 100.0 | ||
Republican primary edit
Candidates edit
Nominee edit
- Peter Yu, businessman[24]
Results edit
| Party | Candidate | Votes | % | |
|---|---|---|---|---|
| Republican | Peter Yu | 45,970 | 100.0 | |
| Total votes | 45,970 | 100.0 | ||
Libertarian primary edit
Candidates edit
Nominee edit
- Roger Barris
Withdrawn edit
Independents edit
Candidates edit
- Nick Thomas[27]
General election edit
Results edit
| Party | Candidate | Votes | % | |
|---|---|---|---|---|
| Democratic | Joe Neguse | 259,608 | 60.3 | |
| Republican | Peter Yu | 144,901 | 33.6 | |
| Independent | Nick Thomas | 16,356 | 3.8 | |
| Libertarian | Roger Barris | 9,749 | 2.3 | |
| Green | Kevin Alumbaugh (write-in) | 151 | 0.0 | |
| Total votes | 430,765 | 100.0 | ||
| Democratic hold | ||||
District 3 edit
| |||||||||||||||||
 Tipton: 40-50% 50-60% 60-70% 70-80% 80-90% Bush: 50-60% 60-70% 70-80%  Tipton: 40–50% 50–60% 60–70% 70–80% 80–90% >90% Bush: 40–50% 50–60% 60–70% 70–80% 80–90% Tie: 40–50% | |||||||||||||||||
| |||||||||||||||||


The 3rd district is located in Western and Southern Colorado and includes a large number of sparsely populated counties and the city of Grand Junction. Incumbent Republican Scott Tipton, who had represented the district since 2011, ran for re-election. He was re-elected with 55% of the vote in 2016. The district had a PVI of R+6.
Republican primary edit
Candidates edit
Nominee edit
- Scott Tipton, incumbent U.S. Representative
Results edit
| Party | Candidate | Votes | % | |
|---|---|---|---|---|
| Republican | Scott Tipton (incumbent) | 66,854 | 100.0 | |
| Total votes | 66,854 | 100.0 | ||
Democratic primary edit
This was one of 80 Republican-held House districts targeted by the Democratic Congressional Campaign Committee in 2018.[28]
Candidates edit
Nominee edit
Eliminated in primary edit
- Karl Hanlon, Glenwood Springs city attorney[30]
- Arn Menconi, former Eagle County commissioner[31]
Withdrawn edit
- Chris Kennedy, Grand Junction city councilman[32]
Declined edit
- Kerry Donovan, state senator for the 5th District[19] (running for re-election)
Results edit
| Party | Candidate | Votes | % | |
|---|---|---|---|---|
| Democratic | Diane Mitsch Bush | 44,809 | 64.1 | |
| Democratic | Karl Hanlon | 19,368 | 27.7 | |
| Democratic | Arn Menconi | 5,754 | 8.2 | |
| Total votes | 69,931 | 100.0 | ||
General election edit
Polling edit
| Poll source | Date(s) administered |
Sample size |
Margin of error |
Scott Tipton (R) |
Diane Mitsch Bush (D) |
Other | Undecided |
|---|---|---|---|---|---|---|---|
| JMC Analytics/Bold Blue Campaigns | October 27 – November 2, 2018 | 500 | ± 4.5% | 46% | 41% | 5%[33] | 7% |
| Change Research (D) | October 27–29, 2018 | 485 | – | 53% | 38% | – | 9% |
Predictions edit
| Source | Ranking | As of |
|---|---|---|
| The Cook Political Report[34] | Likely R | November 5, 2018 |
| Inside Elections[35] | Safe R | November 5, 2018 |
| Sabato's Crystal Ball[36] | Lean R | November 5, 2018 |
| RCP[37] | Likely R | November 5, 2018 |
| Daily Kos[38] | Likely R | November 5, 2018 |
| 538[39] | Likely R | November 7, 2018 |
| CNN[40] | Safe R | October 31, 2018 |
| Politico[41] | Likely R | November 4, 2018 |
Results edit
| Party | Candidate | Votes | % | |
|---|---|---|---|---|
| Republican | Scott Tipton (incumbent) | 173,205 | 51.5 | |
| Democratic | Diane Mitsch Bush | 146,426 | 43.6 | |
| Independent | Mary Malarsie | 10,831 | 3.2 | |
| Libertarian | Gaylon Kent | 5,727 | 1.7 | |
| Green | Gary Swing (write-in) | 9 | 0.0 | |
| Write-in | 3 | 0.0 | ||
| Total votes | 336,201 | 100 | ||
| Republican hold | ||||
District 4 edit
| |||||||||||||||||
 Buck: 50-60% 60-70% 70-80% 80-90% McCormick: 60-70%  Buck: 50–60% 60–70% 70–80% 80–90% >90% McCormick: 50–60% 60–70% 70–80% 80–90% No votes | |||||||||||||||||
| |||||||||||||||||

The 4th district is located in Eastern Colorado and includes numerous sparsely populated counties. Incumbent Republican Ken Buck, who had represented the district since 2015, ran for re-election. He was re-elected with 64% of the vote in 2016. The district had a PVI of R+13.
Republican primary edit
Candidates edit
Nominee edit
- Ken Buck, incumbent U.S. Representative
Eliminated at convention edit
Results edit
| Party | Candidate | Votes | % | |
|---|---|---|---|---|
| Republican | Ken Buck (incumbent) | 85,290 | 100.0 | |
| Total votes | 85,290 | 100.0 | ||
Democratic primary edit
Candidates edit
Nominee edit
- Karen McCormick, veterinarian[43]
Eliminated in primary edit
- Chase Kohne, veteran, veterinarian and small business owner[44]
Eliminated at Convention edit
- Larry Germanson
- Richard Weil
Endorsements edit
Results edit
- 50–60%
- 60–70%
- 70–80%
| Party | Candidate | Votes | % | |
|---|---|---|---|---|
| Democratic | Karen McCormick | 37,120 | 64.7 | |
| Democratic | Chase Kohne | 20,269 | 35.3 | |
| Total votes | 57,389 | 100.0 | ||
General election edit
Results edit
| Party | Candidate | Votes | % | |
|---|---|---|---|---|
| Republican | Ken Buck (incumbent) | 224,038 | 60.6 | |
| Democratic | Karen McCormick | 145,544 | 39.4 | |
| Green | John Vigil (write-in) | 26 | 0.0 | |
| Write-in | 12 | 0.0 | ||
| Total votes | 369,620 | 100.0 | ||
| Republican hold | ||||
District 5 edit
| |||||||||||||||||
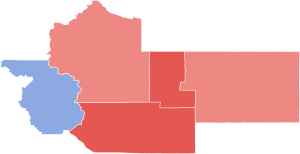 Lamborn: 50-60% 60-70% Spaulding: 50-60%  Lamborn: 40–50% 50–60% 60–70% 70–80% 80–90% Spaulding: 40–50% 50–60% 60–70% 70–80% 80–90% | |||||||||||||||||
| |||||||||||||||||

The 5th district is located in Central Colorado and includes Fremont, El Paso, Teller and Chaffee counties and the city of Colorado Springs. Incumbent Republican Doug Lamborn, who had represented the district since 2007, ran for re-election. He was re-elected with 62% of the vote in 2016. The district had a PVI of R+14.
Republican primary edit
Candidates edit
Nominee edit
- Doug Lamborn, incumbent U.S. Representative[47]
Eliminated in primary edit
- Darryl Glenn, El Paso County Commissioner and nominee for the U.S. Senate in 2016[48]
- Owen Hill, state senator[49]
- Bill Rhea, retired Texas judge[50]
- Tyler Stevens, former Green Mountain Falls Mayor[51]
Withdrawn edit
- Tom Strand, Colorado Springs City Council member[52]
Polling edit
| Poll source | Date(s) administered |
Sample size |
Margin of error |
Darryl Glenn |
Owen Hill |
Doug Lamborn |
Bill Rhea |
Tyler Stevens |
Undecided |
|---|---|---|---|---|---|---|---|---|---|
| Magellan Strategies | May 20–21, 2018 | 519 | ± 4.3% | 27% | 10% | 37% | 2% | 3% | 21% |
Results edit
| Party | Candidate | Votes | % | |
|---|---|---|---|---|
| Republican | Doug Lamborn (incumbent) | 54,974 | 52.2 | |
| Republican | Darryl Glenn | 21,479 | 20.4 | |
| Republican | Owen Hill | 19,141 | 18.2 | |
| Republican | Bill Rhea | 6,167 | 5.9 | |
| Republican | Tyler Stevens | 3,643 | 3.5 | |
| Total votes | 105,404 | 100.0 | ||
Democratic primary edit
Candidates edit
Nominee edit
- Stephany Rose Spaulding, activist, public commentator, pastor of Ebenezer Baptist Church in Colorado Springs and associate professor of Women's and Ethnic Studies at the University of Colorado Colorado Springs
Eliminated in primary edit
- Marcus Murphy (write-in)
Eliminated at Convention edit
- Betty Field, social worker and former executive director for the Black Hills Center for Equality[53]
- Lori Furstenberg
- Kimberly Sugarmen
Results edit
| Party | Candidate | Votes | % | |
|---|---|---|---|---|
| Democratic | Stephany Rose Spaulding | 45,466 | 99.9 | |
| Write-in | 38 | 0.1 | ||
| Total votes | 45,504 | 100.0 | ||
Libertarian primary edit
Candidates edit
Nominee edit
- Douglas Randall
General election edit
Results edit
| Party | Candidate | Votes | % | |
|---|---|---|---|---|
| Republican | Doug Lamborn (incumbent) | 184,002 | 57.0 | |
| Democratic | Stephany Rose Spaulding | 126,848 | 39.3 | |
| Libertarian | Douglas Randall | 11,795 | 3.7 | |
| Unity | John Croom (write-in) | 16 | 0.0 | |
| Write-in | 55 | 0.0 | ||
| Total votes | 322,716 | 100.0 | ||
| Republican hold | ||||
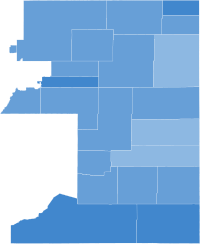
District 6 edit
| |||||||||||||||||
 Crow: 40-50% 50-60% Coffman: 50-60%  Crow: 40–50% 50–60% 60–70% 70–80% Coffman: 40–50% 50–60% 60–70% 70–80% No votes | |||||||||||||||||
| |||||||||||||||||


The 6th district is located in Central Colorado and surrounds the city of Denver from the east, including the city of Aurora. Incumbent Republican Mike Coffman, who had represented the district since 2009, ran for re-election. He was re-elected with 51% of the vote in 2016. The district had a PVI of D+2.
Republican primary edit
Candidates edit
Nominee edit
- Mike Coffman, incumbent U.S. Representative
Results edit
| Party | Candidate | Votes | % | |
|---|---|---|---|---|
| Republican | Mike Coffman (incumbent) | 56,703 | 100.0 | |
| Total votes | 56,703 | 100.0 | ||
Democratic primary edit
This was one of 80 Republican-held House districts targeted by the Democratic Congressional Campaign Committee in 2018.[28]
Candidates edit
Nominee edit
- Jason Crow, attorney[54]
Eliminated in primary edit
- Levi Tillemann, businessman[55]
Withdrawn edit
- David Aarestad, attorney and former candidate for the Cherry Creek School District[56]
- Gabriel McArthur, Bernie Sanders delegate to the 2016 Democratic National Convention (endorsed Tillemann)[57]
Results edit
| Party | Candidate | Votes | % | |
|---|---|---|---|---|
| Democratic | Jason Crow | 49,851 | 65.9 | |
| Democratic | Levi Tillemann | 25,757 | 34.1 | |
| Total votes | 75,608 | 100.0 | ||
General election edit
Endorsements edit
- Organizations
- Democratic Congressional Campaign Committee "Red to Blue" Program[60]
Polling edit
| Poll source | Date(s) administered |
Sample size |
Margin of error |
Mike Coffman (R) |
Jason Crow (D) |
Undecided |
|---|---|---|---|---|---|---|
| NYT Upshot/Siena College | October 13–17, 2018 | 506 | ± 4.5% | 38% | 47% | 9% |
| Normington, Petts & Associates (D) | September 18–23, 2018 | 400 | ± 4.9% | 38% | 49% | 13% |
| NYT Upshot/Siena College | September 12–14, 2018 | 500 | ± 4.8% | 40% | 51% | 9% |
| The Tarrance Group (R-Coffman) | September 11–13, 2018 | 400 | ± 4.9% | 45% | 46% | 9% |
| IMGE Insights (R) | July 9–12, 2018 | 400 | – | 45% | 45% | 10% |
| Global Strategy Group (D-Crow) | July 11–17, 2018 | 506 | ± 4.4% | 45% | 47% | 8% |
| Normington, Petts & Associates (D) | July 9–11, 2018 | 400 | – | 44% | 41% | 15% |
| Public Policy Polling (D) | February 15–18, 2018 | 751 | ± 3.6% | 39% | 44% | 17% |
| Public Policy Polling (D) | October 5–8, 2017 | 742 | ± 3.6% | 43% | 36% | 21% |
Predictions edit
| Source | Ranking | As of |
|---|---|---|
| The Cook Political Report[34] | Lean D (flip) | November 5, 2018 |
| Inside Elections[35] | Tilt D (flip) | November 5, 2018 |
| Sabato's Crystal Ball[36] | Lean D (flip) | November 5, 2018 |
| RCP[37] | Lean D (flip) | November 5, 2018 |
| Daily Kos[38] | Lean D (flip) | November 5, 2018 |
| 538[39] | Likely D (flip) | November 7, 2018 |
| CNN[40] | Lean D (flip) | October 31, 2018 |
| Politico[41] | Lean D (flip) | November 4, 2018 |
Results edit
| Party | Candidate | Votes | % | |
|---|---|---|---|---|
| Democratic | Jason Crow | 187,639 | 54.1 | |
| Republican | Mike Coffman (incumbent) | 148,685 | 42.9 | |
| Libertarian | Kat Martin | 5,886 | 1.7 | |
| Unity | Dan Chapin | 4,607 | 1.3 | |
| Green | Christopher Allen (write-in) | 5 | 0.0 | |
| Total votes | 346,822 | 100.0 | ||
| Democratic gain from Republican | ||||
District 7 edit
| |||||||||||||||||
 Perlmutter: 60-70% 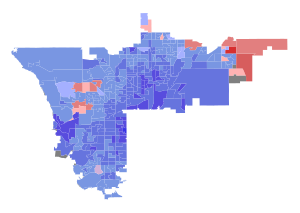 Perlmutter: 40–50% 50–60% 60–70% 70–80% 80–90% Barrington: 40–50% 50–60% 60–70% 70–80% Tie: 40–50% No votes | |||||||||||||||||
| |||||||||||||||||

The 7th district is located in Central Colorado, to the north and west of Denver and includes the cities of Thornton and Westminster and most of Lakewood. Incumbent Democrat Ed Perlmutter, who had represented the district since 2007, ran for re-election. He was re-elected with 55% of the vote in 2016. The district had a PVI of D+6.
Democratic primary edit
Perlmutter announced a run for governor, but later withdrew from that race. He later announced that he would not run for re-election.[61] However, on August 21, 2017, he announced that he had changed his mind.
Candidates edit
Nominee edit
- Ed Perlmutter, incumbent U.S. Representative[62]
Withdrawn edit
- Daniel Baer, former U.S. ambassador to the Organization for Security and Co-operation in Europe[63]
- Andy Kerr, state senator[64]
- Dominick Moreno, state senator[62]
- Brittany Pettersen, state representative[62]
Results edit
| Party | Candidate | Votes | % | |
|---|---|---|---|---|
| Democratic | Ed Perlmutter (incumbent) | 81,991 | 100.0 | |
| Total votes | 81,991 | 100.0 | ||
Republican primary edit
Colorado's 7th district was included on the initial list of Democratic-held seats being targeted by the National Republican Congressional Committee in 2018.[65]
Candidates edit
Nominee edit
Declined edit
- Don Ytterberg, former chair of the Jefferson County Republican Party, former vice chair of the Colorado Republican Party and nominee for this seat in 2014[67]
Results edit
| Party | Candidate | Votes | % | |
|---|---|---|---|---|
| Republican | Mark Barrington | 46,028 | 100.0 | |
| Total votes | 46,028 | 100.0 | ||
Independents edit
Candidates edit
- Nathan Clay[68]
General election edit
Results edit
| Party | Candidate | Votes | % | |
|---|---|---|---|---|
| Democratic | Ed Perlmutter (incumbent) | 204,260 | 60.4 | |
| Republican | Mark Barrington | 119,734 | 35.4 | |
| Libertarian | Jennifer Nackerud | 14,012 | 4.1 | |
| Green | Michael Haughey (write-in) | 16 | 0.0 | |
| Write-in | 45 | 0.0 | ||
| Total votes | 338,067 | 100.0 | ||
| Democratic hold | ||||
References edit
- ^ Johnson, Cheryl L. (February 28, 2019). "Statistics of the Congressional Election of November 6, 2018". Clerk of the U.S. House of Representatives. Retrieved April 27, 2019.
- ^ RAO, SAIRA
- ^ "David Sedbrook for CD1". Archived from the original on March 8, 2018. Retrieved August 4, 2023.
- ^ Ernest Luning (April 13, 2018). "Diana DeGette lands endorsement from former primary rival David Sedbrook". coloradopolitics.com. Colorado Politics. Retrieved August 4, 2023.
- ^ "Endorsements - Saira for Congress". Archived from the original on November 10, 2018.
{{cite web}}: CS1 maint: unfit URL (link) - ^ a b c d e f g "2018 Colorado Democratic primary election results". Retrieved June 21, 2019.
- ^ STOCKHAM, CHARLES (CASPER) WESLEY
- ^ FIELD, JOHN
- ^ JEREMIAH
- ^ a b c d e f g "2018 Colorado Republican primary election results". Retrieved June 21, 2019.
- ^ DOANE, RAYMON ANTHONY
- ^ a b c d e f g "2018 Colorado general election results". Retrieved June 21, 2019.
- ^ Matthews, Mark K. (June 11, 2017). "Jared Polis to join crowded 2018 race for governor, tells The Post he wants "a Colorado that works for everybody"". The Denver Post. Retrieved June 11, 2017.
- ^ Matthews, Mark K. (June 13, 2017). "Joe Neguse declares run for Jared Polis' seat in Congress". The Denver Post. Retrieved June 13, 2017.
- ^ Fryar, John (September 8, 2017). "Boulder Democrat Mark Williams announces bid for Jared Polis' 2nd CD seat". Longmont Daily Times-Call.
- ^ Paul, Jesse (March 13, 2018). "Nederland Mayor Kristopher Larsen ends his bid for Congress". The Denver Post. Retrieved March 17, 2018.
- ^ a b Hindi, Saja; Ferrier, Pat (June 13, 2017). "Larimer hopefuls line up for Polis' seat in Congress". Fort Collins Coloradoan. Retrieved June 13, 2017.
- ^ Paul, Jesse (December 17, 2017). "Ken Toltz is suspending his campaign to replace Polis, citing family health reasons". The Denver Post. Retrieved December 18, 2017.
- ^ a b Bunch, Joey (June 23, 2017). "Kerry Donovan will stay on the ranch and in the Capitol, because Congress can wait". Colorado Politics. Retrieved February 26, 2023.
- ^ a b c d e Bowman, Bridget (June 11, 2017). "Polis' Run for Governor Opens Up Solidly Democratic Seat". Roll Call. Retrieved June 11, 2017.
- ^ Paul, Jesse (September 26, 2017). "Shannon Watts decides against running to replace Jared Polis in the 2nd Congressional District". The Denver Post. Retrieved September 27, 2017.
- ^ "Endorsements".
- ^ Facebook post [user-generated source]
- ^ YU, PETER
- ^ Marcus, Peter (August 28, 2017). "Libertarian Todd Mitchem announces run for Congress with a marijuana focus". Colorado Politics. Retrieved August 28, 2017.
- ^ Mitchem, Todd (November 13, 2017). "Why Pot Industry Veteran Todd Mitchem Is Dropping His Congressional Bid". Archived from the original on November 1, 2017. Retrieved November 26, 2017.
- ^ THOMAS, NICHOLAS STEPHEN DRESELLY
- ^ a b "Charging Forward, DCCC Announces Battlefield Expansion" (PDF). dccc.org. Retrieved March 6, 2023.
- ^ Perkins, Luke (July 6, 2017). "Steamboat Springs Democrat will challenge Scott Tipton for House seat". The Durango Herald. Retrieved July 6, 2017.
- ^ Stroud, John (November 29, 2017). "Glenwood Springs attorney Karl Hanlon to run for Congress". Post Independent Citizen Telegram. Glenwood Springs, Colorado. Retrieved December 1, 2017.
- ^ Bunch, Joey (February 27, 2018). "Arn Menconi joins race to unseat Rep. Scott Tipton in 3rd CD". Colorado Politics. Retrieved February 27, 2018.
- ^ Luning, Ernest (December 7, 2017). "Grand Junction Councilman Chris Kennedy drops out of 3rd Congressional District Democratic primary". Colorado Politics. Retrieved December 8, 2017.
- ^ Gaylon Kent (L) with 4%, Mary Malarsie (I) with 1%
- ^ a b "2018 House Race Ratings". Cook Political Report. Retrieved October 30, 2018.
- ^ a b "2018 House Ratings". The Rothenberg Political Report. Retrieved November 5, 2018.
- ^ a b "2018 House". Sabato's Crystal Ball. Retrieved November 5, 2018.
- ^ a b "Battle for the House 2018". RCP. Retrieved November 5, 2018.
- ^ a b "Daily Kos Elections 2018 race ratings". Daily Kos. Retrieved November 5, 2018.[permanent dead link]
- ^ a b Silver, Nate (August 16, 2018). "2018 House Forecast". FiveThirtyEight. Retrieved November 6, 2018.
- ^ a b "CNN's 2018 Race Ratings". cnn.com. Turner Broadcasting System. Archived from the original on October 31, 2018. Retrieved July 30, 2023.
- ^ a b "Who wins 2018? Predictions for Every House & Senate Election". POLITICO. Archived from the original on November 4, 2018. Retrieved September 7, 2018.
- ^ Simmons, Tommy (November 10, 2017). "Ken Buck challenged in 2018 primary race by former Lone Tree mayor". Windsor Now!. Archived from the original on November 15, 2017. Retrieved November 15, 2017.
- ^ MCCORMICK, KAREN A DVM
- ^ KOHNE, STEVEN CHASE DR.
- ^ "Democrat Chase Kohne wins Blue Rising PAC's backing in race against U.S. Rep. Ken Buck". January 21, 2018.
- ^ "Tribune Endorsement: Chase Kohne gets a nod in the 4th Congressional District primary race". June 6, 2018.
- ^ "Judge: Colorado Congressman Should be on GOP Primary Ballot". CBN News. May 1, 2018. Retrieved May 3, 2018.
- ^ Luning, Ernest (July 17, 2017). "Darryl Glenn formally announces GOP primary bid versus incumbent Lamborn, Hill". The Colorado Springs Gazette. Retrieved July 19, 2017.
- ^ Marcus, Peter (April 1, 2017). "Colorado Spring's state Sen. Owen Hill to challenge U.S. Rep. Doug Lamborn in 5th CongressionalDistrict". ColoradoPolitics.com. Retrieved April 2, 2017.
- ^ Luning, Ernest (October 11, 2017). "Retired Texas judge, former missionary Bill Rhea launches 'centrist Republican' challenge to Doug Lamborn". Colorado Politics. Retrieved October 11, 2017.
- ^ Zubeck, Pam (February 22, 2018). "Tyler Stevens joins pack running for CD5". Colorado Springs Independent.
- ^ Luning, Ernest (January 10, 2018). "U.S. Rep. Doug Lamborn launches bid for reelection, weighs petitioning onto primary ballot". Colorado Politics. Retrieved January 10, 2018.
- ^ Stein, Nat (May 3, 2017). "Betty Field wants to unseat the congressman who's ignored her". Colorado Springs Indy.
- ^ Eason, Brian (April 11, 2017). "Denver attorney Jason Crow to challenge Mike Coffman in 2018". The Denver Post. Retrieved May 29, 2017.
- ^ Luning, Ernest (June 28, 2017). "Democrat Levi Tillemann plans to make it official—he's running in Colorado's 6th Congressional District". Colorado Politics. Retrieved June 28, 2017.
- ^ "Crow, Tillemann qualify for CD6 primary ballot". April 13, 2018.
- ^ Luning, Ernest (July 24, 2017). "Democrat Gabriel McArthur withdraws from 6th Congressional District primary, endorses Levi Tillemann". Colorado Politics. Retrieved July 24, 2017.
- ^ "CRES Formally Endorses Rep. Mike Coffman in Colorado". CRES. Archived from the original on October 13, 2018. Retrieved October 12, 2018.
- ^ "Endorsement: Mike Coffman's morality must be rewarded in this age of Trump". The Denver Post. October 12, 2018.
- ^ "Red to Blue". dccc.org/. DCCC. Archived from the original on October 31, 2018. Retrieved July 20, 2023.
- ^ "Ed Perlmutter cites shooting of Steve Scalise, lack of "fire in belly" as reasons to exit politics". The Denver Post. July 11, 2017. Retrieved July 28, 2017.
- ^ a b c Bunch, Joey (August 21, 2018). "Perlmutter is back in congressional race, Moreno and Pettersen suspend campaigns". Colorado Politics. Retrieved August 21, 2017.
- ^ Luning, Ernest (October 5, 2017). "Democrat Dan Baer drops bid challenging Colorado U.S. Rep. Ed Perlmutter". Colorado Politics. Retrieved October 5, 2017.
- ^ Luning, Ernest (August 22, 2017). "Democrat Andy Kerr suspends congressional campaign, endorses Ed Perlmutter after he gets back in". Colorado Politics. Retrieved August 22, 2017.
- ^ Isenstadt, Alex (February 8, 2017). "House Republicans name Democratic targets for 2018". Politico. Retrieved March 23, 2017.
- ^ Luning, Ernest (February 25, 2018). "Trail Mix: The road to Colorado's 2018 election, Feb. 25 edition". Colorado Politics. Retrieved February 25, 2018.
- ^ Marcus, Peter (March 27, 2017). "Ed Perlmutter thanks supporters ahead of run for Colorado governor". ColoradoPolitics.com. Retrieved April 2, 2017.
- ^ CLAY, NATHAN
External links edit
- Candidates at Vote Smart
- Candidates at Ballotpedia
- Campaign finance at FEC
- Campaign finance at OpenSecrets
- Official campaign websites of first district candidates
- Diana DeGette (D) for Congress
- Casper Stockham (R) for Congress
- Official campaign websites of second district candidates
- Joe Neguse (D) for Congress
- Peter Yu (R) for Congress
- Official campaign websites of third district candidates
- Diane Mitsch Bush (D) for Congress
- Scott Tipton (R) for Congress
- Official campaign websites of fourth district candidates
- Ken Buck (R) for Congress
- Karen McCormick (D) for Congress
- Official campaign websites of fifth district candidates
- Doug Lamborn (R) for Congress
- Stephany Rose Spaulding (D) for Congress
- Official campaign websites of sixth district candidates
- Mike Coffman (R) for Congress
- Jason Crow (D) for Congress
- Official campaign websites of seventh district candidates
- Mark Barrington (R) for Congress
- Ed Perlmutter (D) for Congress