
KNOWPIA
WELCOME TO KNOWPIA

2019 Nottingham City Council election 
Summary
The 2019 elections to Nottingham City Council were held on 2 May 2019 to elect all 55 members to the council across 20 wards.
| |||||||||||||||||||||||||
All 55 seats to Nottingham City Council 28 seats needed for a majority | |||||||||||||||||||||||||
|---|---|---|---|---|---|---|---|---|---|---|---|---|---|---|---|---|---|---|---|---|---|---|---|---|---|
| Turnout | 29% | ||||||||||||||||||||||||
| |||||||||||||||||||||||||
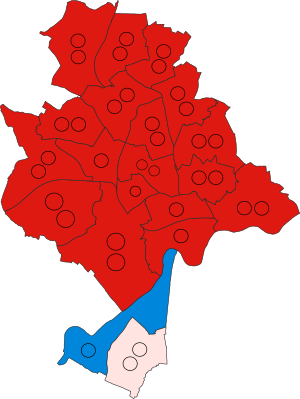 Map of the results of the 2019 election | |||||||||||||||||||||||||
Overall results edit
In total, Labour won 50 seats, the Nottingham Independents won 3 and the Conservatives won 2. Turnout was 29%.[1][2]
| Nottingham City Council election, 2019 | |||||||||||||||
|---|---|---|---|---|---|---|---|---|---|---|---|---|---|---|---|
| Party | Candidates | Votes | |||||||||||||
| Stood | Elected | Gained | Unseated | Net | % of total | % | No. | Net % | |||||||
| Labour | 55 | 50 | 0 | 2 | -2 | 91.0 | 62.6 | 97,089 | |||||||
| Nottingham Ind. | 7 | 3 | 3 | 0 | +3 | 5.0 | 4.4 | 6,831 | |||||||
| Conservative | 55 | 2 | 0 | 1 | -1 | 4 | 18.5 | 28,727 | |||||||
| Liberal Democrats | 33 | 0 | 0 | 0 | 0 | 0 | 6.7 | 10,420 | |||||||
| Green | 14 | 0 | 0 | 0 | 0 | 0 | 5.5 | 8,601 | |||||||
| UKIP | 5 | 0 | 0 | 0 | 0 | 0 | 1.6 | 2,428 | |||||||
| Independent | 3 | 0 | 0 | 0 | 0 | 0 | 0.5 | 797 | |||||||
| Bus-Pass Elvis | 1 | 0 | 0 | 0 | 0 | 0 | 0.1 | 82 | |||||||
Results by ward edit
Source: Sandeman, Kit (4 May 2019). "Full list of candidates for Nottingham City Council elections 2019". Nottingham Post. Reach plc. Archived from the original on 24 June 2020. Retrieved 1 October 2019.
Aspley edit
| Party | Candidate | Votes | % | |
|---|---|---|---|---|
| Labour | Graham Ransley Chapman | 2,112 | 74.1 | |
| Labour | Carole Williams McCulloch | 1,988 | 69.8 | |
| Labour | Patience Uloma Ifediora | 1,896 | 66.5 | |
| Independent | Bill Ottewell | 452 | 15.9 | |
| Conservative | Thomas James Connelly | 299 | 10.5 | |
| Liberal Democrats | John Calvert | 263 | 9.2 | |
| Conservative | Connor Neil Malone | 259 | 9.1 | |
| Conservative | Nicholas John Packham | 235 | 8.2 | |
| Turnout | 2,894 | 25% | ||
Basford edit
| Party | Candidate | Votes | % | |
|---|---|---|---|---|
| Labour | Nick Raine | 1,710 | 56.7 | |
| Labour | Linda Mary Woodings | 1,656 | 54.9 | |
| Labour | Salma Mumtaz | 1,535 | 50.9 | |
| Nottingham Ind. | Wayne Anthony Unczur | 682 | 22.6 | |
| Conservative | Rebecca Sarah Ironmonger | 577 | 19.1 | |
| Conservative | Ian Culley | 553 | 18.3 | |
| Green | Andrew Guy Jones | 525 | 17.4 | |
| Conservative | Esi Aboni | 434 | 14.4 | |
| Liberal Democrats | Tadeusz Zdzislaw Edward Jones | 279 | 9.2 | |
| Turnout | 3,045 | 26% | ||
Berridge edit
| Party | Candidate | Votes | % | |
|---|---|---|---|---|
| Labour | Angela Kandola | 2,369 | 66.3 | |
| Labour | Toby Charles Neal | 2,213 | 61.9 | |
| Labour | Shuguftah Jabeen Quddoos | 2,205 | 61.7 | |
| Green | Ellie Mitchell | 888 | 24.9 | |
| Green | Ted Salt | 613 | 17.2 | |
| Conservative | Susan Jane Brittain | 461 | 12.9 | |
| Conservative | Francis James Desmond Hull | 409 | 11.4 | |
| Liberal Democrats | Richard James Minkley | 379 | 10.6 | |
| Conservative | Anthony Neale Gerald Mittenshaw-Hodge | 337 | 9.4 | |
| Turnout | 3,610 | 33% | ||
Bestwood edit
| Party | Candidate | Votes | % | |
|---|---|---|---|---|
| Labour | Jay Michael Hayes | 1,607 | 53.0 | |
| Labour | Georgia Emily Power | 1,328 | 43.8 | |
| Labour | Audra Marie Wynter | 1,303 | 43.0 | |
| Nottingham Ind. | Francesco Lari | 1,195 | 39.4 | |
| UKIP | Alan John Margerison | 677 | 22.3 | |
| UKIP | Lawrence George Payne | 657 | 21.7 | |
| Conservative | Lewis Blight | 325 | 10.7 | |
| Conservative | Julie Ann Hallett | 316 | 10.4 | |
| Liberal Democrats | Christina Morgan-Danvers | 232 | 7.6 | |
| Conservative | Roger Frederick Wykes | 212 | 7.0 | |
| Turnout | 3,047 | 25% | ||
Bilborough edit
| Party | Candidate | Votes | % | |
|---|---|---|---|---|
| Labour | Wendy Barbara Smith | 2,114 | 64.3 | |
| Labour | Phil Jackson | 2,012 | 61.2 | |
| Labour | Rebecca Cerin Langton | 1,866 | 56.8 | |
| Green | Tony Stock | 645 | 19.6 | |
| Conservative | Roger David Alton | 574 | 17.5 | |
| Conservative | David Harry Gillott | 549 | 16.7 | |
| Conservative | Alistair Dudley Hudson | 516 | 15.7 | |
| Liberal Democrats | Liz Morgan-Danvers | 417 | 12.7 | |
| Turnout | 3,356 | 27% | ||
Bulwell edit
| Party | Candidate | Votes | % | |
|---|---|---|---|---|
| Labour | Jane Lakey | 1,668 | 61.5 | |
| Labour | Maria Joannou | 1,439 | 53.0 | |
| Labour | Ethan Benjamin Radford | 1,371 | 50.5 | |
| Nottingham Ind. | Graham Stuart Palk | 839 | 30.9 | |
| Conservative | David Johnson | 476 | 17.5 | |
| Conservative | Veronica Helena Pole | 402 | 14.8 | |
| Conservative | Giles Julian Stratton | 366 | 13.5 | |
| Liberal Democrats | Daniel Gordo-Holmes | 308 | 11.3 | |
| Turnout | 2,761 | 24% | ||
Bulwell Forest edit
| Party | Candidate | Votes | % | |
|---|---|---|---|---|
| Labour | Eunice Fay Campbell-Clark | 1,903 | 58.8 | |
| Labour | Cheryl Margaret Barnard | 1,797 | 55.5 | |
| Labour | Samuel James Gardiner | 1,691 | 52.2 | |
| Nottingham Ind. | Jeff Kilbourne | 782 | 24.1 | |
| Conservative | Joanna Louise Husted | 751 | 23.2 | |
| Conservative | Glyn Walter Johns | 633 | 19.5 | |
| Conservative | Alfred Stephen Pryor | 559 | 17.3 | |
| Liberal Democrats | Michael Howard Procter | 253 | 7.8 | |
| Turnout | 3,274 | 31% | ||
Castle edit
| Party | Candidate | Votes | % | |
|---|---|---|---|---|
| Labour | Angharad Roberts | 800 | 42.1 | |
| Labour | Sam Webster | 772 | 40.6 | |
| Liberal Democrats | Stephen Paul Freeland | 573 | 30.2 | |
| Liberal Democrats | Tony Bernard Sutton | 446 | 23.5 | |
| Green | Liam Elliott McClelland | 370 | 19.5 | |
| Conservative | Nick Max | 344 | 18.1 | |
| Conservative | Paul Vincent Ruane | 299 | 15.7 | |
| Bus-Pass Elvis | David Laurence Bishop | 82 | 4.3 | |
| Turnout | 1,912 | 29% | ||
Clifton East edit
| Party | Candidate | Votes | % | |
|---|---|---|---|---|
| Nottingham Ind. | Maria Ann Watson | 1,456 | 44.2 | |
| Nottingham Ind. | Kirsty Jones | 1,382 | 42.0 | |
| Nottingham Ind. | Kevin Clarke | 1,334 | 40.5 | |
| Labour | Joshua Johnathan Callum Cook | 1,305 | 39.7 | |
| Labour | Chris Gibson | 1,144 | 34.8 | |
| Labour | Corall Joy Jenkins | 1,074 | 32.6 | |
| Conservative | Andrew Price | 435 | 13.2 | |
| Conservative | Caroline Kampila | 381 | 11.6 | |
| Conservative | William Raymond Scott | 336 | 10.2 | |
| Liberal Democrats | Diane Jean Rotherham | 204 | 6.2 | |
| Turnout | 3,310 | 26% | ||
Clifton West edit
| Party | Candidate | Votes | % | |
|---|---|---|---|---|
| Conservative | Andrew James Peter Rule | 1,649 | 57.2 | |
| Conservative | Roger David Steel | 1,609 | 55.8 | |
| Labour | Phil Spear | 987 | 34.2 | |
| Labour | Maria Claire Fawcett | 886 | 30.7 | |
| Liberal Democrats | Rahul Soni | 273 | 9.5 | |
| Turnout | 2,957 | 39% | ||
Dales edit
| Party | Candidate | Votes | % | |
|---|---|---|---|---|
| Labour | David Mellen | 2,499 | 69.0 | |
| Labour | Gul Nawaz Khan | 2,190 | 60.4 | |
| Labour | Neghat Nawaz Khan | 2,185 | 60.3 | |
| Green | Dawn Kathleen Plumb | 668 | 18.4 | |
| Green | Natalie Hurst | 631 | 17.4 | |
| Conservative | Daniel John Atherton | 549 | 15.2 | |
| Conservative | Gwendoline Mary Duncan | 531 | 14.7 | |
| Conservative | Neil James Harbinson | 492 | 13.6 | |
| Liberal Democrats | Gary Long | 309 | 8.5 | |
| Turnout | 3,657 | 32% | ||
Hyson Green and Arboretum edit
| Party | Candidate | Votes | % | |
|---|---|---|---|---|
| Labour | Merlita Bryan | 2,208 | 79.4 | |
| Labour | Azad Hussain Choudhry | 2,105 | 75.7 | |
| Labour | Jawaid Khalil | 2,019 | 72.6 | |
| Conservative | Andrew Byrne | 294 | 10.6 | |
| Liberal Democrats | Alison Rouse | 264 | 9.5 | |
| Conservative | Alan John Duncan | 260 | 9.4 | |
| Conservative | Margaret Helena Trueman | 259 | 9.3 | |
| Liberal Democrats | Rachel Errin Joanna Saunders | 236 | 8.5 | |
| Liberal Democrats | Benedict Henry Usborne Cross | 217 | 7.8 | |
| Turnout | 2,821 | 24% | ||
Leen Valley edit
| Party | Candidate | Votes | % | |
|---|---|---|---|---|
| Labour | Audrey Jane Dinnall | 1,388 | 63.6 | |
| Labour | Mohammed Saghir | 1,258 | 57.6 | |
| Conservative | David Peter Robert Gibson | 488 | 22.4 | |
| Conservative | Gail Janise Stancliffe | 440 | 20.2 | |
| Liberal Democrats | James Robert Lloyd | 290 | 13.3 | |
| Liberal Democrats | Rebecca Lucy Stephen Procter | 285 | 13.1 | |
| Turnout | 2,219 | 34% | ||
Lenton and Wollaton East edit
| Party | Candidate | Votes | % | |
|---|---|---|---|---|
| Labour | Sally Ann Longford | 1,762 | 67.6 | |
| Labour | David Trimble | 1,582 | 60.7 | |
| Labour | Pavlos Kotsonis | 1,527 | 58.6 | |
| Green | Adam Fergus McGregor | 412 | 15.8 | |
| Conservative | Brigitte Amber Dorothy Armstrong | 379 | 14.5 | |
| Conservative | Brenda Joyce Barber | 374 | 14.3 | |
| Conservative | Paul Jonathan Brittain | 353 | 13.5 | |
| Green | Barbara Ann Warren | 347 | 13.3 | |
| Liberal Democrats | Elizabeth Sheila Barnard | 241 | 9.2 | |
| Liberal Democrats | Doreen Irene Smalley | 230 | 8.8 | |
| Liberal Democrats | Luke Bradley Stott | 182 | 7.0 | |
| Turnout | 2,635 | 21% | ||
Mapperley edit
| Party | Candidate | Votes | % | |
|---|---|---|---|---|
| Labour | Leslie Eni-Itan Ayoola | 1,840 | 51.4 | |
| Labour | Rosemary Elizabeth Caroline Healy | 1,795 | 50.2 | |
| Labour | Sajid Mohammed | 1,503 | 42.0 | |
| Green | Cath Wakeman | 980 | 27.4 | |
| Green | Neil Barrett | 806 | 22.5 | |
| Conservative | John Lester Firth | 684 | 19.1 | |
| Green | Jonathan Clive Walker | 680 | 19.0 | |
| Conservative | Penelope Anne Messenger | 663 | 18.5 | |
| Conservative | Alexander Ewan Lamont | 665 | 18.6 | |
| Liberal Democrats | Peter Charles Mendenhall | 330 | 9.2 | |
| Liberal Democrats | Alexander James Foster | 321 | 9.0 | |
| Turnout | 3,617 | 32% | ||
Meadows edit
| Party | Candidate | Votes | % | |
|---|---|---|---|---|
| Labour | Nicola Clare Heaton | 1,540 | 67.8 | |
| Labour | Michael Mountford Edwards | 1,299 | 57.2 | |
| Independent | Jonathan Duncan Stuart Hughes | 345 | 15.2 | |
| Liberal Democrats | Saghir Akhtar | 331 | 14.6 | |
| Green | Ceri Pryke-Hendy | 271 | 11.9 | |
| Liberal Democrats | Barry Ian Holliday | 168 | 7.4 | |
| Conservative | Felicity Marion Whiting Crofts | 162 | 7.1 | |
| Conservative | Bradley Richard Wing | 131 | 5.8 | |
| Turnout | 2,283 | 33% | ||
Radford edit
| Party | Candidate | Votes | % | |
|---|---|---|---|---|
| Labour | Anne Sara Peach | 1,022 | 77.8 | |
| Labour | Hassan Ahmed | 1,003 | 76.4 | |
| Liberal Democrats | Jacqueline Hale | 142 | 10.8 | |
| Liberal Democrats | Ian Reginald Hale | 123 | 9.4 | |
| Conservative | Janet Scott | 99 | 7.5 | |
| Conservative | Riyen Hitesh Karia | 87 | 6.6 | |
| Turnout | 1,335 | 17% | ||
Sherwood edit
| Party | Candidate | Votes | % | |
|---|---|---|---|---|
| Labour | Lauren O'Grady | 2,773 | 65.1 | |
| Labour | Adele Williams | 2,715 | 63.8 | |
| Labour | AJ Matsiko | 2,634 | 61.9 | |
| Conservative | Jackie Jenkin-Jones | 599 | 14.1 | |
| Conservative | David Barnaby John Hughes | 556 | 13.1 | |
| Liberal Democrats | Lorenzo Mark Salzano | 529 | 12.4 | |
| Liberal Democrats | John Henry Burr | 490 | 11.5 | |
| Conservative | Marjorie Anne Wroughton | 481 | 11.3 | |
| Liberal Democrats | Maximilian Paul Zambo | 406 | 9.5 | |
| UKIP | Irenea Marriott | 372 | 8.7 | |
| UKIP | Andrew William Taylor | 365 | 8.6 | |
| UKIP | Fran Loi | 357 | 8.4 | |
| Turnout | 4,287 | 38% | ||
St Ann's edit
| Party | Candidate | Votes | % | |
|---|---|---|---|---|
| Labour | Sue Johnson | 1,990 | 71.8 | |
| Labour | Chantal Marie Lee | 1,900 | 68.5 | |
| Labour | Dave Liversidge | 1,838 | 66.3 | |
| Independent | Cynthia May James | 434 | 15.7 | |
| Conservative | Luke Fintan Dorian | 335 | 12.1 | |
| Conservative | Georgia-Mae Louise Chung | 329 | 11.9 | |
| Liberal Democrats | James Housley | 322 | 11.6 | |
| Conservative | Melvyn Alfred Shepherd | 252 | 9.1 | |
| Turnout | 2,812 | 24% | ||
Wollaton West edit
| Party | Candidate | Votes | % | |
|---|---|---|---|---|
| Labour | Steve Battlemuch | 2,901 | 53.5 | |
| Labour | Cate Woodward | 2,579 | 47.6 | |
| Labour | Zafran Nawaz Khan | 2,283 | 42.1 | |
| Conservative | Jim Armstrong | 1,911 | 35.3 | |
| Conservative | Carl James Husted* | 1,641 | 30.3 | |
| Conservative | Marcus Thomas Jones | 1,427 | 26.3 | |
| Green | David John Rhodes | 765 | 14.1 | |
| Liberal Democrats | Michael Ian Thomas | 687 | 12.7 | |
| Liberal Democrats | Bill Smith | 476 | 8.8 | |
| Liberal Democrats | Niall Garratt | 446 | 8.2 | |
| Turnout | 5,460 | 49% | ||
- Carl James Husted (suspended by the Conservative Party after comparing people who voted for Remain in the 2016 United Kingdom European Union membership referendum to those who voted for the Nazi Party)[3][4]
By-elections edit
St. Ann's edit
| Party | Candidate | Votes | % | ±% | |
|---|---|---|---|---|---|
| Labour | Corall Jenkins | 1,048 | 65.5 | +0.9 | |
| Nottingham Ind. | Francesco Lari | 204 | 12.7 | N/A | |
| Conservative | Ngoc Tran | 193 | 12.1 | +1.2 | |
| Green | Barbara Coulson | 92 | 5.7 | N/A | |
| Liberal Democrats | James Housley | 40 | 2.5 | -8.0 | |
| TUSC | Florence Chadwick | 24 | 1.5 | N/A | |
| Majority | 844 | 52.8 | |||
| Turnout | 1,601 | 14.2 | |||
| Labour hold | Swing | ||||
Sherwood edit
| Party | Candidate | Votes | % | ±% | |
|---|---|---|---|---|---|
| Labour | Nayab Patel | 1,174 | 47.8 | -17.1 | |
| Nottingham Ind. | Colin Barratt | 629 | 25.6 | N/A | |
| Conservative | Stephen Pryor | 320 | 13.0 | -1.0 | |
| Green | Catriona Sibert | 195 | 7.9 | N/A | |
| TUSC | Geraint Thomas | 76 | 3.1 | N/A | |
| Liberal Democrats | Alison Rouse | 63 | 2.6 | -9.8 | |
| Majority | 545 | 22.2 | |||
| Turnout | 2,457 | 22.3 | |||
| Labour hold | Swing | ||||
References edit
- ^ "RESULTS: Nottingham city council – Labour win – Independents become opposition". West Bridgford Wire. 3 May 2019. Archived from the original on 24 June 2020. Retrieved 25 June 2020.
- ^ "City Council Election – Thursday, 2nd May, 2019". Nottingham City Council. 3 May 2019. Retrieved 25 June 2020.
- ^ Sandeman, Kit (4 April 2019). "Tory election candidate compared remainers to those who voted for the Nazis". Nottingham Post. Reach plc. Archived from the original on 24 June 2020. Retrieved 25 June 2020.
- ^ "Tory candidate suspended after comparing Remainers to Nazi voters". The Independent. 5 April 2019. Archived from the original on 24 June 2020. Retrieved 25 June 2020.