


Summary
The 2020 United States presidential election in California was held on Tuesday, November 3, 2020, as part of the 2020 United States presidential election in which all 50 states plus the District of Columbia participated.[2] California voters chose electors to represent them in the Electoral College via a popular vote, pitting the Republican Party's nominee, incumbent President Donald Trump, and running mate Vice President Mike Pence against Democratic Party nominee, former Vice President Joe Biden, and his running mate Kamala Harris, the junior senator from California. California had, in the 2020 election 55 electoral votes in the Electoral College, the most of any state. California was one of six states where Trump received more percentage of the two-party vote than he did in 2016.[a] This election also marked the first time since 2004 that the Republican candidate won more than one million votes in Los Angeles County, due to increased turnout statewide.
| ||||||||||||||||||||||||||
| Turnout | 80.67% (of registered voters) 70.88% (of eligible voters) | |||||||||||||||||||||||||
|---|---|---|---|---|---|---|---|---|---|---|---|---|---|---|---|---|---|---|---|---|---|---|---|---|---|---|
| ||||||||||||||||||||||||||


| ||||||||||||||||||||||||||
| ||||||||||||||||||||||||||

California is considered a safe blue state in presidential elections, due to significant concentrations of Democratic voters in large urban regions such as the San Francisco Bay Area, Sacramento, Los Angeles, and San Diego. As predicted, Biden easily carried California on election day, earning 63.5% of the vote and a margin of 29.2% over Trump. Biden earned the highest percentage of the vote in the state for any candidate since Franklin D. Roosevelt in 1936, although Biden's margin of victory was slightly smaller than Hillary Clinton's 30.1% in 2016, making it one of just six states in which Trump improved on his 2016 margin. Biden became the first candidate in any race for any office in U.S. history to win more than 10 million votes in a single state, while Trump also received the most votes a Republican has ever received in any state in any race since the country's founding, even narrowly besting his vote total in Texas, a state that he won.[3] Biden's vote margin was the largest vote margin for a presidential candidate in a singular state.
Per exit polls by Edison Research, Biden dominated key Democratic constituencies in the state including Latinos with 75%, African Americans with 82%, Asian Americans with 76%, and union households with 63%.[4] Post-election analysis by Cook Political Report showed Trump made inroads with some Asian American constituencies, particularly Vietnamese American and Filipino American voters.[5]
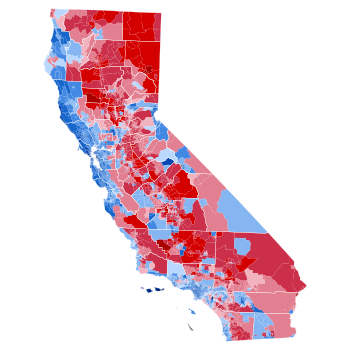
Biden flipped Butte County and Inyo County into the Democratic column, which had not voted Democratic since 2008 and 1964, respectively. Biden's victory in Orange County was only the second time a Democrat carried the county since 1936, as well as only the fourth time in the county's history. In contrast, while he improved his total vote share by nearly three percentage points, Trump did not flip any counties and his main regions of strength came from Republican strongholds in Gold Country, Shasta Cascade, and parts of the Central Valley. California Secretary of State Alex Padilla certified the results on December 4, and took Harris's seat in the Senate upon her resignation to become Vice President, having been appointed by Governor Gavin Newsom.[6]
California was one of five states in the nation in which Biden's victory margin was larger than 1 million raw votes, the others being New York, Maryland, Massachusetts and Illinois. Over 5 million votes of Biden's 7 million vote lead nationwide were Californian votes.
Primary elections edit
In a departure from previous election cycles, California held its primaries on Super Tuesday, March 3, 2020.[7] Early voting began several weeks earlier.
Donald Trump secured the Republican nomination on March 17, 2020, defeating several longshot candidates, most notably former Massachusetts Governor Bill Weld. Kamala Harris, the state's junior U.S. senator, was among the Democratic candidates declared until she dropped out on December 3, 2019. Representative Eric Swalwell from the 15th district was also a Democratic candidate but dropped out of the race on July 8, 2019. Other prominent state figures, including former Governor Jerry Brown, current Governor Gavin Newsom, and Los Angeles Mayor Eric Garcetti declined to run.[8][9][10]
Republican primary edit
The Republican Party's primary campaign was dominated by a lawsuit over the President's taxes.[11] The suit alleges that the new requirement for several years of a candidate's taxes was unconstitutional and onerous. The law was blocked in September 2019 while State Supreme court heard testimony and made a ruling.[12]
As a contingency, the Republican state committee changed its delegate selection process, turning the primary into a mere "beauty contest" and setting up an emergency state convention to Trump's delegate choices.[13] If Trump were allowed on the ballot, the convention would be canceled and the so-called "winner-take-most" rules, which require a challenger to get 20% of the vote, would apply.
Incumbent Trump was allowed on the ballot, and the contingency convention was canceled.
| Candidate | Votes | % | Estimated delegates |
|---|---|---|---|
| Donald Trump | 2,279,120 | 92.2% | 172 |
| Bill Weld | 66,904 | 2.7% | 0 |
| Joe Walsh (withdrawn) | 64,749 | 2.6% | 0 |
| Rocky De La Fuente | 24,351 | 1.0% | 0 |
| Matthew John Matern | 15,469 | 0.6% | 0 |
| Robert Ardini | 12,857 | 0.5% | 0 |
| Zoltan Istvan | 8,141 | 0.3% | 0 |
| Total | 2,471,591 | 100% |
Democratic primary edit
Candidates began filing their paperwork on November 4, 2019, and the final list was announced on December 9.
Leading California Democrats complained that Joe Biden and Senator Elizabeth Warren were snubbing the state by refusing to attend a forum at the State's "endorsement convention".[15] Early voting began on February 11 and ended the day before primary day.

| 2020 California Democratic presidential primary[16] | |||
|---|---|---|---|
| Candidate | Votes | % | Delegates[17] |
| Bernie Sanders | 2,080,846 | 35.97 | 225 |
| Joe Biden | 1,613,854 | 27.90 | 172 |
| Elizabeth Warren | 762,555 | 13.18 | 11 |
| Michael Bloomberg | 701,803 | 12.13 | 7 |
| Pete Buttigieg (withdrawn)[b] | 249,256 | 4.31 | |
| Amy Klobuchar (withdrawn)[b] | 126,961 | 2.19 | |
| Tom Steyer (withdrawn)[b] | 113,092 | 1.96 | |
| Andrew Yang (withdrawn)[c] | 43,571 | 0.75 | |
| Tulsi Gabbard | 33,769 | 0.58 | |
| Julian Castro (withdrawn) | 13,892 | 0.24 | |
| Michael Bennet (withdrawn)[c] | 7,377 | 0.13 | |
| Marianne Williamson (withdrawn) | 7,052 | 0.12 | |
| Cory Booker (withdrawn) | 6,000 | 0.10 | |
| John Delaney (withdrawn) | 4,606 | 0.08 | |
| Joe Sestak (withdrawn) | 3,270 | 0.06 | |
| Deval Patrick (withdrawn)[c] | 2,022 | 0.03 | |
| Other candidates / Write-in | [d]14,438 | 0.25 | |
| Total | 5,784,364 | 100% | 415 |


| District | Bernie Sanders | Joe Biden | Michael Bloomberg | Elizabeth Warren | Total delegates | District region | Largest city | ||||
|---|---|---|---|---|---|---|---|---|---|---|---|
| 1st | 34% | 2 | 23.7% | 2 | 10.3% | 0 | 12.9% | 0 | 4 | Shasta Cascade | Chico, Redding |
| 2nd | 33.3% | 3 | 25.3% | 2 | 13.5% | 0 | 15.9% | 1 | 6 | North Coast | Eureka |
| 3rd | 34.3% | 3 | 29.3% | 2 | 12% | 0 | 12% | 0 | 5 | Sacramento Valley | Fairfield |
| 4th | 26.1% | 2 | 29.6% | 3 | 14.7% | 0 | 11.4% | 0 | 5 | Sierras | Roseville |
| 5th | 32.7% | 3 | 27.2% | 3 | 14.9% | 0 | 12.6% | 0 | 6 | Wine Country | Santa Rosa |
| 6th | 35.8% | 3 | 28.1% | 2 | 10.7% | 0 | 14.3% | 0 | 5 | Sacramento Valley | Sacramento |
| 7th | 30.9% | 2 | 31.4% | 3 | 13% | 0 | 11.2% | 0 | 5 | Sacramento Valley | Elk Grove |
| 8th | 35.7% | 2 | 31.2% | 2 | 11.8% | 0 | 8.8% | 0 | 4 | Eastern Desert | Victorville |
| 9th | 32.9% | 2 | 32.5% | 2 | 15.9% | 1 | 7% | 0 | 5 | San Joaquin Valley | Stockton |
| 10th | 35.5% | 2 | 29.1% | 1 | 15.3% | 1 | 7.2% | 0 | 4 | San Joaquin Valley | Modesto |
| 11th | 29% | 2 | 30.7% | 3 | 15.3% | 1 | 14.7% | 0 | 6 | Bay Area | Concord |
| 12th | 33.8% | 3 | 23.9% | 2 | 11% | 0 | 23.4% | 2 | 7 | San Francisco Bay Area | San Francisco |
| 13th | 38.7% | 3 | 22.4% | 2 | 8.1% | 0 | 24.7% | 2 | 7 | Bay Area | Oakland |
| 14th | 31.9% | 3 | 26.4% | 2 | 15.6% | 1 | 14.8% | 0 | 6 | Bay Area | Daly City |
| 15th | 34.1% | 3 | 29.5% | 3 | 14.4% | 0 | 11.5% | 0 | 6 | Bay Area | Hayward |
| 16th | 40.9% | 3 | 26.2% | 1 | 12.6% | 0 | 7.2% | 0 | 4 | San Joaquin Valley | Fresno, Merced |
| 17th | 36.1% | 3 | 25.9% | 2 | 14.3% | 0 | 12.5% | 0 | 5 | Bay Area | Fremont, Santa Clara |
| 18th | 26.6% | 2 | 29% | 2 | 15.4% | 1 | 17.1% | 1 | 6 | Bay Area | Sunnyvale |
| 19th | 38.9% | 4 | 25.9% | 2 | 13.6% | 0 | 10.7% | 0 | 6 | Bay Area | San Jose |
| 20th | 39.8% | 3 | 25.5% | 2 | 10.9% | 0 | 13% | 0 | 5 | Central Coast | Salinas |
| 21st | 43.2% | 3 | 25.3% | 1 | 13.7% | 0 | 5.1% | 0 | 4 | San Joaquin Valley | Kings, Kern, SW Fresno |
| 22nd | 34.4% | 2 | 29.1% | 2 | 13% | 0 | 8.8% | 0 | 4 | San Joaquin Valley | Visalia |
| 23rd | 34.9% | 2 | 30.2% | 2 | 12.2% | 0 | 9% | 0 | 4 | South Central California | Bakersfield |
| 24th | 35.3% | 3 | 26.8% | 2 | 10.5% | 0 | 14.7% | 0 | 5 | Central Coast | Santa Maria |
| 25th | 35.6% | 3 | 33.6% | 2 | 10% | 0 | 10% | 0 | 5 | LA County | Santa Clarita |
| 26th | 34.4% | 3 | 31.1% | 2 | 12.1% | 0 | 11.5% | 0 | 5 | Central Coast | Oxnard |
| 27th | 35.9% | 2 | 29.2% | 2 | 10.2% | 0 | 15.7% | 1 | 5 | LA County | San Gabriel Valley |
| 28th | 40% | 3 | 22.7% | 2 | 7.5% | 0 | 21.7% | 1 | 6 | LA County | Glendale |
| 29th | 49.8% | 3 | 21.5% | 2 | 7.7% | 0 | 11.2% | 0 | 5 | LA County | San Fernando Valley |
| 30th | 32.6% | 3 | 31.2% | 2 | 11.2% | 0 | 15.4% | 1 | 6 | LA County | San Fernando Valley |
| 31st | 39.1% | 3 | 32.3% | 2 | 11% | 0 | 8.3% | 0 | 5 | Southern California | San Bernardino |
| 32nd | 44.7% | 3 | 28.2% | 2 | 10.5% | 0 | 7.5% | 0 | 5 | LA County | El Monte |
| 33rd | 26.2% | 2 | 34.2% | 3 | 14.3% | 0 | 16.1% | 1 | 6 | LA County | Santa Monica, Coastal LA |
| 34th | 53.7% | 4 | 16.8% | 1 | 8.1% | 0 | 14.7% | 0 | 5 | LA County | Downtown Los Angeles |
| 35th | 46.6% | 2 | 28.2% | 2 | 10.9% | 0 | 6.2% | 0 | 4 | Southern California | Fontana |
| 36th | 27.5% | 1 | 29.8% | 2 | 15.4% | 1 | 8.1% | 0 | 4 | Eastern Desert | Indio |
| 37th | 35.6% | 3 | 31.3% | 2 | 10.1% | 0 | 16.2% | 1 | 6 | LA County | West LA |
| 38th | 41.7% | 3 | 30.8% | 2 | 10.5% | 0 | 7.6% | 0 | 5 | LA County | Norwalk |
| 39th | 36.7% | 3 | 30.5% | 2 | 12.6% | 0 | 9.6% | 0 | 5 | Southern California | Fullerton |
| 40th | 56.4% | 4 | 20.9% | 1 | 8.9% | 0 | 5.4% | 0 | 5 | LA County | East Los Angeles |
| 41st | 45% | 3 | 27.9% | 2 | 10.7% | 0 | 7.5% | 0 | 5 | Southern California | Riverside |
| 42nd | 37% | 3 | 31.6% | 2 | 12.4% | 0 | 7.9% | 0 | 5 | Southern California | Corona |
| 43rd | 36.5% | 3 | 34.3% | 2 | 10% | 0 | 10.3% | 0 | 5 | LA County | Inglewood |
| 44th | 44% | 3 | 29.6% | 2 | 6.2% | 0 | 9.6% | 0 | 5 | Los Angeles County | Compton |
| 45th | 34% | 3 | 29.1% | 2 | 13.5% | 0 | 12% | 0 | 5 | Southern California | Irvine |
| 46th | 53.7% | 2 | 20% | 2 | 10.5% | 0 | 7.7% | 0 | 4 | Southern California | Anaheim |
| 47th | 38.5% | 3 | 27.3% | 2 | 10.6% | 0 | 12.2% | 0 | 5 | Southern California | Long Beach |
| 48th | 30.4% | 2 | 30.3% | 2 | 16.3% | 1 | 11% | 0 | 5 | Southern California | Huntington Beach |
| 49th | 30.6% | 3 | 30.5% | 2 | 14.6% | 0 | 12.2% | 0 | 5 | Southern California | Oceanside |
| 50th | 34.9% | 2 | 27.6% | 2 | 13% | 0 | 11.3% | 0 | 4 | Southern California | Escondido |
| 51st | 49.2% | 3 | 23.7% | 2 | 11.3% | 0 | 6.8% | 0 | 5 | Southern California | Downtown San Diego and Border Communities |
| 52nd | 30.6% | 3 | 30% | 3 | 13.4% | 0 | 14.6% | 0 | 6 | Southern California | North San Diego |
| 53rd | 37.8% | 3 | 27.3% | 3 | 10.1% | 0 | 14.5% | 0 | 6 | Southern California | Eastern San Diego and suburbs |
| Total | 36.0% | 144 | 27.9% | 109 | 12.1% | 7 | 13.2% | 11 | 271 | ||
| Delegate type | Bernie Sanders | Joe Biden | Michael Bloomberg | Elizabeth Warren |
|---|---|---|---|---|
| At-large | 51 | 39 | 0 | 0 |
| PLEO | 30 | 24 | 0 | 0 |
| District-level | 144 | 109 | 7 | 11 |
| Total | 225 | 172 | 7 | 11 |
Libertarian primary edit
| |||||||||||||||||||||||||||||||||||||||||||||||||||||||||||||||||||||
| |||||||||||||||||||||||||||||||||||||||||||||||||||||||||||||||||||||
 Election results by county
| |||||||||||||||||||||||||||||||||||||||||||||||||||||||||||||||||||||


The Libertarian Party of California permitted non-affiliated voters to vote in their presidential primary.[20]
| 2020 California Libertarian presidential primary[21] | |||
|---|---|---|---|
| Candidate | Votes | % | |
| Jacob Hornberger | 5,530 | 19.4 | |
| Jo Jorgensen | 3,534 | 12.4 | |
| Vermin Supreme | 3,469 | 12.2 | |
| Ken Armstrong | 3,011 | 10.6 | |
| Kim Ruff (withdrawn) | 2,330 | 8.2 | |
| Adam Kokesh | 2,161 | 7.6 | |
| Sam Robb | 1,722 | 6.0 | |
| Dan Behrman | 1,695 | 5.9 | |
| Max Abramson | 1,605 | 5.6 | |
| Souraya Faas | 999 | 3.5 | |
| Steven A. Richey | 982 | 3.4 | |
| Erik Gerhardt | 748 | 2.6 | |
| Keenan Dunham | 720 | 2.5 | |
| Sorinne Ardeleanu (write-in) | 27 | 0.1 | |
| Geby Eva Espinosa (write-in) | 2 | 0.0 | |
| Total | 28,535 | 100.0 | |
Green primary edit
| 2020 California Green primary[22] | |||
|---|---|---|---|
| Candidate | Votes | Percentage | National delegates |
| Howie Hawkins | 4,202 | 36.2% | 16 estimated |
| Dario Hunter | 2,558 | 22.0% | 9 estimated |
| Sedinam Moyowasifza-Curry | 2,071 | 17.8% | 8 estimated |
| Dennis Lambert | 1,999 | 17.2% | 7 estimated |
| David Rolde | 774 | 6.7% | 3 estimated |
| Total | 9,656 | 100.00% | 43 |
American Independent primary edit
The American Independent Party permitted non-affiliated voters to vote in their presidential primary.[20]
| Party | Candidate | Votes | % | |
|---|---|---|---|---|
| American Independent | Phil Collins | 11,532 | 32.8 | |
| American Independent | Roque "Rocky" De La Fuente | 7,263 | 21.0 | |
| American Independent | Don Blankenship | 6,913 | 19.7 | |
| American Independent | J. R. Myers | 5,099 | 14.5 | |
| American Independent | Charles Kraut | 4,216 | 12.0 | |
| Total votes | 35,723 | 100% | ||
Peace and Freedom primary edit
| Party | Candidate | Votes | % | |
|---|---|---|---|---|
| Peace and Freedom | Gloria La Riva | 2,570 | 66.0 | |
| Peace and Freedom | Howie Hawkins | 1,325 | 34.0 | |
| Total votes | 3,895 | 100% | ||
General election edit
Final predictions edit
| Source | Ranking |
|---|---|
| The Cook Political Report[25] | Solid D |
| Inside Elections[26] | Solid D |
| Sabato's Crystal Ball[27] | Safe D |
| Politico[28] | Solid D |
| RCP[29] | Solid D |
| Niskanen[30] | Safe D |
| CNN[31] | Solid D |
| The Economist[32] | Safe D |
| CBS News[33] | Likely D |
| 270towin[34] | Safe D |
| ABC News[35] | Solid D |
| NPR[36] | Likely D |
| NBC News[37] | Solid D |
| 538[38] | Solid D |
Polling edit
- Graphical summary
Aggregate polls edit
| Source of poll aggregation |
Dates administered |
Dates updated |
Joe Biden Democratic |
Donald Trump Republican |
Other/ Undecided [e] |
Margin |
|---|---|---|---|---|---|---|
| 270 to Win | October 17–27, 2020 | November 3, 2020 | 61.7% | 32.3% | 6.0% | Biden +29.4 |
| Real Clear Politics | September 26 – October 21, 2020 | October 27, 2020 | 60.7% | 31.0% | 8.3% | Biden +29.7 |
| FiveThirtyEight | until November 2, 2020 | November 3, 2020 | 61.6% | 32.4% | 6.0% | Biden +29.2 |
| Average | 61.3% | 31.9% | 6.8% | Biden +29.4 | ||
Polls edit
| Poll source | Date(s) administered |
Sample size[f] |
Margin of error |
Donald Trump Republican |
Joe Biden Democratic |
Jo Jorgensen Libertarian |
Howie Hawkins Green |
Other | Undecided |
|---|---|---|---|---|---|---|---|---|---|
| SurveyMonkey/Axios | Oct 20 – Nov 2, 2020 | 12,370 (LV) | ± 1.5% | 36%[g] | 62% | – | – | – | – |
| David Binder Research | Oct 28 – Nov 1, 2020 | 800 (LV) | – | 31% | 62% | – | – | 3% | 4% |
| USC Schwarzenegger Institute | Oct 27–31, 2020 | 1,155 (RV) | ± 3% | 28% | 65% | – | – | 4%[h] | 2% |
| SurveyMonkey/Tableau | Sep 30 – Oct 28, 2020 | 22,450 (LV) | – | 37%[g] | 61% | – | – | – | – |
| Swayable | Oct 23–26, 2020 | 635 (LV) | ± 5.2% | 35% | 62% | 2% | 1% | – | – |
| UC Berkeley/LA Times [1] | Oct 16–21, 2020 | 5,352 (LV) | ± 2% | 29% | 65% | 1% | 0% | 0%[i][j] | 3% |
| Public Policy Institute of California | Oct 9–18, 2020 | 1,185 (LV) | ± 4.3% | 32% | 58% | 3% | 2% | 1%[k] | 4% |
| SurveyMonkey/Tableau | Sep 1–30, 2020 | 20,346 (LV) | – | 35% | 63% | – | – | – | 2% |
| SurveyUSA | Sep 26–28, 2020 | 588 (LV) | ± 5.4% | 34% | 59% | – | – | 3%[l] | 6% |
| Redfield & Wilton Strategies | Sep 19–21, 2020 | 1,775 (LV) | – | 28% | 62% | 1% | 1% | 1%[m] | 8% |
| UC Berkeley/LA Times [2] | Sep 9–15, 2020 | 5,942 (LV) | ± 2% | 28% | 67% | 1% | 0% | 0%[i][j] | 3% |
| Public Policy Institute of California | Sep 4–13, 2020 | 1,168 (LV) | ± 4.3% | 31% | 60% | 3% | 2% | 1%[k] | 2% |
| Spry Strategies/Women's Liberation Front Archived September 27, 2020, at the Wayback Machine [n] | Aug 29 – Sep 1, 2020 | 600 (LV) | ± 4% | 39% | 56% | – | – | – | 5% |
| SurveyMonkey/Tableau | Aug 1–31, 2020 | 17,537 (LV) | – | 35% | 63% | – | – | – | 2% |
| David Binder Research | Aug 22–24, 2020 | 800 (LV) | – | 31% | 61% | – | – | 3%[o] | 5% |
| Redfield and Wilton Strategies | Aug 9, 2020 | 1,904 (LV) | ± 2.3% | 25% | 61% | 1% | 1% | 2%[p] | 9% |
| SurveyMonkey/Tableau | Jul 1–31, 2020 | 19,027 (LV) | – | 35% | 63% | – | – | – | 2% |
| University of California Berkeley [3] | Jul 21–27, 2020 | 6,756 (LV) | ± 2.0% | 28% | 67% | – | – | – | 5% |
| SurveyMonkey/Tableau | Jun 8–30, 2020 | 8,412 (LV) | – | 36% | 62% | – | – | – | 2% |
| Public Policy Institute of California | May 19–26, 2020 | 1,048 (LV) | ± 4.6% | 33% | 57% | – | – | 6%[q] | 3% |
| SurveyUSA | May 18–19, 2020 | 537 (LV) | ± 5.4% | 30% | 58% | – | – | 5% | 7% |
| Emerson College | May 8–10, 2020 | 800 (RV) | ± 3.4% | 35%[r] | 65% | – | – | – | – |
| Public Policy Polling | Mar 28–29, 2020 | 962 (RV) | – | 29% | 67% | – | – | – | 3% |
| AtlasIntel | Feb 24 – Mar 2, 2020 | 1,100 (RV) | ± 3.0% | 26% | 62% | – | – | 12% | – |
| YouGov | Feb 26–28, 2020 | 1,507 (RV) | – | 31% | 59% | – | – | 4% | 4% |
| CNN/SSRS | Feb 22–26, 2020 | 951 (RV) | ± 3.3% | 35% | 60% | – | – | 3%[s] | 3% |
| University of California Berkeley | Feb 20–25, 2020 | 5,526 (RV) | – | 31% | 58% | – | – | – | 11% |
| SurveyUSA | Feb 13–16, 2020 | 1,196 (RV) | ± 3.1% | 37% | 57% | – | – | – | 6% |
| YouGov/USC Price-Schwarzenegger Institute | Feb 1–15, 2020 | 1,200 (RV) | ± 3.1% | 30% | 60% | – | – | – | 4% |
| SurveyUSA | Jan 14–16, 2020 | 1,967 (RV) | ± 2.8% | 35% | 59% | – | – | – | 6% |
| CNN/SSRS | Dec 4–8, 2019 | 1,011 (RV) | ± 3.4% | 36% | 56% | – | – | 3%[s] | 5% |
| SurveyUSA | Nov 20–22, 2019 | 2,039 (RV) | ± 2.4% | 32% | 59% | – | – | – | 9% |
| SurveyUSA | Oct 15–16, 2019 | 1,242 (RV) | ± 3.8% | 32% | 59% | – | – | – | 9% |
| Emerson College | Sep 13–16, 2019 | 830 (RV) | ± 3.3% | 36% | 64% | – | – | – | – |
| SurveyUSA | Sep 13–15, 2019 | 1,785 (RV) | ± 3.2% | 31% | 57% | – | – | – | 11% |
| SurveyUSA | Aug 1–5, 2019 | 2,184 (RV) | ± 2.7% | 27% | 61% | – | – | – | 12% |
| SurveyUSA | Mar 22–25, 2018 | 882 (RV) | ± 3.8% | 33% | 56% | – | – | – | 11% |
with Donald Trump and Bernie Sanders
| Poll source | Date(s) administered |
Sample size[f] |
Margin of error |
Donald Trump (R) |
Bernie Sanders (D) |
Other | Undecided |
|---|---|---|---|---|---|---|---|
| AtlasIntel | Feb 24 – Mar 2, 2020 | 1,100 (RV) | ± 3.0% | 28% | 60% | 12% | – |
| YouGov | Feb 26–28, 2020 | 1,507 (RV) | – | 31% | 59% | 6%[t] | 4% |
| CNN/SSRS | Feb 22–26, 2020 | 951 (RV) | ± 3.3% | 36% | 59% | 3%[s] | 2% |
| University of California Berkeley | Feb 20–25, 2020 | 5,526 (RV) | – | 31% | 59% | – | 10% |
| SurveyUSA | Feb 13–16, 2020 | 1,196 (RV) | ± 3.1% | 37% | 58% | – | 6% |
| YouGov/USC Price-Schwarzenegger Institute | Feb 1–15, 2020 | 1,200 (RV) | ± 3.1% | 31% | 61% | – | 4% |
| SurveyUSA | Jan 14–16, 2020 | 1,967 (RV) | ± 2.7% | 36% | 59% | – | 5% |
| CNN/SSRS | Dec 4–8, 2019 | 1,011 (RV) | ± 3.4% | 38% | 54% | 4%[u] | 4% |
| SurveyUSA | Nov 20–22, 2019 | 2,039 (RV) | ± 2.4% | 34% | 60% | – | 7% |
| SurveyUSA | Oct 15–16, 2019 | 1,242 (RV) | ± 3.8% | 33% | 59% | – | 8% |
| Emerson College | Sep 13–16, 2019 | 830 (RV) | ± 3.3% | 38% | 63% | – | – |
| SurveyUSA | Sep 13–15, 2019 | 1,785 (RV) | ± 3.2% | 33% | 57% | – | 10% |
| SurveyUSA | Aug 1–5, 2019 | 2,184 (RV) | ± 2.7% | 29% | 62% | – | 9% |
with Donald Trump and Tulsi Gabbard
| Poll source | Date(s) administered |
Sample size[f] |
Margin of error |
Donald Trump (R) |
Tulsi Gabbard (D) |
Undecided |
|---|---|---|---|---|---|---|
| SurveyUSA | Jan 14–16, 2020 | 1,967 (RV) | ± 2.8% | 38% | 43% | 19% |
with Donald Trump and Elizabeth Warren
| Poll source | Date(s) administered |
Sample size[f] |
Margin of error |
Donald Trump (R) |
Elizabeth Warren (D) |
Other | Undecided |
|---|---|---|---|---|---|---|---|
| AtlasIntel | Feb 24 – Mar 2, 2020 | 1,100 (RV) | ± 3.0% | 28% | 60% | 12% | – |
| YouGov | Feb 26–28, 2020 | 1,507 (RV) | – | 32% | 57% | 5%[v] | 6% |
| CNN/SSRS | Feb 22–26, 2020 | 951 (RV) | ± 3.3% | 37% | 56% | 3%[s] | 4% |
| University of California Berkeley | Feb 20–25, 2020 | 5,526 (RV) | – | 33% | 58% | – | 10% |
| SurveyUSA | Feb 13–16, 2020 | 1,196 (RV) | ± 3.1% | 38% | 54% | – | 8% |
| YouGov/USC Price-Schwarzenegger Institute | Feb 1–15, 2020 | 1,200 (RV) | ± 3.1% | 32% | 59% | – | 4% |
| SurveyUSA | Jan 14–16, 2020 | 1,967 (RV) | ± 2.8% | 39% | 55% | – | 7% |
| CNN/SSRS | Dec 4–8, 2019 | 1,011 (RV) | ± 3.4% | 37% | 53% | 4%[u] | 6% |
| SurveyUSA | Nov 20–22, 2019 | 2,039 (RV) | ± 2.4% | 35% | 56% | – | 9% |
| SurveyUSA | Oct 15–16, 2019 | 1,242 (RV) | ± 3.9% | 33% | 55% | – | 12% |
| SurveyUSA | Oct 15–16, 2019 | 1,242 (RV) | ± 3.8% | 35% | 56% | – | 8% |
| Emerson College | Sep 13–16, 2019 | 830 (RV) | ± 3.3% | 39% | 61% | – | – |
| SurveyUSA | Sep 13–15, 2019 | 1,785 (RV) | ± 3.2% | 35% | 53% | – | 12% |
| SurveyUSA | Aug 1–5, 2019 | 2,184 (RV) | ± 2.7% | 30% | 58% | – | 12% |
| SurveyUSA | Jan 7–9, 2018 | 909 (RV) | ± 3.3% | 32% | 53% | – | 14% |
with Donald Trump and Michael Bloomberg
| Poll source | Date(s) administered |
Sample size[f] |
Margin of error |
Donald Trump (R) |
Michael Bloomberg (D) |
Other | Undecided |
|---|---|---|---|---|---|---|---|
| AtlasIntel | Feb 24 – Mar 2, 2020 | 1,100 (RV) | ± 3.0% | 25% | 51% | 24% | – |
| YouGov | Feb 26–28, 2020 | 1,507 (RV) | – | 32% | 51% | 10%[w] | 7% |
| CNN/SSRS | Feb 22–26, 2020 | 951 (RV) | ± 3.3% | 35% | 55% | 4%[x] | 5% |
| University of California Berkeley | Feb 20–25, 2020 | 5,526 (RV) | – | 30% | 54% | – | 16% |
| SurveyUSA | Feb 13–16, 2020 | 1,196 (RV) | ± 3.1% | 34% | 59% | – | 7% |
| YouGov/USC Price-Schwarzenegger Institute | Feb 1–15, 2020 | 1,200 (RV) | ± 3.1% | 31% | 57% | – | 6% |
| SurveyUSA | Jan 14–16, 2020 | 1,967 (RV) | ± 2.8% | 36% | 56% | – | 8% |
| SurveyUSA | Nov 20–22, 2019 | 2,039 (RV) | ± 2.4% | 34% | 50% | – | 16% |
with Donald Trump and Amy Klobuchar
| Poll source | Date(s) administered |
Sample size[f] |
Margin of error |
Donald Trump (R) |
Amy Klobuchar (D) |
Other | Undecided |
|---|---|---|---|---|---|---|---|
| YouGov | Feb 26–28, 2020 | 1,507 (RV) | – | 31% | 59% | 7%[y] | 7% |
| CNN/SSRS | Feb 22–26, 2020 | 951 (RV) | ± 3.3% | 35% | 55% | 4%[x] | 6% |
| University of California Berkeley | Feb 20–25, 2020 | 5,526 (RV) | – | 30% | 57% | – | 13% |
| SurveyUSA | Feb 13–16, 2020 | 1,196 (RV) | ± 3.1% | 37% | 52% | – | 11% |
| SurveyUSA | Jan 14–16, 2020 | 1,967 (RV) | ± 2.8% | 38% | 50% | – | 11% |
with Donald Trump and Pete Buttigieg
| Poll source | Date(s) administered |
Sample size[f] |
Margin of error |
Donald Trump (R) |
Pete Buttigieg (D) |
Other | Undecided |
|---|---|---|---|---|---|---|---|
| YouGov | Feb 26–28, 2020 | 1,507 (RV) | – | 33% | 54% | 8%[z] | 6% |
| CNN/SSRS | Feb 22–26, 2020 | 951 (RV) | ± 3.3% | 35% | 56% | 4%[x] | 4% |
| University of California Berkeley | Feb 20–25, 2020 | 5,526 (RV) | – | 30% | 58% | – | 12% |
| SurveyUSA | Feb 13–16, 2020 | 1,196 (RV) | ± 3.1% | 36% | 56% | – | 8% |
| YouGov/USC Price-Schwarzenegger Institute | Feb 1–15, 2020 | 1,200 (RV) | ± 3.1% | 31% | 57% | – | 6% |
| SurveyUSA | Jan 14–16, 2020 | 1,967 (RV) | ± 2.8% | 37% | 53% | – | 10% |
| CNN/SSRS | Dec 4–8, 2019 | 1,011 (RV) | ± 3.4% | 36% | 53% | 4%[u] | 7% |
| SurveyUSA | Nov 20–22, 2019 | 2,039 (RV) | ± 2.4% | 34% | 52% | – | 14% |
| SurveyUSA | Oct 15–16, 2019 | 1,242 (RV) | ± 3.9% | 32% | 54% | – | 13% |
| SurveyUSA | Aug 1–5, 2019 | 2,184 (RV) | ± 2.8% | 30% | 53% | – | 17% |
with Donald Trump and Tom Steyer
| Poll source | Date(s) administered |
Sample size[f] |
Margin of error |
Donald Trump (R) |
Tom Steyer (D) |
Undecided |
|---|---|---|---|---|---|---|
| SurveyUSA | Feb 13–16, 2020 | 1,196 (RV) | ± 3.1% | 38% | 54% | 9% |
| SurveyUSA | Jan 14–16, 2020 | 1,967 (RV) | ± 2.8% | 37% | 53% | 10% |
with Donald Trump and Deval Patrick
| Poll source | Date(s) administered |
Sample size[f] |
Margin of error |
Donald Trump (R) |
Deval Patrick (D) |
Undecided |
|---|---|---|---|---|---|---|
| SurveyUSA | Mar 22–25, 2018 | 882 (RV) | ± 3.8% | 34% | 34% | 32% |
with Donald Trump and Andrew Yang
| Poll source | Date(s) administered |
Sample size[f] |
Margin of error |
Donald Trump (R) |
Andrew Yang (D) |
Undecided |
|---|---|---|---|---|---|---|
| SurveyUSA | Jan 14–16, 2020 | 1,967 (RV) | ± 2.8% | 37% | 53% | 10% |
with Donald Trump and Cory Booker
| Poll source | Date(s) administered |
Sample size[f] |
Margin of error |
Donald Trump (R) |
Cory Booker (D) |
Undecided |
|---|---|---|---|---|---|---|
| SurveyUSA | Mar 22–25, 2018 | 882 (RV) | ± 3.8% | 35% | 39% | 26% |
with Donald Trump and Kamala Harris
| Poll source | Date(s) administered |
Sample size[f] |
Margin of error |
Donald Trump (R) |
Kamala Harris (D) |
Undecided |
|---|---|---|---|---|---|---|
| SurveyUSA | Nov 20–22, 2019 | 2,039 (RV) | ± 2.4% | 35% | 56% | 8% |
| SurveyUSA | Oct 15–16, 2019 | 1,242 (RV) | ± 3.8% | 35% | 57% | 8% |
| Emerson College | Sep 13–16, 2019 | 830 (RV) | ± 3.3% | 39% | 61% | – |
| SurveyUSA | Sep 13–15, 2019 | 1,785 (RV) | ± 3.2% | 35% | 53% | 12% |
| SurveyUSA | Aug 1–5, 2019 | 2,184 (RV) | ± 2.7% | 30% | 59% | 12% |
| SurveyUSA | Mar 22–25, 2018 | 882 (RV) | ± 3.8% | 35% | 54% | 12% |
| SurveyUSA | Jan 7–9, 2018 | 909 (RV) | ± 3.3% | 33% | 53% | 13% |
with Donald Trump and Beto O'Rourke
| Poll source | Date(s) administered |
Sample size[f] |
Margin of error |
Donald Trump (R) |
Beto O'Rourke (D) |
Undecided |
|---|---|---|---|---|---|---|
| SurveyUSA | Sep 13–15, 2019 | 1,785 (RV) | ± 3.2% | 34% | 51% | 15% |
with Donald Trump and Kirsten Gillibrand
| Poll source | Date(s) administered |
Sample size[f] |
Margin of error |
Donald Trump (R) |
Kirsten Gillibrand (D) |
Undecided |
|---|---|---|---|---|---|---|
| SurveyUSA | Mar 22–25, 2018 | 882 (RV) | ± 3.8% | 33% | 47% | 19% |
| SurveyUSA | Jan 7–9, 2018 | 909 (RV) | ± 3.3% | 32% | 46% | 22% |
with Donald Trump and Jerry Brown
| Poll source | Date(s) administered |
Sample size[f] |
Margin of error |
Donald Trump (R) |
Jerry Brown (D) |
Undecided |
|---|---|---|---|---|---|---|
| SurveyUSA | Mar 22–25, 2018 | 882 (RV) | ± 3.8% | 35% | 54% | 11% |
with Donald Trump and Sherrod Brown
| Poll source | Date(s) administered |
Sample size[f] |
Margin of error |
Donald Trump (R) |
Sherrod Brown (D) |
Undecided |
|---|---|---|---|---|---|---|
| SurveyUSA | Mar 22–25, 2018 | 882 (RV) | ± 3.8% | 35% | 36% | 29% |
with Donald Trump and Eric Garcetti
| Poll source | Date(s) administered |
Sample size[f] |
Margin of error |
Donald Trump (R) |
Eric Garcetti (D) |
Undecided |
|---|---|---|---|---|---|---|
| SurveyUSA | Mar 22–25, 2018 | 882 (RV) | ± 3.8% | 34% | 49% | 17% |
| SurveyUSA | Jan 7–9, 2018 | 909 (RV) | ± 3.3% | 32% | 46% | 21% |
with Donald Trump and Tom Hanks
| Poll source | Date(s) administered |
Sample size[f] |
Margin of error |
Donald Trump (R) |
Tom Hanks (D) |
Undecided |
|---|---|---|---|---|---|---|
| SurveyUSA | Mar 22–25, 2018 | 882 (RV) | ± 3.8% | 34% | 51% | 15% |
| SurveyUSA | Jan 7–9, 2018 | 909 (RV) | ± 3.3% | 31% | 56% | 14% |
with Donald Trump and Eric Holder
| Poll source | Date(s) administered |
Sample size[f] |
Margin of error |
Donald Trump (R) |
Eric Holder (D) |
Undecided |
|---|---|---|---|---|---|---|
| SurveyUSA | Mar 22–25, 2018 | 882 (RV) | ± 3.8% | 35% | 38% | 26% |
with Donald Trump and Mitch Landrieu
| Poll source | Date(s) administered |
Sample size[f] |
Margin of error |
Donald Trump (R) |
Mitch Landrieu (D) |
Undecided |
|---|---|---|---|---|---|---|
| SurveyUSA | Mar 22–25, 2018 | 882 (RV) | ± 3.8% | 35% | 36% | 29% |
with Donald Trump and Michelle Obama
| Poll source | Date(s) administered |
Sample size[f] |
Margin of error |
Donald Trump (R) |
Michelle Obama (D) |
Undecided |
|---|---|---|---|---|---|---|
| SurveyUSA | Aug 1–5, 2019 | 2,184 (RV) | ± 2.7% | 28% | 64% | 8% |
| SurveyUSA | Mar 22–25, 2018 | 882 (RV) | ± 3.8% | 36% | 57% | 8% |
with Donald Trump and Oprah Winfrey
| Poll source | Date(s) administered |
Sample size[f] |
Margin of error |
Donald Trump (R) |
Oprah Winfrey (D) |
Undecided |
|---|---|---|---|---|---|---|
| SurveyUSA | Aug 1–5, 2019 | 2,184 (RV) | ± 2.7% | 28% | 57% | 14% |
| SurveyUSA | Mar 22–25, 2018 | 882 (RV) | ± 3.8% | 35% | 52% | 13% |
| SurveyUSA | Jan 7–9, 2018 | 909 (RV) | ± 3.3% | 32% | 56% | 12% |
with Donald Trump and Mark Zuckerberg
| Poll source | Date(s) administered |
Sample size[f] |
Margin of error |
Donald Trump (R) |
Mark Zuckerberg (D) |
Undecided |
|---|---|---|---|---|---|---|
| SurveyUSA | Mar 22–25, 2018 | 882 (RV) | ± 3.8% | 36% | 42% | 22% |
| SurveyUSA | Jan 7–9, 2018 | 909 (RV) | ± 3.3% | 31% | 50% | 19% |
with Mike Pence and Joe Biden
| Poll source | Date(s) administered |
Sample size[f] |
Margin of error |
Mike Pence (R) |
Joe Biden (D) |
Undecided |
|---|---|---|---|---|---|---|
| SurveyUSA | Nov 20–22, 2019 | 2,039 (RV) | ± 2.4% | 29% | 59% | 12% |
| SurveyUSA | Oct 15–16, 2019 | 1,242 (RV) | ± 3.8% | 30% | 58% | 13% |
| SurveyUSA | Sep 13–15, 2019 | 1,785 (RV) | ± 3.2% | 27% | 58% | 15% |
with Mike Pence and Michael Bloomberg
| Poll source | Date(s) administered |
Sample size[f] |
Margin of error |
Mike Pence (R) |
Michael Bloomberg (D) |
Undecided |
|---|---|---|---|---|---|---|
| SurveyUSA | Nov 20–22, 2019 | 2,039 (RV) | ± 2.4% | 32% | 48% | 20% |
with Mike Pence and Pete Buttigieg
| Poll source | Date(s) administered |
Sample size[f] |
Margin of error |
Mike Pence (R) |
Pete Buttigieg (D) |
Undecided |
|---|---|---|---|---|---|---|
| SurveyUSA | Nov 20–22, 2019 | 2,039 (RV) | ± 2.4% | 34% | 48% | 17% |
| SurveyUSA | Oct 15–16, 2019 | 1,242 (RV) | ± 3.9% | 34% | 45% | 21% |
with Mike Pence and Bernie Sanders
| Poll source | Date(s) administered |
Sample size[f] |
Margin of error |
Mike Pence (R) |
Bernie Sanders (D) |
Undecided |
|---|---|---|---|---|---|---|
| SurveyUSA | Nov 20–22, 2019 | 2,039 (RV) | ± 2.4% | 31% | 59% | 9% |
| SurveyUSA | Oct 15–16, 2019 | 1,242 (RV) | ± 3.8% | 31% | 58% | 10% |
| SurveyUSA | Sep 13–15, 2019 | 1,785 (RV) | ± 3.2% | 31% | 57% | 13% |
with Mike Pence and Elizabeth Warren
| Poll source | Date(s) administered |
Sample size[f] |
Margin of error |
Mike Pence (R) |
Elizabeth Warren (D) |
Undecided |
|---|---|---|---|---|---|---|
| SurveyUSA | Nov 20–22, 2019 | 2,039 (RV) | ± 2.4% | 34% | 53% | 13% |
| SurveyUSA | Oct 15–16, 2019 | 1,242 (RV) | ± 3.9% | 33% | 55% | 12% |
| SurveyUSA | Sep 13–15, 2019 | 1,785 | ± 3.2% | 33% | 50% | 16% |
with Nikki Haley and Joe Biden
| Poll source | Date(s) administered |
Sample size[f] |
Margin of error |
Nikki Haley (R) |
Joe Biden (D) |
Undecided |
|---|---|---|---|---|---|---|
| SurveyUSA | Oct 15–16, 2019 | 1,242 (RV) | ± 3.9% | 21% | 56% | 23% |
| SurveyUSA | Sep 13–15, 2019 | 1,785 (RV) | ± 3.2% | 21% | 56% | 24% |
with Nikki Haley and Pete Buttigieg
| Poll source | Date(s) administered |
Sample size[f] |
Margin of error |
Nikki Haley (R) |
Pete Buttigieg (D) |
Undecided |
|---|---|---|---|---|---|---|
| SurveyUSA | Oct 15–16, 2019 | 1,242 (RV) | ± 3.9% | 24% | 44% | 32% |
with Nikki Haley and Bernie Sanders
| Poll source | Date(s) administered |
Sample size[f] |
Margin of error |
Nikki Haley (R) |
Bernie Sanders (D) |
Undecided |
|---|---|---|---|---|---|---|
| SurveyUSA | Oct 15–16, 2019 | 1,242 (RV) | ± 3.8% | 23% | 58% | 19% |
| SurveyUSA | Sep 13–15, 2019 | 1,785 (RV) | ± 3.2% | 24% | 56% | 19% |
with Nikki Haley and Elizabeth Warren
| Poll source | Date(s) administered |
Sample size[f] |
Margin of error |
Nikki Haley (R) |
Elizabeth Warren (D) |
Undecided |
|---|---|---|---|---|---|---|
| SurveyUSA | Oct 15–16, 2019 | 1,242 (RV) | ± 3.9% | 23% | 52% | 24% |
| SurveyUSA | Sep 13–15, 2019 | 1,785 (RV) | ± 3.2% | 25% | 49% | 26% |
with Mike Pence and Kamala Harris
| Poll source | Date(s) administered |
Sample size[f] |
Margin of error |
Mike Pence (R) |
Kamala Harris (D) |
Undecided |
|---|---|---|---|---|---|---|
| SurveyUSA | Nov 20–22, 2019 | 2,039 (RV) | ± 2.4% | 34% | 54% | 12% |
| SurveyUSA | Oct 15–16, 2019 | 1,242 (RV) | ± 3.9% | 33% | 55% | 12% |
| SurveyUSA | Sep 13–15, 2019 | 1,785 (RV) | ± 3.2% | 34% | 51% | 15% |
with Mike Pence and Beto O'Rourke
| Poll source | Date(s) administered |
Sample size[f] |
Margin of error |
Mike Pence (R) |
Beto O'Rourke (D) |
Undecided |
|---|---|---|---|---|---|---|
| SurveyUSA | Sep 13–15, 2019 | 1,785 (RV) | ± 3.2% | 34% | 47% | 20% |
with Nikki Haley and Kamala Harris
| Poll source | Date(s) administered |
Sample size[f] |
Margin of error |
Nikki Haley (R) |
Kamala Harris (D) |
Undecided |
|---|---|---|---|---|---|---|
| SurveyUSA | Oct 15–16, 2019 | 1,242 (RV) | ± 3.9% | 23% | 52% | 25% |
| SurveyUSA | Sep 13–15, 2019 | 1,785 (RV) | ± 3.2% | 24% | 51% | 25% |
with Nikki Haley and Beto O'Rourke
| Poll source | Date(s) administered |
Sample size[f] |
Margin of error |
Nikki Haley (R) |
Beto O'Rourke (D) |
Undecided |
|---|---|---|---|---|---|---|
| SurveyUSA | Sep 13–15, 2019 | 1,785 (RV) | ± 3.2% | 25% | 44% | 30% |
Results edit
Biden won California with a smaller margin of victory than Hillary Clinton in 2016. Nevertheless, he performed well in most urban areas of the state. Biden is also the first candidate for any statewide race in American history to receive over ten million votes.
- >50%
- 40–50%
- 30–40%
- 20–30%
- 15–20%
- 10–15%
- 5–10%
- 1–5%
- 1–5%
- 5–10%
- 10–15%
- 15–20%
- 20–30%
- 30–40%
- 40–50%
- >50%
| Party | Candidate | Votes | % | ±% | |
|---|---|---|---|---|---|
| Democratic | Joe Biden Kamala Harris |
11,110,250 | 63.48% | +1.75% | |
| Republican | Donald Trump Mike Pence |
6,006,429 | 34.32% | +2.70% | |
| Libertarian | Jo Jorgensen Spike Cohen |
187,895 | 1.07% | −2.30% | |
| Green | Howie Hawkins Angela Walker |
81,029 | 0.46% | −1.51% | |
| American Independent | Rocky De La Fuente Kanye West |
60,160 | 0.34% | N/A | |
| Peace and Freedom | Gloria La Riva Sunil Freeman |
51,037 | 0.29% | −0.18% | |
| American Solidarity | Brian T. Carroll Amar Patel (write-in) |
2,605 | 0.0 | - | |
| Independent | Jesse Ventura (write-in) | 611 | 0.0 | N/A | |
| Independent | Mark Charles Adrian Wallace (write-in) |
559 | 0.0 | N/A | |
| Independent | Brock Pierce Karla Ballard (write-in) |
185 | 0.0 | N/A | |
| Socialist Equality | Joseph Kishore Norissa Santa Cruz (write-in) |
121 | 0.0 | N/A | |
| Total votes | 17,500,881 | 100% | |||
By county edit
| County | Joe Biden Democratic |
Donald Trump Republican |
Various candidates Other parties |
Margin | Total votes cast | ||||
|---|---|---|---|---|---|---|---|---|---|
| # | % | # | % | # | % | # | % | ||
| Alameda | 617,659 | 79.83% | 136,309 | 17.62% | 19,785 | 2.55% | 481,350 | 62.21% | 773,753 |
| Alpine | 476 | 63.81% | 244 | 32.71% | 26 | 3.48% | 232 | 31.10% | 746 |
| Amador | 8,153 | 36.40% | 13,585 | 60.66% | 659 | 2.94% | −5,432 | −24.26% | 22,397 |
| Butte | 50,815 | 49.54% | 48,819 | 47.60% | 2,931 | 2.86% | 1,996 | 1.94% | 102,565 |
| Calaveras | 10,046 | 36.84% | 16,518 | 60.57% | 708 | 2.59% | −6,472 | −23.73% | 27,272 |
| Colusa | 3,239 | 40.69% | 4,559 | 57.27% | 163 | 2.04% | −1,320 | −16.58% | 7,961 |
| Contra Costa | 416,386 | 71.63% | 152,877 | 26.30% | 12,053 | 2.07% | 263,509 | 45.33% | 581,316 |
| Del Norte | 4,677 | 40.84% | 6,461 | 56.41% | 315 | 2.75% | −1,784 | −15.57% | 11,453 |
| El Dorado | 51,621 | 44.44% | 61,838 | 53.24% | 2,700 | 2.32% | −10,217 | −8.80% | 116,159 |
| Fresno | 193,025 | 52.90% | 164,464 | 45.07% | 7,428 | 2.03% | 28,561 | 7.83% | 364,917 |
| Glenn | 3,995 | 35.36% | 7,063 | 62.52% | 239 | 2.12% | −3,068 | −27.16% | 11,297 |
| Humboldt | 44,768 | 64.48% | 21,770 | 31.36% | 2,886 | 4.16% | 22,998 | 33.12% | 69,424 |
| Imperial | 34,678 | 61.11% | 20,847 | 36.74% | 1,218 | 2.15% | 13,831 | 24.37% | 56,743 |
| Inyo | 4,634 | 48.86% | 4,620 | 48.71% | 230 | 2.43% | 14 | 0.15% | 9,484 |
| Kern | 133,366 | 43.68% | 164,484 | 53.88% | 7,442 | 2.44% | −31,118 | −10.20% | 305,292 |
| Kings | 18,699 | 42.63% | 24,072 | 54.88% | 1,090 | 2.49% | −5,373 | −12.25% | 43,861 |
| Lake | 14,941 | 51.55% | 13,123 | 45.27% | 922 | 3.18% | 1,818 | 6.28% | 28,986 |
| Lassen | 2,799 | 23.24% | 8,970 | 74.47% | 276 | 2.29% | −6,171 | −51.23% | 12,045 |
| Los Angeles | 3,028,885 | 71.03% | 1,145,530 | 26.86% | 89,950 | 2.11% | 1,883,355 | 44.17% | 4,264,365 |
| Madera | 23,168 | 43.12% | 29,378 | 54.68% | 1,186 | 2.20% | −6,210 | −11.56% | 53,732 |
| Marin | 128,288 | 82.33% | 24,612 | 15.79% | 2,930 | 1.88% | 103,676 | 66.54% | 155,830 |
| Mariposa | 4,088 | 39.77% | 5,950 | 57.88% | 242 | 2.35% | −1,862 | −18.11% | 10,280 |
| Mendocino | 28,782 | 66.41% | 13,267 | 30.61% | 1,291 | 2.98% | 15,515 | 35.80% | 43,340 |
| Merced | 48,991 | 53.84% | 39,397 | 43.30% | 2,605 | 2.86% | 9,594 | 10.54% | 90,993 |
| Modoc | 1,150 | 26.33% | 3,109 | 71.19% | 108 | 2.48% | −1,959 | −44.86% | 4,367 |
| Mono | 4,013 | 59.56% | 2,513 | 37.30% | 212 | 3.14% | 1,500 | 22.26% | 6,738 |
| Monterey | 113,953 | 69.52% | 46,299 | 28.24% | 3,671 | 2.24% | 67,654 | 41.28% | 163,923 |
| Napa | 49,817 | 69.05% | 20,676 | 28.66% | 1,657 | 2.29% | 29,141 | 40.39% | 72,150 |
| Nevada | 36,359 | 55.76% | 26,779 | 41.07% | 2,064 | 3.17% | 9,580 | 14.69% | 65,202 |
| Orange | 814,009 | 53.48% | 676,498 | 44.44% | 31,606 | 2.08% | 137,511 | 9.04% | 1,522,113 |
| Placer | 106,869 | 45.46% | 122,488 | 52.10% | 5,727 | 2.44% | −15,619 | −6.64% | 235,084 |
| Plumas | 4,561 | 40.51% | 6,445 | 57.24% | 254 | 2.25% | −1,884 | −16.73% | 11,260 |
| Riverside | 528,340 | 52.98% | 449,144 | 45.04% | 19,672 | 1.98% | 79,196 | 7.94% | 997,156 |
| Sacramento | 440,808 | 61.36% | 259,405 | 36.11% | 18,227 | 2.53% | 181,403 | 25.25% | 718,440 |
| San Benito | 17,628 | 61.14% | 10,590 | 36.73% | 612 | 2.13% | 7,038 | 24.41% | 28,830 |
| San Bernardino | 455,859 | 54.20% | 366,257 | 43.54% | 19,014 | 2.26% | 89,602 | 10.66% | 841,130 |
| San Diego | 964,650 | 60.21% | 600,094 | 37.46% | 37,399 | 2.33% | 364,556 | 22.75% | 1,602,143 |
| San Francisco | 378,156 | 85.26% | 56,417 | 12.72% | 8,980 | 2.02% | 321,739 | 72.54% | 443,553 |
| San Joaquin | 161,137 | 55.61% | 121,098 | 41.79% | 7,546 | 2.60% | 40,039 | 13.82% | 289,781 |
| San Luis Obispo | 88,310 | 55.29% | 67,436 | 42.22% | 3,968 | 2.49% | 20,874 | 13.07% | 159,714 |
| San Mateo | 291,496 | 77.89% | 75,584 | 20.20% | 7,171 | 1.91% | 215,912 | 57.69% | 374,251 |
| Santa Barbara | 129,963 | 64.52% | 65,736 | 32.63% | 5,733 | 2.85% | 64,227 | 31.89% | 201,432 |
| Santa Clara | 617,967 | 72.64% | 214,612 | 25.23% | 18,162 | 2.13% | 403,355 | 47.41% | 850,741 |
| Santa Cruz | 114,246 | 78.44% | 26,937 | 18.49% | 4,466 | 3.07% | 87,309 | 59.95% | 145,649 |
| Shasta | 30,000 | 32.28% | 60,789 | 65.41% | 2,141 | 2.31% | −30,789 | −33.13% | 92,930 |
| Sierra | 730 | 37.49% | 1,142 | 58.65% | 75 | 3.86% | −412 | −21.16% | 1,947 |
| Siskiyou | 9,593 | 40.87% | 13,290 | 56.62% | 589 | 2.51% | −3,697 | −15.75% | 23,472 |
| Solano | 131,639 | 63.65% | 69,306 | 33.51% | 5,886 | 2.84% | 62,333 | 30.14% | 206,831 |
| Sonoma | 199,938 | 74.52% | 61,825 | 23.04% | 6,554 | 2.44% | 138,113 | 51.48% | 268,317 |
| Stanislaus | 105,841 | 49.00% | 104,145 | 48.22% | 6,001 | 2.78% | 1,696 | 0.78% | 215,987 |
| Sutter | 17,367 | 40.73% | 24,375 | 57.16% | 902 | 2.11% | −7,008 | −16.43% | 42,644 |
| Tehama | 8,911 | 31.02% | 19,141 | 66.62% | 679 | 2.36% | −10,230 | −35.60% | 28,731 |
| Trinity | 2,851 | 45.04% | 3,188 | 50.36% | 291 | 4.60% | −337 | −5.32% | 6,330 |
| Tulare | 66,105 | 45.00% | 77,579 | 52.82% | 3,201 | 2.18% | −11,474 | −7.82% | 146,885 |
| Tuolumne | 11,978 | 39.39% | 17,689 | 58.17% | 741 | 2.44% | −5,711 | −18.78% | 30,408 |
| Ventura | 251,388 | 59.45% | 162,207 | 38.36% | 9,230 | 2.19% | 89,181 | 21.09% | 422,825 |
| Yolo | 67,598 | 69.48% | 27,292 | 28.05% | 2,404 | 2.47% | 40,306 | 41.43% | 97,294 |
| Yuba | 11,230 | 37.69% | 17,676 | 59.32% | 890 | 2.99% | −6,446 | −21.63% | 29,796 |
| Total | 11,110,639 | 63.44% | 6,006,518 | 34.30% | 395,108 | 2.26% | 5,104,121 | 29.14% | 17,512,265 |


Counties that flipped from Republican to Democratic edit
By congressional district edit
Biden won 46 of the 53 congressional districts in California, including four that were flipped or held by Republicans in Congress.[41]
Analysis edit
Joe Biden won California by a landslide margin of 29.2%. Despite Biden's overall victory closely mirroring Clinton's, under a point behind her margin, there were large swings underneath the statewide margins. Biden lost ground in large diverse counties while improving in mostly whiter and more suburban counties.[42] While Trump yet again lost Los Angeles County by a landslide and yet again received less than 30% of the vote in the county, he improved his standing in Los Angeles County, thanks to growth in mainly Latino neighborhoods in the Gateway Cities and the San Fernando Valley, alongside improvements in mainly Asian communities in the San Gabriel Valley. Trump also managed to gain in white neighborhoods as well, with visible gains made in Beverly Hills and other Westside communities, mainly because of the region’s high Jewish population, Burbank and Glendale in the eastern San Fernando Valley, and the Valley's southern wealthy neighborhoods such as Encino and Tarzana.[43][44] California is also one of the six states (along with Arkansas, Nevada, Utah, Florida, and Hawaii) as well as the District of Columbia in which Trump’s margin increased from 2016.
While Biden won Santa Clara County by a landslide margin of 72%, his margins shrank below that of Hillary Clinton's 2016 margins in the county. His margins slightly shrank in the more suburban communities of Santa Clara and Sunnyvale, even improving in very wealthy cities like Los Altos Hills and Saratoga, but his margins fell in the heavily Asian parts of San Jose, and Milpitas, which Biden won by a landslide, as Trump's comparison of Biden's proposed policies to socialism and communism drove Vietnamese American voters towards him. The issue over China in the South China Sea helped swing Vietnamese Americans, as well as Filipino American voters to the Republican Party. Nonetheless, Trump still received a small 25% of the vote in Santa Clara County, underperforming President Bush in 2004, John McCain in 2008 and Mitt Romney in 2012. [45] Trump also gained in Alameda and San Francisco County, but his improvements were smaller than Santa Clara County and Los Angeles County.[42] Meanwhile, Biden gained in the more white and suburban San Diego County and Riverside County.[46] In the former, Biden's improvements in wealthy suburban areas, like Carlsbad and Encinitas, alongside gains in more working-class Escondido and Oceanside,[47] helped overcome Trump's growth in the more Hispanic neighborhoods in southern San Diego County. In Riverside County, Trump lost ground in whiter more Republican territory in the southern part of the county like Menifee and Temecula, and in very liberal communities like Palm Springs in the Coachella Valley, which overcame Biden's decline in Hispanic communities towards the county's northwest, including Moreno Valley and Perris.[44] Trump also gained grounds in certain areas like West Covina and Carson.[44]
Outside the large population centers and the Inland Empire, both parties largely ran in line with their 2016 performances. In the Central Valley, Biden's margin was roughly unchanged, though he lost some support in the northern counties like Merced and Stanislaus while gaining in the more Republican southern counties around Kern (Bakersfield).[48] Biden improved by a point in Sacramento County but saw visible growth in suburban Placer County. However, Trump overwhelmingly outperformed his 2016 performance in rural and heavily Hispanic Imperial County, gaining 17 points.[48]
Edison exit polls edit
| 2020 presidential election in California by demographic subgroup (Edison exit polling)[49][50] | |||
|---|---|---|---|
| Demographic subgroup | Biden | Trump | % of
total vote |
| Total vote | 63.48 | 34.32 | 100 |
| Ideology | |||
| Liberals | 90 | 9 | 29 |
| Moderates | 70 | 28 | 41 |
| Conservatives | 28 | 70 | 30 |
| Party | |||
| Democrats | 97 | 2 | 50 |
| Republicans | 10 | 89 | 30 |
| Independents | 57 | 35 | 20 |
| Gender | |||
| Men | 63 | 34 | 47 |
| Women | 63 | 35 | 53 |
| Race/ethnicity | |||
| White | 51 | 47 | 49 |
| Black | 82 | 15 | 9 |
| Latino | 75 | 23 | 31 |
| Asian | 76 | 22 | 6 |
| Other | 59 | 35 | 5 |
| Age | |||
| 18–24 years old | 73 | 27 | 9 |
| 25–29 years old | 78 | 21 | 5 |
| 30–39 years old | 63 | 32 | 20 |
| 40–49 years old | 58 | 41 | 17 |
| 50–64 years old | 62 | 36 | 31 |
| 65 and older | 61 | 37 | 19 |
| Sexual orientation | |||
| LGBT | – | – | 7 |
| Not LGBT | 62 | 37 | 93 |
| Education | |||
| High school or less | 54 | 45 | 14 |
| Some college education | 59 | 37 | 26 |
| Associate's degree | 63 | 36 | 16 |
| Bachelor's degree | 65 | 34 | 29 |
| Postgraduate degree | 74 | 24 | 15 |
| Income | |||
| Under $50,000 | 61 | 37 | 36 |
| $50,000–$99,999 | 61 | 37 | 36 |
| Over $100,000 | 65 | 34 | 29 |
| Issue regarded as most important | |||
| Racial inequality | 93 | 6 | 18 |
| Coronavirus | 90 | 9 | 23 |
| Economy | 27 | 72 | 21 |
| Crime and safety | – | – | 17 |
| Health care | – | – | 17 |
| Region | |||
| Coastal | 65 | 34 | 10 |
| Inland | 52 | 45 | 30 |
| Bay Area | 75 | 23 | 18 |
| Los Angeles County | 71 | 27 | 24 |
| Southern coast | 58 | 39 | 18 |
| Area type | |||
| Urban | 68 | 30 | 43 |
| Suburban | 60 | 37 | 52 |
| Rural | – | – | 5 |
| Family's financial situation today | |||
| Better than four years ago | 43 | 55 | 37 |
| Worse than four years ago | 80 | 14 | 25 |
| About the same | 67 | 31 | 38 |
See also edit
- United States presidential elections in California
- 2020 California elections
- 2020 United States presidential election
- 2020 Democratic Party presidential primaries
- 2020 Republican Party presidential primaries
- 2020 Libertarian Party presidential primaries
- 2020 Green Party presidential primaries
- 2020 United States elections
Notes edit
- ^ The other five states were Arkansas, Florida, Hawaii, Nevada, and Utah, as well as Washington DC.
- ^ a b c Candidate withdrew shortly before the primary, when all-mail voting had already begun.
- ^ a b c Candidate withdrew following the New Hampshire primary, when all-mail voting had already begun.
- ^ Including 34 write-in votes
- ^ Calculated by taking the difference of 100% and all other candidates combined.
- ^ a b c d e f g h i j k l m n o p q r s t u v w x y z aa ab ac ad ae af ag ah ai aj Key:
A – all adults
RV – registered voters
LV – likely voters
V – unclear - ^ a b Overlapping sample with the previous SurveyMonkey/Axios poll, but more information available regarding sample size
- ^ "Someone else" with 4%
- ^ a b De La Fuente (A) and De La Riva (PSOL) with 0%
- ^ a b De La Fuente listed as Guerra
- ^ a b Would not vote with 1%; "Someone else" with no voters
- ^ "Another candidate" with 3%
- ^ "Another Third Party/Write-in" with 1%
- ^ Archived September 27, 2020, at the Wayback Machine
- ^ "Someone else" with 3%
- ^ "Another Third Party/Write-in" with 2%
- ^ "Someone else" with 4%; would not vote with 2%
- ^ Including voters who lean towards a given candidate
- ^ a b c d Other with 0%; neither with 3%
- ^ "Other" with 3%; would not vote with 3%
- ^ a b c Other with 1%; neither with 3%
- ^ "Other" with 3%; would not vote with 2%
- ^ "Other" with 6%; would not vote with 4%
- ^ a b c Other with 0%; neither with 4%
- ^ "Other" with 5%; would not vote with 2%
- ^ "Other" with 5%; would not vote with 3%
References edit
- ^ "Historical Voter Registration and Participation" (PDF). elections.cdn.sos.ca.gov. Retrieved March 7, 2023.
- ^ Kelly, Ben (August 13, 2018). "US elections key dates: When are the 2018 midterms and the 2020 presidential campaign?". The Independent. Archived from the original on January 3, 2019. Retrieved January 3, 2019.
- ^ "Texas Presidential Election Results". The New York Times. January 5, 2021. ISSN 0362-4331. Retrieved January 8, 2021.
- ^ "California 2020 President exit polls". www.cnn.com. Retrieved August 8, 2021.
- ^ Damon 🗳 [@DamonMag] (December 13, 2020). "Trump lost Orange County by 8.6 points in 2016 and by 9 points this year. On the surface, that's not a sizable shift, but underneath a LOT changed. This is how #OrangeCounty voted in 2020 compared to 2016. There is an undeniable realignment in many parts of the county. https://t.co/SOyncFCKcv" (Tweet). Archived from the original on August 22, 2021. Retrieved August 23, 2021 – via Twitter.
- ^ "Biden officially secures enough electors to become president". AP NEWS. December 5, 2020.
- ^ Dezenski, Lauren (December 19, 2018). "Why California leapfrogged the 2020 primary schedule". Archived from the original on January 22, 2019. Retrieved March 4, 2019.
- ^ Richards, Sam (March 30, 2017). "Jerry Brown for president? 'Don't rule it out!'". Contra Costa Times. Archived from the original on May 10, 2017. Retrieved May 10, 2017.
- ^ Steinmetz, Katy (September 9, 2017). "The Philosopher King". Time. Archived from the original on November 10, 2017. Retrieved November 7, 2017.
- ^ Desk, Washington (March 4, 2019). "Former AG Eric Holder rules out 2020 run". Archived from the original on March 6, 2019. Retrieved March 4, 2019.
- ^ "California justices skeptical of requiring Trump tax returns". KCRA. November 6, 2019. Archived from the original on November 11, 2019. Retrieved November 11, 2019.
- ^ Augie Martin and Paul LeBlanc (September 19, 2019). "Federal judge halts California law forcing Trump to release tax returns to qualify for ballot". CNN. Archived from the original on December 5, 2019. Retrieved December 10, 2019.
- ^ "California GOP opens alternative pathway for 2020 delegates". AP NEWS. September 8, 2019. Archived from the original on November 11, 2019. Retrieved November 11, 2019.
- ^ "California Republican Primary Results". electionresults.sos.ca.gov. Retrieved March 20, 2020.
- ^ "Joe Biden, Elizabeth Warren snubbing the Golden State, says California Democratic Party chair". November 6, 2019.
- ^ "Statement of Vote: Presidential Primary Election, March 3, 2020" (PDF). Secretary of State of California. May 1, 2020. Retrieved July 12, 2020.
- ^ a b "California Democratic Delegation 2020". The Green Papers. June 21, 2019. Retrieved June 22, 2019.
- ^ a b "Presidential Primary Election - Statement of Vote, March 3, 2020 :: California Secretary of State". www.sos.ca.gov.
- ^ Delegate and Alternate Allocation per Congressional District California Democratic Party.
- ^ a b Myers, John (October 21, 2019). "California independents can cast ballots for Democrats — but not Trump — in March primary". Los Angeles Times. Archived from the original on November 16, 2019. Retrieved November 17, 2019.
- ^ "Statement of Vote: Presidential Primary Election, March 3, 2020" (PDF). Secretary of State of California. May 1, 2020. Retrieved July 12, 2020.
- ^ "California Green Party Primary". er.ncsbe.gov. Archived from the original on March 5, 2020. Retrieved March 4, 2020.
- ^ "Generally Recognized Presidential Candidates – March 3, 2020, Presidential Primary Election". Archived (PDF) from the original on December 7, 2019. Retrieved December 7, 2019.
- ^ "2020 California Presidential Primary Election Results". Election Results. Archived from the original on March 4, 2020. Retrieved March 4, 2020.
- ^ "2020 POTUS Race ratings" (PDF). The Cook Political Report. Archived from the original on March 23, 2020. Retrieved May 21, 2019.
- ^ "POTUS Ratings | Inside Elections". insideelections.com. Archived from the original on May 27, 2020. Retrieved May 21, 2019.
- ^ "Larry J. Sabato's Crystal Ball » 2020 President". crystalball.centerforpolitics.org. Archived from the original on April 4, 2020. Retrieved May 21, 2019.
- ^ "2020 Election Forecast". Politico. November 19, 2019. Archived from the original on June 14, 2020. Retrieved April 8, 2020.
- ^ "Battle for White House". RCP. April 19, 2019. Archived from the original on May 3, 2020. Retrieved April 27, 2020.
- ^ 2020 Bitecofer Model Electoral College Predictions Archived April 23, 2020, at the Wayback Machine, Niskanen Center, March 24, 2020, retrieved: April 19, 2020.
- ^ David Chalian; Terence Burlij (June 11, 2020). "Road to 270: CNN's debut Electoral College map for 2020". CNN. Archived from the original on June 16, 2020. Retrieved June 16, 2020.
- ^ "Forecasting the US elections". The Economist. Archived from the original on July 5, 2020. Retrieved July 7, 2020.
- ^ "2020 Election Battleground Tracker". CBS News. July 12, 2020. Archived from the original on July 12, 2020. Retrieved July 13, 2020.
- ^ "2020 Presidential Election Interactive Map". 270 to Win. Archived from the original on April 15, 2020. Retrieved April 15, 2020.
- ^ "ABC News Race Ratings". CBS News. July 24, 2020. Archived from the original on July 24, 2020. Retrieved July 24, 2020.
- ^ Montanaro, Domenico (August 3, 2020). "2020 Electoral Map Ratings: Trump Slides, Biden Advantage Expands Over 270 Votes". NPR.org. Archived from the original on August 4, 2020. Retrieved August 3, 2020.
- ^ "Biden dominates the electoral map, but here's how the race could tighten". NBC News. August 6, 2020. Archived from the original on August 7, 2020. Retrieved August 6, 2020.
- ^ "2020 Election Forecast". FiveThirtyEight. August 12, 2020. Archived from the original on August 14, 2020. Retrieved August 14, 2020.
- ^ "Certificate of Ascertainment" (PDF). archives.gov. December 5, 2020. Retrieved December 9, 2020.
- ^ "Statement of Vote, General Election, November 3, 2020" (PDF). California Secretary of State. December 11, 2020. Retrieved December 19, 2020.
- ^ "Daily Kos Elections' presidential results by congressional district for 2020, 2016, and 2012". Daily Kos.
- ^ a b 2020 General election cdn.sos.ca.gov
- ^ "DRA 2020". Daves Redistricting. Retrieved February 14, 2023.
- ^ a b c Park, Alice; Smart, Charlie; Taylor, Rumsey; Watkins, Miles (February 2, 2021). "An Extremely Detailed Map of the 2020 Election". The New York Times. ISSN 0362-4331. Retrieved February 14, 2023.
- ^ Cai, Weiyi; Fessenden, Ford (December 21, 2020). "Immigrant Neighborhoods Shifted Red as the Country Chose Blue". The New York Times. ISSN 0362-4331. Retrieved February 14, 2023.
- ^ Dotinga, Randy (December 17, 2020). "How San Diego Got So Blue in a Relatively Short Amount of Time". Voice of San Diego. Retrieved February 14, 2023.
- ^ Supplement to Statement of Vote
- ^ a b "Flourish | Data Visualisation & Storytelling". Flourish. Retrieved February 14, 2023.
- ^ "California 2020 President exit polls". www.cnn.com. Retrieved December 28, 2020.
- ^ "California Exit Polls: How Different Groups Voted". www.nytimes.com. Retrieved December 28, 2020.
Further reading edit
- Summary: State Laws on Presidential Electors (PDF), Washington DC: National Association of Secretaries of State, August 2020,
California