


Summary
The 2020 United States presidential election in New Hampshire was held on Tuesday, November 3, 2020, as part of the 2020 United States presidential election in which all 50 states and the District of Columbia participated.[2] New Hampshire voters chose electors to represent them in the Electoral College via a popular vote, pitting the Republican Party's nominees, incumbent President Donald Trump and Vice President Mike Pence, against the Democratic Party's nominees, former Vice President Joe Biden and his running mate, Senator Kamala Harris. New Hampshire has four electoral votes in the Electoral College.[3]
| ||||||||||||||||||||||||||
| Turnout | 73.5% [1] | |||||||||||||||||||||||||
|---|---|---|---|---|---|---|---|---|---|---|---|---|---|---|---|---|---|---|---|---|---|---|---|---|---|---|
| ||||||||||||||||||||||||||


| ||||||||||||||||||||||||||
| ||||||||||||||||||||||||||

New Hampshire is by far the most fiscally conservative state in New England, and its population has a strong disdain for taxes, historically giving Republicans an edge in its state office elections. However, like the rest of the region, it is very liberal on social issues like abortion and gay rights, and thus the Democratic Party has dominated in its federal elections in recent years. Although the state came extremely close to voting for Trump in 2016, polls throughout the 2020 campaign showed a clear Biden lead, and prior to election day, all 14 news organizations considered New Hampshire a state that Biden was favored to win.
Per exit polls by the Associated Press, Biden prevailed in the state by garnering the votes of 58% of white women, and 69% of unmarried women.[4] Biden carried voters prioritizing healthcare policy with 73% campaigning on protecting coverage for pre-existing conditions,[4] a resonant issue in a state plagued by the opioid crisis.
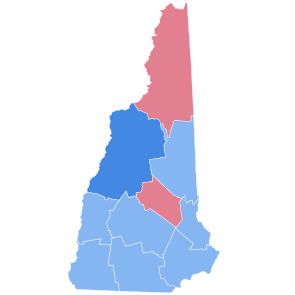
Corresponding Democratic victories in the Senate election and both House elections reaffirmed the Democrats' strength in what used to be a heavily contested battleground. Contrary to earlier projections however, New Hampshire Republicans took control of both the executive and legislative branches of the New Hampshire government. Republicans flipped the previously Democrat-held New Hampshire state Senate and House of Representatives. Republicans also gained control of the state’s Executive Council, and Republican Gov. Chris Sununu was reelected for a third term with 65% of the vote.[5] Biden's best margin was in the socially liberal Connecticut River Valley, which had overwhelmingly favored Bernie Sanders in the Democratic primary, while Trump's strength came in the rural Great North Woods Region. Biden was the first Democrat to ever win the White House without Coös County.
Primary elections edit
The New Hampshire primary, traditionally the first, was held on February 11, 2020, roughly a week after the Iowa caucuses.[6]
Republican primary edit
The New Hampshire Republican primary took place on February 11, 2020. Incumbent president Donald Trump won the Republican primary with 85.6 percent of the vote, clinching all of the state's 22 pledged delegates to the 2020 Republican National Convention.[7] Typically, the top candidates of the other major party receive a large number of write-in votes.

| Candidate | Votes | % | Estimated delegates |
|---|---|---|---|
| Donald Trump (incumbent) | 129,734 | 84.42 | 22 |
| Bill Weld | 13,844 | 9.01 | 0 |
| Joe Walsh (withdrawn) | 838 | 0.55 | 0 |
| Mitt Romney (write-in) | 632 | 0.41 | 0 |
| Rocky De La Fuente | 148 | 0.10 | 0 |
| Robert Ardini | 77 | 0.05 | 0 |
| Bob Ely | 68 | 0.04 | 0 |
| Zoltan Istvan | 56 | 0.04 | 0 |
| Others / Write-in | 2,339 | 1.52 | 0 |
| Pete Buttigieg (write-in Democratic) | 1,136 | 0.74 | 0 |
| Amy Klobuchar (write-in Democratic) | 1,076 | 0.70 | 0 |
| Mike Bloomberg (write-in Democratic) | 801 | 0.52 | 0 |
| Bernie Sanders (write-in Democratic) | 753 | 0.49 | 0 |
| Tulsi Gabbard (write-in Democratic) | 369 | 0.24 | 0 |
| Joe Biden (write-in Democratic) | 330 | 0.21 | 0 |
| Tom Steyer (write-in Democratic) | 191 | 0.12 | 0 |
| Andrew Yang (write-in Democratic) | 162 | 0.11 | 0 |
| Elizabeth Warren (write-in Democratic) | 157 | 0.10 | 0 |
| Other write-in Democrats | 963 | 0.63 | 0 |
| Total | 153,674 | 100% | 22 |
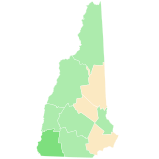
Democratic primary edit
Bernie Sanders won the Democratic primary with 25.6 percent of the vote, ahead of second-place Pete Buttigieg, who received 24.3 percent of the vote. Both Sanders and Buttigieg received nine delegates to the 2020 Democratic National Convention. Amy Klobuchar finished in third place with 19.7 percent of the vote and earned six delegates. Elizabeth Warren and Joe Biden finished in fourth and fifth place, respectively, and each received zero delegates.[10]
| Candidate | Votes | % | Delegates[13][14] |
|---|---|---|---|
| Bernie Sanders | 76,384 | 25.60 | 9 |
| Pete Buttigieg | 72,454 | 24.28 | 9 |
| Amy Klobuchar | 58,714 | 19.68 | 6 |
| Elizabeth Warren | 27,429 | 9.19 | |
| Joe Biden | 24,944 | 8.36 | |
| Tom Steyer | 10,732 | 3.60 | |
| Tulsi Gabbard | 9,755 | 3.27 | |
| Andrew Yang | 8,312 | 2.79 | |
| Michael Bloomberg (write-in)[12][15] | 4,675 | 1.57 | |
| Deval Patrick | 1,271 | 0.43 | |
| Michael Bennet | 952 | 0.32 | |
| Cory Booker (withdrawn) | 157 | 0.05 | |
| Joe Sestak (withdrawn) | 152 | 0.05 | |
| Kamala Harris (withdrawn) | 129 | 0.04 | |
| Marianne Williamson (withdrawn) | 99 | 0.03 | |
| Julian Castro (withdrawn) | 83 | 0.03 | |
| John Delaney (withdrawn) | 83 | 0.03 | |
| Steve Bullock (withdrawn) | 64 | 0.02 | |
| Henry Hewes | 43 | 0.01 | |
| Ben Gleib (withdrawn) | 31 | 0.01 | |
| Other candidates / Write-in | [a]665 | 0.22 | |
| Donald Trump (write-in Republican)[12] | 1,217 | 0.41 | |
| Bill Weld (write-in Republican)[12] | 17 | 0.01 | |
| Mitt Romney (write-in Republican)[12] | 10 | 0.00 | |
| Other write-in Republicans | 5 | 0.00 | |
| Total | 298,377 | 100% | 24 |
Libertarian primary edit
| ||||||||||||||||||||||||||||||||||||||||||||||||||||||||||||||||
| ||||||||||||||||||||||||||||||||||||||||||||||||||||||||||||||||


Mail-in ballots were due by January 11, at the state convention. The primary was tabulated using Bucklin voting. Percentages shown are percentage of ballots cast.[16][17]
| Candidate | 1st | 2nd | 3rd | Total | Percentage |
|---|---|---|---|---|---|
| Vermin Supreme | 10 | 3 | 13 | 26 | 17.3% |
| Kim Ruff | 6 | 9 | 7 | 22 | 14.7% |
| Jo Jorgensen | 5 | 8 | 4 | 17 | 11.3% |
| None of the Above (NOTA) | 4 | 6 | 3 | 13 | 8.7% |
| Dan "Taxation Is Theft" Behrman | 0 | 6 | 7 | 13 | 8.7% |
| Jacob Hornberger (write-in) | 9 | 0 | 0 | 9 | 6.0% |
| Sam Robb | 1 | 2 | 5 | 8 | 5.3% |
| Mark Whitney (write-in) | 4 | 0 | 2 | 6 | 4.0% |
| Arvin Vohra | 1 | 0 | 5 | 6 | 4.0% |
| Ken Armstrong | 0 | 2 | 3 | 5 | 3.3% |
| Lincoln Chafee (write-in) | 1 | 2 | 1 | 4 | 2.7% |
| Justin Amash (write-in) | 1 | 1 | 1 | 3 | 2.0% |
| Keenan Wallace Dunham | 0 | 0 | 2 | 2 | 1.3% |
| Max Abramson | 1 | 0 | 0 | 1 | nil |
| Straw Poll (write-in) | 1 | 0 | 0 | 1 | nil |
| Joe Bishop-Henchman (write-in) | 0 | 0 | 1 | 1 | nil |
| Thomas Knapp (write-in) | 0 | 0 | 1 | 1 | nil |
| Adam Kokesh (write-in) | 0 | 0 | 1 | 1 | nil |
| Nicholas Sarwark (write-in) | 0 | 0 | 1 | 1 | nil |
| Exhausted Ballots/Undervotes | 0 | 5 | 5 | 10 | |
| Total | 44 | 44 | 62 | 150 |
| Candidate | 1st | 2nd | Total | Percentage |
|---|---|---|---|---|
| John Phillips | 15 | 6 | 21 | 63.6% |
| None of the Above | 9 | 6 | 15 | 45.5% |
| Spike Cohen (write-in) | 2 | 0 | 2 | 6.1% |
| Larry Sharpe (write-in) | 2 | 0 | 2 | 6.1% |
| Ron Paul (write-in) | 1 | 1 | 2 | 6.1% |
| Darryl W Perry (write-in) | 1 | 0 | 1 | 3.0% |
| Straw Poll (write-in) | 1 | 0 | 1 | 3.0% |
| Nicolas Sarwark (write-in) | 1 | 0 | 1 | 3.0% |
| Mark Whitney (write-in) | 1 | 0 | 1 | 3.0% |
| Exhausted Ballots/Undervotes | 11 | 20 | 31 | |
| Total | 44 | 33 | 77 |
General election edit
Final predictions edit
| Source | Ranking |
|---|---|
| The Cook Political Report[20] | Lean D |
| Inside Elections[21] | Likely D |
| Sabato's Crystal Ball[22] | Likely D |
| Politico[23] | Lean D |
| RCP[24] | Lean D |
| Niskanen[25] | Safe D |
| CNN[26] | Lean D |
| The Economist[27] | Likely D |
| CBS News[28] | Lean D |
| 270towin[29] | Lean D |
| ABC News[30] | Lean D |
| NPR[31] | Likely D |
| NBC News[32] | Lean D |
| 538[33] | Likely D |
Polling edit
Graphical summary edit
Aggregate polls edit
| Source of poll aggregation |
Dates administered |
Dates updated |
Joe Biden Democratic |
Donald Trump Republican |
Other/ Undecided [b] |
Margin |
|---|---|---|---|---|---|---|
| 270 to Win | October 14–29, 2020 | November 3, 2020 | 53.4% | 42.4% | 4.2% | Biden +11.0 |
| FiveThirtyEight | until November 2, 2020 | November 3, 2020 | 53.9% | 42.8% | 3.3% | Biden +11.1 |
| Average | 53.7% | 42.6% | 3.8% | Biden +11.1 | ||
Polls edit
| Poll source | Date(s) administered |
Sample size[c] |
Margin of error |
Donald Trump Republican |
Joe Biden Democratic |
Jo Jorgensen Libertarian |
Other | Undecided |
|---|---|---|---|---|---|---|---|---|
| SurveyMonkey/Axios | Oct 20 – Nov 2, 2020 | 1,013 (LV) | ± 4.5% | 45%[d] | 54% | - | – | – |
| American Research Group | Oct 26–28, 2020 | 600 (LV) | ± 4% | 39% | 58% | 1% | – | 2% |
| University of New Hampshire | Oct 24–28, 2020 | 864 (LV) | ± 3.3% | 45% | 53% | 1% | 1% | 1% |
| SurveyMonkey/Axios | Oct 1–28, 2020 | 1,791 (LV) | – | 44% | 55% | - | – | – |
| Saint Anselm College | Oct 23–26, 2020 | 1,018 (LV) | ± 3.1% | 44% | 52% | 2% | – | 2% |
| YouGov/UMass Amherst | Oct 16–26, 2020 | 757 (LV) | ± 4.5% | 43% | 53% | 2% | 1%[e] | 2% |
| University of New Hampshire | Oct 9–12, 2020 | 899 (LV) | ± 3.3% | 43% | 55% | 0% | 0%[f] | 2% |
| Suffolk University/Boston Globe | Oct 8–12, 2020 | 500 (LV) | ± 4.4% | 41% | 51% | 2% | 3%[g] | 5% |
| Saint Anselm College | Oct 1–4, 2020 | 1,147 (LV) | ± 2.9% | 41% | 53% | - | 4%[h] | 2% |
| Emerson College | Sep 30 – Oct 1, 2020 | 700 (LV) | ± 3.6% | 45%[i] | 53% | - | 2%[j] | – |
| SurveyMonkey/Axios | Sep 1–30, 2020 | 637 (LV) | – | 43% | 55% | - | – | 2% |
| American Research Group | Sep 25–28, 2020 | 600 (LV) | ± 4% | 44% | 53% | 1% | – | 2% |
| University of New Hampshire | Sep 24–28, 2020 | 972 (LV) | ± 3.1% | 44% | 53% | 1% | 0%[f] | 3% |
| Pulse Opinion Research/Center for American Greatness[A] | Sep 23–25, 2020 | 850 (LV) | ± 4% | 42%[i] | 56% | - | 1%[k] | 1% |
| YouGov/UMass Lowell | Sep 17–25, 2020 | 657 (LV) | ± 4.6% | 44%[l] | 52% | 1% | 2%[m] | 1% |
| 44%[n] | 53% | - | 0%[f] | 1% | ||||
| Siena College/NYT Upshot | Sep 8–11, 2020 | 445 (LV) | ± 5.5% | 42% | 45% | 4% | 2%[o] | 7%[p] |
| SurveyMonkey/Axios | Aug 1–31, 2020 | 444 (LV) | – | 39% | 60% | - | – | 1% |
| Saint Anselm College | Aug 15–17, 2020 | 1,042 (RV) | ± 3.0% | 43% | 51% | - | 4%[h] | 2% |
| SurveyMonkey/Axios | Jul 1–31, 2020 | 574 (LV) | – | 39% | 60% | - | – | 2% |
| University of New Hampshire | Jul 16–28, 2020 | 1,893 (LV) | ± 2.3% | 40% | 53% | - | 4%[q] | 3% |
| SurveyMonkey/Axios | Jun 8–30, 2020 | 191 (LV) | – | 39% | 61% | - | – | 1% |
| University of New Hampshire | Jun 18–22, 2020 | 936 (LV) | – | 39% | 52% | - | 6%[r] | 3% |
| Saint Anselm College | Jun 13–16, 2020 | 1,072 (RV) | ± 3% | 42% | 49% | - | 5% | 3% |
| University of New Hampshire | May 14–18, 2020 | 790 (LV) | – | 46% | 44% | - | 5%[s] | 5% |
| Saint Anselm College | Apr 23–27, 2020 | 820 (RV) | ± 3.4% | 42% | 50% | - | 2% | 7% |
| University of New Hampshire | Feb 19–25, 2020 | 569 (LV) | ± 4.1% | 46% | 44% | - | 8%[t] | 2% |
| AtlasIntel | Feb 8–10, 2020 | 1,100 (RV) | ± 3% | 46% | 44% | - | 11% | – |
| McLaughlin & Associates/NH Journal[1] | Feb 4–5, 2020 | 400 (LV) | ± 4.9% | 49%[u] | 45% | - | –[v] | –[v] |
| Marist College/NBC News | Jan 20–23, 2020 | 2,223 (RV) | ± 2.6% | 43% | 51% | - | 2% | 5% |
| Emerson College | Nov 23–26, 2019 | 637 (RV) | ± 3.8% | 48% | 52% | - | – | – |
| 547 (RV) | ± 4.1% | 42% | 46% | - | – | 13% | ||
| Saint Anselm College | Nov 13–18, 2019 | 512 (RV) | ± 4.3% | 43% | 51% | - | – | 6% |
| Emerson College | Sep 6–9, 2019 | 1,041 (RV) | ± 3.0% | 45% | 55% | - | – | – |
| Gravis Marketing | Aug 2–6, 2019 | 505 (RV) | ± 4.4% | 40% | 53% | - | – | 7% |
| Emerson College Archived February 23, 2019, at the Wayback Machine | Feb 21–22, 2019 | 910 (RV) | ± 3.2% | 45% | 55% | - | – | – |
| American Research Group | Mar 21–27, 2018 | 1,365 (RV) | ± 3.0% | 39% | 53% | - | – | 8% |
Former candidates
| ||||||||||||||||||||||||||||||||||||||||||||||||||||||||||||||||||||||||||||||||||||||||||||||||||||||||||||||||||||||||||||||||||||||||||||||||||||||||||||||||||||||||||||||||||||||||||||||||||||||||||||||||||||||||||||||||||||||||||||||||||||||||||||||||||||||||||||||||||||||||||||||||||||||||||||||||||||||||||||||||||||||||||||||||||||||||||||||||||||||||||
|---|---|---|---|---|---|---|---|---|---|---|---|---|---|---|---|---|---|---|---|---|---|---|---|---|---|---|---|---|---|---|---|---|---|---|---|---|---|---|---|---|---|---|---|---|---|---|---|---|---|---|---|---|---|---|---|---|---|---|---|---|---|---|---|---|---|---|---|---|---|---|---|---|---|---|---|---|---|---|---|---|---|---|---|---|---|---|---|---|---|---|---|---|---|---|---|---|---|---|---|---|---|---|---|---|---|---|---|---|---|---|---|---|---|---|---|---|---|---|---|---|---|---|---|---|---|---|---|---|---|---|---|---|---|---|---|---|---|---|---|---|---|---|---|---|---|---|---|---|---|---|---|---|---|---|---|---|---|---|---|---|---|---|---|---|---|---|---|---|---|---|---|---|---|---|---|---|---|---|---|---|---|---|---|---|---|---|---|---|---|---|---|---|---|---|---|---|---|---|---|---|---|---|---|---|---|---|---|---|---|---|---|---|---|---|---|---|---|---|---|---|---|---|---|---|---|---|---|---|---|---|---|---|---|---|---|---|---|---|---|---|---|---|---|---|---|---|---|---|---|---|---|---|---|---|---|---|---|---|---|---|---|---|---|---|---|---|---|---|---|---|---|---|---|---|---|---|---|---|---|---|---|---|---|---|---|---|---|---|---|---|---|---|---|---|---|---|---|---|---|---|---|---|---|---|---|---|---|---|---|---|---|---|---|---|---|---|---|---|---|---|---|---|---|---|---|---|---|---|---|---|---|---|---|---|---|---|---|---|---|---|---|---|---|---|---|---|---|---|---|---|---|---|---|---|---|---|---|---|---|---|---|---|
|
Donald Trump vs. Bernie Sanders
Donald Trump vs. Elizabeth Warren
Donald Trump vs. Michael Bloomberg
Donald Trump vs. Pete Buttigieg
Donald Trump vs. Andrew Yang
Donald Trump vs. Cory Booker
Donald Trump vs. Kamala Harris
Donald Trump vs. Beto O'Rourke
|
Hypothetical polling
| ||||||||||||||||||||||||||||||||||||||||||||||||||||||||||||||||||||||||||||||||||||||||||||||||||||||||||||||||||||
|---|---|---|---|---|---|---|---|---|---|---|---|---|---|---|---|---|---|---|---|---|---|---|---|---|---|---|---|---|---|---|---|---|---|---|---|---|---|---|---|---|---|---|---|---|---|---|---|---|---|---|---|---|---|---|---|---|---|---|---|---|---|---|---|---|---|---|---|---|---|---|---|---|---|---|---|---|---|---|---|---|---|---|---|---|---|---|---|---|---|---|---|---|---|---|---|---|---|---|---|---|---|---|---|---|---|---|---|---|---|---|---|---|---|---|---|---|
|
with Donald Trump, Bernie Sanders, and Howard Schultz
with Donald Trump, Elizabeth Warren, and Howard Schultz
with John Kasich and Joe Biden
with John Kasich and Elizabeth Warren
with Donald Trump and generic Democrat
with Donald Trump, generic Democrat, and generic third party
with Donald Trump and Generic Opponent
|
Results edit
| Party | Candidate | Votes | % | ±% | |
|---|---|---|---|---|---|
| Democratic | Joe Biden Kamala Harris |
424,937 | 52.78% | +5.16% | |
| Republican | Donald Trump Mike Pence |
365,660 | 45.42% | −1.83% | |
| Libertarian | Jo Jorgensen Spike Cohen |
13,236 | 1.64% | −2.49% | |
| Green | Howie Hawkins (write-in) Angela Walker (write-in) |
217 | 0.03% | −0.84% | |
| Independent | Bernie Sanders (write-in) | 192 | 0.02% | ||
| Republican | Mitt Romney (write-in) | 170 | 0.02% | ||
| Democratic | Tulsi Gabbard (write-in) | 142 | 0.02% | ||
| Independent | Kanye West (write-in) | 82 | 0.01% | ||
| Republican | John Kasich (write-in) | 67 | 0.01% | ||
| Democratic | Andrew Yang (write-in) | 58 | 0.01% | ||
| Republican | Mike Pence (write-in) | 56 | 0.01% | ||
| Democratic | Pete Buttigieg (write-in) | 47 | 0.01% | ||
| Republican | Chris Sununu (write-in) | 46 | 0.01% | ||
| Republican | Bill Weld (write-in) | 23 | 0.00% | ||
| Libertarian | Vermin Supreme (write-in) | 22 | 0.00% | ||
| Democratic | Amy Klobuchar (write-in) | 19 | 0.00% | ||
| Democratic | Andrew Cuomo (write-in) | 14 | 0.00% | ||
| Democratic | Jeanne Shaheen (write-in) | 14 | 0.00% | ||
| Libertarian | Ron Paul (write-in) | 13 | 0.00% | ||
| Republican | Condoleezza Rice (write-in) | 12 | 0.00% | ||
| Republican | Mike Huckabee (write-in) | 10 | 0.00% | ||
| Democratic | Michelle Obama (write-in) | 10 | 0.00% | ||
| American Solidarity | Brian T. Carroll (write-in) | <10 | 0.00% | ||
| Independent | Brock Pierce (write-in) | <10 | 0.00% | ||
| Independent | Albert Raley (write-in) | <10 | 0.00% | ||
| Independent | Jade Simmons (write-in) | <10 | 0.00% | ||
| Constitution | Sheila Tittle (write-in) | <10 | 0.00% | ||
| Total votes | 805,058 | 100.00% | |||
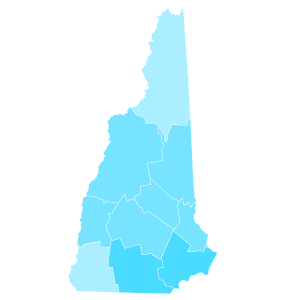
By county edit
| County | Joe Biden Democratic |
Donald Trump Republican |
Various candidates Other parties |
Margin | Total votes cast | ||||
|---|---|---|---|---|---|---|---|---|---|
| # | % | # | % | # | % | # | % | ||
| Belknap | 16,894 | 43.90% | 20,899 | 54.31% | 686 | 1.79% | -4,005 | -10.41% | 38,479 |
| Carroll | 16,649 | 50.00% | 16,150 | 48.50% | 498 | 1.50% | 499 | 1.50% | 33,297 |
| Cheshire | 25,522 | 57.52% | 17,898 | 40.34% | 950 | 2.14% | 7,624 | 17.18% | 44,370 |
| Coos | 7,640 | 46.18% | 8,617 | 52.09% | 287 | 1.73% | -977 | -5.91% | 16,544 |
| Grafton | 33,180 | 61.29% | 19,905 | 36.77% | 1,047 | 1.94% | 13,275 | 24.52% | 54,132 |
| Hillsborough | 122,344 | 52.81% | 104,625 | 45.16% | 4,690 | 2.03% | 17,719 | 7.65% | 231,659 |
| Merrimack | 48,533 | 53.85% | 39,711 | 44.06% | 1,889 | 2.09% | 8,822 | 9.79% | 90,133 |
| Rockingham | 100,064 | 50.20% | 95,858 | 48.09% | 3,420 | 1.71% | 4,206 | 2.11% | 199,342 |
| Strafford | 41,721 | 56.53% | 30,489 | 41.31% | 1,595 | 2.16% | 11,232 | 15.22% | 73,805 |
| Sullivan | 12,390 | 50.69% | 11,508 | 47.08% | 546 | 2.23% | 882 | 3.61% | 24,444 |
| Totals | 424,937 | 52.71% | 365,660 | 45.36% | 15,608 | 1.93% | 59,277 | 7.35% | 806,205 |


Counties that flipped from Republican to Democratic edit
- Carroll (largest municipality: Conway)
- Hillsborough (largest municipality: Manchester)
- Rockingham (largest municipality: Derry)
- Sullivan (largest municipality: Claremont)
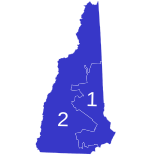
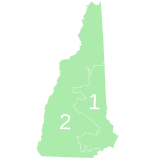
By congressional district edit
| District | Biden | Trump | Representative |
|---|---|---|---|
| 1st | 52.2% | 46.2% | Chris Pappas |
| 2nd | 53.5% | 44.8% | Annie Kuster |
Analysis edit
Biden flipped the counties of Carroll, Hillsborough, Rockingham, and Sullivan, of which Hillsborough (which houses the state's largest city of Manchester) and Sullivan had voted for Barack Obama twice before switching to Trump in 2016, then flipping back into the Democratic column in 2020. Biden also significantly expanded Hillary Clinton's 2016 lead of 2,736 votes (0.37%) to 59,267 votes (7.35%).
Edison exit polls edit
| 2020 presidential election in New Hampshire by demographic subgroup (Edison exit polling)[36][37] | |||
|---|---|---|---|
| Demographic subgroup | Biden | Trump | % of
total vote |
| Total vote | 52.71 | 45.36 | 100 |
| Ideology | |||
| Liberals | 93 | 7 | 24 |
| Moderates | 64 | 33 | 44 |
| Conservatives | 9 | 91 | 32 |
| Party | |||
| Democrats | 94 | 6 | 23 |
| Republicans | 10 | 90 | 31 |
| Independents | 62 | 35 | 46 |
| Gender | |||
| Men | 47 | 52 | 47 |
| Women | 58 | 40 | 53 |
| Race/ethnicity | |||
| White | 52 | 46 | 92 |
| Non-white | 56 | 41 | 8 |
| Age | |||
| 18–24 years old | 50 | 48 | 9 |
| 25–29 years old | 58 | 35 | 8 |
| 30–39 years old | 54 | 42 | 14 |
| 40–49 years old | 50 | 49 | 15 |
| 50–64 years old | 51 | 49 | 31 |
| 65 and older | 56 | 43 | 23 |
| Sexual orientation | |||
| LGBT | – | – | 7 |
| Not LGBT | 50 | 48 | 93 |
| Education | |||
| High school or less | 43 | 53 | 20 |
| Some college education | 45 | 54 | 26 |
| Associate's degree | 44 | 54 | 13 |
| Bachelor's degree | 63 | 36 | 25 |
| Postgraduate degree | 68 | 30 | 17 |
| Income | |||
| Under $30,000 | 71 | 28 | 12 |
| $30,000–49,999 | 45 | 51 | 18 |
| $50,000–99,999 | 54 | 44 | 30 |
| Over $100,000 | 53 | 46 | 40 |
| Issue regarded as most important | |||
| Racial inequality | 87 | 10 | 14 |
| Coronavirus | 95 | 5 | 21 |
| Economy | 12 | 87 | 33 |
| Crime and safety | 15 | 83 | 10 |
| Health care | 89 | 8 | 13 |
| Region | |||
| Seacoast | 60 | 38 | 17 |
| Manchester/Concord | 57 | 42 | 24 |
| Southwest/Connecticut Valley | 57 | 41 | 20 |
| Southeast | 44 | 54 | 21 |
| North | 47 | 52 | 18 |
| Area type | |||
| Urban | 67 | 31 | 9 |
| Suburban | 50 | 48 | 60 |
| Rural | 54 | 45 | 31 |
| Family's financial situation today | |||
| Better than four years ago | 19 | 80 | 43 |
| Worse than four years ago | 82 | 12 | 19 |
| About the same | 79 | 20 | 38 |
See also edit
Notes edit
- ^ Including 157 write-in votes
- ^ Calculated by taking the difference of 100% and all other candidates combined.
- ^ a b c d e f g h i j k l m n o p Key:
A – all adults
RV – registered voters
LV – likely voters
V – unclear - ^ Overlapping sample with the previous SurveyMonkey/Axios poll, but more information available regarding sample size
- ^ "Another candidate" with 1%
- ^ a b c "Another candidate" with 0%
- ^ "Refused" with 2%; "Other" with 1%
- ^ a b "Someone else" with 4%
- ^ a b With voters who lean towards a given candidate
- ^ "Someone else" with 2%
- ^ "Some other candidate" with 1%
- ^ Standard VI response
- ^ Hawkins (G) with 2%; "Another candidate" with 0%
- ^ With only Biden, Trump and "Another candidate" as options
- ^ "Someone else" and would not vote with 1%
- ^ Includes "Refused"
- ^ "Another candidate" with 4%
- ^ "Another candidate" with 6%
- ^ "Another candidate" with 5%
- ^ "Another candidate" with 8%
- ^ a b Data sourced from FiveThirtyEight
- ^ a b c d Data not yet released
- ^ "Someone else" with 9%
- ^ Would vote for a candidate other than Trump
- ^ Would not vote with 2%
- Partisan clients
- ^ The Center for American Greatness is a pro-Trump organization
References edit
- ^ DiStaso, John (November 6, 2020). "More than 73 percent of NH's voting age population cast ballots, resulting in record turnout". WMUR. Retrieved February 16, 2021.
- ^ Kelly, Ben (August 13, 2018). "US elections key dates: When are the 2018 midterms and the 2020 presidential campaign?". The Independent. Archived from the original on August 2, 2018. Retrieved January 3, 2019.
- ^ "Distribution of Electoral Votes". National Archives and Records Administration. Retrieved January 3, 2019.
- ^ a b "New Hampshire Voter Surveys: How Different Groups Voted". The New York Times. November 3, 2020. ISSN 0362-4331. Retrieved November 9, 2020.
- ^ "Republicans unexpectedly gain control of N.H. State government".
- ^ Alex Seitz-Wald (December 9, 2018). "2020 Democratic primary: California and Texas look to become the new Iowa and New Hampshire". NBC News. Retrieved December 10, 2018.
- ^ Steve Peoples; Kathleen Ronayne; Hunter Woodall (February 11, 2020). "President Trump wins GOP primary with more votes than any incumbent president in history". KRCR. Associated Press.
- ^ "2020 Presidential Primary - Republican Write-Ins - NHSOS". sos.nh.gov. Retrieved February 17, 2020.
- ^ "Content - NHSOS". sos.nh.gov. Retrieved February 17, 2020.
- ^ "Results: New Hampshire 2020 Presidential Primary - Democratic President". New Hampshire Secretary of State. Retrieved February 13, 2020.
- ^ "2020 Presidential Primary - Democratic". New Hampshire Secretary of State. March 23, 2020. Retrieved March 29, 2022.
- ^ a b c d e "2020 Presidential Primary - Democratic Write-Ins". New Hampshire Secretary of State. March 23, 2020. Retrieved March 29, 2022.
- ^ "Live Results: New Hampshire Primary". The New York Times. February 11, 2020. Archived from the original on February 14, 2020. Retrieved February 12, 2020.
- ^ "New Hampshire Democratic Delegation 2020". The Green Papers. March 31, 2019. Archived from the original on April 12, 2019. Retrieved April 12, 2019.
- ^ Marc Fortier (February 13, 2020). "Bloomberg Beat 2 Well-Known Democrats in the NH Primary. He Wasn't Even on the Ballot". NBC Boston (WBTS-CD). Retrieved February 13, 2020.
- ^ "Results – 2020 Libertarian Presidential Preference Primary". Libertarian Party of New Hampshire. January 14, 2020. Archived from the original on February 27, 2020. Retrieved January 14, 2020.
- ^ Dance, George J. (January 14, 2020). "Strange doings in New Hampshire". The Nolan Chart. Archived from the original on January 15, 2020. Retrieved January 14, 2020.
- ^ a b "Congrats to Vermin Supreme for winning the LPNH Presidential Preference Primary!". Libertarian Party of New Hampshire. January 11, 2020. Retrieved January 11, 2020 – via Facebook.com.
- ^ a b "Results – 2020 Libertarian Presidential Preference Primary". Libertarian Party of New Hampshire. January 14, 2020. Archived from the original on February 27, 2020. Retrieved January 15, 2020.
- ^ "2020 POTUS Race ratings" (PDF). The Cook Political Report. Retrieved May 21, 2019.
- ^ "POTUS Ratings | Inside Elections". insideelections.com. Retrieved May 21, 2019.
- ^ "Larry J. Sabato's Crystal Ball » 2020 President". crystalball.centerforpolitics.org. Retrieved May 21, 2019.
- ^ "2020 Election Forecast". Politico. November 19, 2019.
- ^ "Battle for White House". RCP. April 19, 2019.
- ^ 2020 Bitecofer Model Electoral College Predictions Archived April 23, 2020, at the Wayback Machine, Niskanen Center, March 24, 2020, retrieved: April 19, 2020.
- ^ David Chalian; Terence Burlij (June 11, 2020). "Road to 270: CNN's debut Electoral College map for 2020". CNN. Retrieved June 16, 2020.
- ^ "Forecasting the US elections". The Economist. Retrieved July 7, 2020.
- ^ "2020 Election Battleground Tracker". CBS News. July 12, 2020. Retrieved July 13, 2020.
- ^ "2020 Presidential Election Interactive Map". 270 to Win.
- ^ "ABC News Race Ratings". CBS News. July 24, 2020. Retrieved July 24, 2020.
- ^ Montanaro, Domenico (August 3, 2020). "2020 Electoral Map Ratings: Trump Slides, Biden Advantage Expands Over 270 Votes". NPR. Retrieved August 3, 2020.
- ^ "Biden dominates the electoral map, but here's how the race could tighten". NBC News. August 6, 2020. Retrieved August 6, 2020.
- ^ "2020 Election Forecast". FiveThirtyEight. August 12, 2020. Retrieved August 14, 2020.
- ^ "President and Vice-President of the United States - excel". sos.nh.gov/. Retrieved November 24, 2020.
- ^ "President Write-ins - pdf". sos.nh.gov/. Retrieved November 24, 2020.
- ^ "New Hampshire 2020 President exit polls". www.cnn.com. Retrieved December 28, 2020.
- ^ "New Hampshire Exit Polls: How Different Groups Voted". www.nytimes.com. Retrieved December 28, 2020.
Further reading edit
- Summary: State Laws on Presidential Electors (PDF), Washington, D.C.: National Association of Secretaries of State, August 2020,
New Hampshire
External links edit
- Government Documents Round Table of the American Library Association, "New Hampshire", Voting & Elections Toolkits
- "New Hampshire: Election Tools, Deadlines, Dates, Rules, and Links", Vote.org, Oakland, CA
- "League of Women Voters of New Hampshire". (state affiliate of the U.S. League of Women Voters)
- New Hampshire at Ballotpedia