


Summary
The 2020 United States presidential election in South Carolina was held on Tuesday, November 3, 2020, as part of the 2020 United States presidential election in which all 50 states plus the District of Columbia participated.[2] South Carolina voters chose electors to represent them in the Electoral College via a popular vote, pitting the Republican Party's nominee, incumbent President Donald Trump, and running mate Vice President Mike Pence against Democratic Party nominee, former Vice President Joe Biden, and his running mate California Senator Kamala Harris. South Carolina has nine electoral votes in the Electoral College.[3]
| ||||||||||||||||||||||||||
| Turnout | 72.1%[1] | |||||||||||||||||||||||||
|---|---|---|---|---|---|---|---|---|---|---|---|---|---|---|---|---|---|---|---|---|---|---|---|---|---|---|
| ||||||||||||||||||||||||||


| ||||||||||||||||||||||||||
| ||||||||||||||||||||||||||

Trump carried South Carolina by a margin of 11.68%, down from his 14.27% margin four years earlier. Prior to this election, all 12 news organizations considered this a state Trump would win, or a red state.
South Carolina was the only East Coast state in 2020 to vote Republican by a double-digit margin.[4] This was the first time that both main party candidates won more than one million votes in a statewide election in South Carolina, alongside the concurrent Senate election.
Primary elections edit
Canceled Republican primary edit
On September 7, 2019, the South Carolina Republican Party became one of several state GOP affiliates to cancel their respective primaries and caucuses officially.[5] Donald Trump's re-election campaign and GOP officials have cited the fact that Republicans canceled several state primaries when George H. W. Bush and George W. Bush sought second terms in 1992 and 2004, respectively, and Democrats scrapped some of their primaries when Bill Clinton and Barack Obama were seeking re-election in 1996 and 2012, respectively.[6][7]
In response to the cancellation, former U.S. Representative Bob Inglis and another South Carolina Republican voter filed a lawsuit against the South Carolina Republican Party on grounds that it denied their right to vote. On December 11, 2019, a state court judge dismissed the lawsuit, writing in his opinion that the law "does not give plaintiffs a legal right to presidential preference primary".[8] Thus at the South Carolina State Republican Convention in May 2020, the state party formally bound all 50 of its national pledged delegates to Trump.[9]
Democratic primary edit
The South Carolina Democratic primary was held on February 29, 2020.


Official results show that Joe Biden won the Democratic primary with 48.65% of the vote, with Bernie Sanders coming in second with 19.77%.[10][11][12]
| Candidate | Votes | % | Delegates[13] |
|---|---|---|---|
| Joe Biden | 262,336 | 48.65 | 39 |
| Bernie Sanders | 106,605 | 19.77 | 15 |
| Tom Steyer | 61,140 | 11.34 | |
| Pete Buttigieg | 44,217 | 8.20 | |
| Elizabeth Warren | 38,120 | 7.07 | |
| Amy Klobuchar | 16,900 | 3.13 | |
| Tulsi Gabbard | 6,813 | 1.26 | |
| Andrew Yang (withdrawn) | 1,069 | 0.20 | |
| Michael Bennet (withdrawn) | 765 | 0.14 | |
| Cory Booker (withdrawn) | 658 | 0.12 | |
| John Delaney (withdrawn) | 352 | 0.07 | |
| Deval Patrick (withdrawn) | 288 | 0.05 | |
| Total | 539,263 | 100% | 54 |
General election edit
Predictions edit
| Source | Ranking | As of |
|---|---|---|
| The Cook Political Report[14] | Likely R | September 10, 2020 |
| Inside Elections[15] | Likely R | September 4, 2020 |
| Sabato's Crystal Ball[16] | Likely R | July 14, 2020 |
| Politico[17] | Safe R | September 8, 2020 |
| RCP[18] | Lean R | August 3, 2020 |
| Niskanen[19] | Safe R | July 26, 2020 |
| CNN[20] | Safe R | August 3, 2020 |
| The Economist[21] | Likely R | September 2, 2020 |
| CBS News[22] | Likely R | August 16, 2020 |
| 270towin[23] | Likely R | August 2, 2020 |
| ABC News[24] | Safe R | July 31, 2020 |
| NPR[25] | Likely R | August 3, 2020 |
| NBC News[26] | Likely R | August 6, 2020 |
| 538[27] | Likely R | September 9, 2020 |
Polling edit
Graphical summary
Aggregate polls
| Source of poll aggregation |
Dates administered |
Dates updated |
Joe Biden Democratic |
Donald Trump Republican |
Other/ Undecided [a] |
Margin |
|---|---|---|---|---|---|---|
| 270 to Win | October 15, 2020 – November 2, 2020 | November 3, 2020 | 43.3% | 50.3% | 6.4% | Trump +7.0 |
| FiveThirtyEight | until November 2, 2020 | November 3, 2020 | 44.5% | 51.6% | 3.9% | Trump +7.1 |
| Average | 43.9% | 51.0% | 5.1% | Trump +7.1 | ||
Polls
| Poll source | Date(s) administered |
Sample size[b] |
Margin of error |
Donald Trump Republican |
Joe Biden Democratic |
Jo Jorgensen Libertarian |
Howie Hawkins Green |
Other | Undecided |
|---|---|---|---|---|---|---|---|---|---|
| Optimus | Oct 31 – Nov 2, 2020 | 817 (LV) | ± 3.9% | 51% | 39% | – | – | 2%[c] | 8% |
| SurveyMonkey/Axios | Oct 20 – Nov 2, 2020 | 2,485 (LV) | ± 3% | 56%[d] | 42% | – | – | – | – |
| Data For Progress | Oct 27 – Nov 1, 2020 | 1,121 (LV) | ± 2.9% | 53% | 44% | 2% | 0% | 0%[e] | – |
| Swayable Archived November 27, 2020, at the Wayback Machine | Oct 23 – Nov 1, 2020 | 426 (LV) | ± 7.4% | 50% | 49% | 1% | 0% | – | – |
| Morning Consult | Oct 22–31, 2020 | 904 (LV) | ± 3% | 51% | 45% | – | – | – | – |
| SurveyMonkey/Axios | Oct 1–28, 2020 | 4,725 (LV) | – | 54% | 44% | – | – | – | – |
| Data for Progress | Oct 22–27, 2020 | 1,196 (LV) | ± 2.8% | 50% | 44% | 1% | 0% | – | 4% |
| Starboard Communications | Oct 26, 2020 | 800 (LV) | – | 51% | 44% | – | – | – | 5% |
| East Carolina University | Oct 24–25, 2020 | 763 (LV) | ± 4.1% | 52% | 44% | – | – | 3%[f] | 1% |
| Morning Consult | Oct 11–20, 2020 | 926 (LV) | ± 3.2% | 51% | 45% | – | – | – | – |
| New York Times/Siena College Archived October 15, 2020, at the Wayback Machine[1] | Oct 9–14, 2020 | 605 (LV) | ± 4.5% | 49% | 41% | 2% | 1% | 1%[g] | 6%[h] |
| Data for Progress | Oct 8–11, 2020 | 801 (LV) | ± 3.5% | 52% | 43% | 1% | 1% | – | 4% |
| Morning Consult | Oct 2–11, 2020 | 903 (LV) | ± 3% | 54% | 42% | – | – | – | – |
| SurveyMonkey/Axios | Sep 1–30, 2020 | 1,833 (LV) | – | 53% | 45% | – | – | – | 2% |
| GBAO Strategies/DSCC[A] | Sep 24–28, 2020 | 800 (LV) | ± 3.5% | 49% | 44% | – | – | – | – |
| Data for Progress (D) | Sep 23–28, 2020 | 824 (LV) | ± 3.4% | 47%[i] | 43% | 1% | 1% | – | 8% |
| 50%[j] | 45% | – | – | – | 5% | ||||
| Quinnipiac University | Sep 23–27, 2020 | 1,123 (LV) | ± 2.9% | 48% | 47% | – | – | 1%[k] | 4% |
| YouGov/CBS | Sep 22–25, 2020 | 1,080 (LV) | ± 3.8% | 52% | 42% | – | – | 2%[l] | 4% |
| Morning Consult | Sep 11–20, 2020 | 764 (LV) | ± (3% – 4%) | 50%[m] | 44% | – | – | – | – |
| Quinnipiac University | Sep 10–14, 2020 | 969 (LV) | ± 3.2% | 51% | 45% | – | – | 0%[n] | 4% |
| Morning Consult | Sep 2–11, 2020 | ~764 (LV) | ± (3%–4%) | 51% | 44% | – | – | – | – |
| Morning Consult | Aug 23 – Sep 1, 2020 | ~764 (LV) | ± (3%–4%) | 52% | 42% | – | – | – | – |
| SurveyMonkey/Axios | Aug 1–31, 2020 | 1,326 (LV) | – | 53% | 45% | – | – | – | 2% |
| Morning Consult | Aug 13–22, 2020 | ~764 (LV) | ± (3%–4%) | 51% | 43% | – | – | – | – |
| Morning Consult | Aug 3–12, 2020 | ~764 (LV) | ± (3%–4%) | 50% | 43% | – | – | – | – |
| Quinnipiac University Archived August 7, 2020, at the Wayback Machine | Jul 30 – Aug 3, 2020 | 914 (RV) | ± 3.2% | 47% | 42% | – | – | 4%[o] | 7% |
| Morning Consult | Jul 24 – Aug 2, 2020 | 741 (LV) | ± 4.0% | 49%[p] | 44% | – | – | 3%[q] | 4% |
| Morning Consult | Jul 23 – Aug 1, 2020 | ~764 (LV) | ± (3%–4%) | 48% | 45% | – | – | – | – |
| SurveyMonkey/Axios | Jul 1–31, 2020 | 1,700 (LV) | – | 53% | 44% | – | – | – | 2% |
| Morning Consult | Jul 13–22, 2020 | ~764 (LV) | ± (3%–4%) | 50% | 43% | – | – | – | – |
| ALG Research/Lindsey Must Go Archived July 28, 2020, at the Wayback Machine[B] | Jul 15–20, 2020 | 591 (LV) | – | 50% | 45% | – | – | 1% | 4% |
| Gravis Marketing[2] | Jul 17, 2020 | 604 (LV) | ± 4.0% | 50% | 46% | – | – | – | – |
| brilliant corners Research & Strategies/Jaime Harrison[C] | Jul 13–19, 2020 | 800 (LV) | ± 3.5% | 50% | 43% | – | – | – | – |
| SurveyMonkey/Axios | Jun 8–30, 2020 | 863 (LV) | – | 52% | 47% | – | – | – | 2% |
| Civiqs/Daily Kos | May 23–26, 2020 | 591 (RV) | ± 4.5% | 52% | 42% | – | – | 5%[r] | 1% |
| AtlasIntel | Feb 25–28, 2020 | 1,100 (RV) | ± 3.0% | 48% | 42% | – | – | 11% | – |
| East Carolina University | Jan 31 – Feb 2, 2020 | 1,756 (RV) | ± 2.7% | 52% | 40% | – | – | – | 8% |
| Change Research | Jun 11–14, 2019 | 2,312 (RV) | ± 2.0% | 54% | 38% | 3%[s] | 1%[s] | – | – |
| Emerson College Archived April 27, 2019, at the Wayback Machine | Feb 28 – Mar 2, 2019 | 755 (RV) | ± 3.5% | 52% | 48% | – | – | – | – |
Former candidates
| ||||||||||||||||||||||||||||||||||||||||||||||||||||||||||||||||||||||||||||||||||||||||||||||||||||||||||||||||||||||||||||||||||||||||||||||||||||||||||||||||||||||||||||||||||||||||||||||||||||||||||||||||||||||
|---|---|---|---|---|---|---|---|---|---|---|---|---|---|---|---|---|---|---|---|---|---|---|---|---|---|---|---|---|---|---|---|---|---|---|---|---|---|---|---|---|---|---|---|---|---|---|---|---|---|---|---|---|---|---|---|---|---|---|---|---|---|---|---|---|---|---|---|---|---|---|---|---|---|---|---|---|---|---|---|---|---|---|---|---|---|---|---|---|---|---|---|---|---|---|---|---|---|---|---|---|---|---|---|---|---|---|---|---|---|---|---|---|---|---|---|---|---|---|---|---|---|---|---|---|---|---|---|---|---|---|---|---|---|---|---|---|---|---|---|---|---|---|---|---|---|---|---|---|---|---|---|---|---|---|---|---|---|---|---|---|---|---|---|---|---|---|---|---|---|---|---|---|---|---|---|---|---|---|---|---|---|---|---|---|---|---|---|---|---|---|---|---|---|---|---|---|---|---|---|---|---|---|---|---|---|---|---|---|---|---|---|---|---|---|
|
Donald Trump vs. Bernie Sanders
Donald Trump vs. Elizabeth Warren
Donald Trump vs. Michael Bloomberg
Donald Trump vs. Amy Klobuchar
Donald Trump vs. Pete Buttigieg
Donald Trump vs. Tom Steyer
Donald Trump vs. Andrew Yang
Donald Trump vs. Cory Booker
Donald Trump vs Kamala Harris
Donald Trump vs. Beto O'Rourke
|
Hypothetical polling
| ||||||||||||||||||||||||||||||||||||||||||||||||
|---|---|---|---|---|---|---|---|---|---|---|---|---|---|---|---|---|---|---|---|---|---|---|---|---|---|---|---|---|---|---|---|---|---|---|---|---|---|---|---|---|---|---|---|---|---|---|---|---|
|
with Donald Trump, Bernie Sanders, and Howard Schultz
with Donald Trump, Elizabeth Warren, and Howard Schultz
with Donald Trump, generic Democrat, and Howard Schultz
|
Results edit
| Party | Candidate | Votes | % | ±% | |
|---|---|---|---|---|---|
| Republican | Donald Trump (incumbent) Mike Pence (incumbent) |
1,385,103 | 55.11% | +0.17% | |
| Democratic | Joe Biden Kamala Harris |
1,091,541 | 43.43% | +2.76% | |
| Libertarian | Jo Jorgensen Spike Cohen |
27,916 | 1.11% | −1.23% | |
| Green | Howie Hawkins Angela Walker |
6,907 | 0.27% | −0.35% | |
| Alliance | Rocky De La Fuente Darcy Richardson |
1,862 | 0.07% | N/A | |
| Write-in | |||||
| Total votes | 2,513,329 | 100.00% | |||
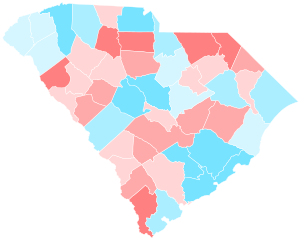
Results by county edit
| County | Donald Trump Republican |
Joe Biden Democratic |
Various candidates Other parties |
Margin | Total | ||||
|---|---|---|---|---|---|---|---|---|---|
| # | % | # | % | # | % | # | % | ||
| Abbeville | 8,215 | 66.07% | 4,101 | 32.98% | 117 | 0.95% | 4,114 | 33.09% | 12,433 |
| Aiken | 51,589 | 60.56% | 32,275 | 37.89% | 1,321 | 1.55% | 19,314 | 22.67% | 85,185 |
| Allendale | 835 | 23.24% | 2,718 | 75.65% | 40 | 1.11% | -1,883 | -52.41% | 3,593 |
| Anderson | 67,565 | 70.31% | 27,169 | 28.27% | 1,359 | 1.42% | 40,396 | 42.04% | 96,093 |
| Bamberg | 2,417 | 37.29% | 4,010 | 61.86% | 55 | 0.85% | -1,593 | -24.57% | 6,482 |
| Barnwell | 5,492 | 53.21% | 4,720 | 45.73% | 109 | 1.06% | 772 | 7.48% | 10,321 |
| Beaufort | 53,194 | 54.37% | 43,419 | 44.38% | 1,222 | 1.25% | 9,775 | 9.99% | 97,835 |
| Berkeley | 57,397 | 54.95% | 45,223 | 43.29% | 1,838 | 1.76% | 12,174 | 11.66% | 104,458 |
| Calhoun | 4,305 | 51.92% | 3,905 | 47.10% | 81 | 0.98% | 400 | 4.82% | 8,291 |
| Charleston | 93,297 | 42.63% | 121,485 | 55.51% | 4,075 | 1.86% | -28,188 | -12.88% | 218,857 |
| Cherokee | 18,043 | 71.40% | 6,983 | 27.63% | 244 | 0.97% | 11,060 | 43.77% | 25,270 |
| Chester | 8,660 | 54.96% | 6,941 | 44.05% | 156 | 0.99% | 1,719 | 10.91% | 15,757 |
| Chesterfield | 11,297 | 59.85% | 7,431 | 39.37% | 148 | 0.78% | 3,866 | 20.48% | 18,876 |
| Clarendon | 8,361 | 49.97% | 8,250 | 49.30% | 112 | 0.73% | 111 | 0.67% | 16,733 |
| Colleton | 10,440 | 54.14% | 8,602 | 44.61% | 241 | 1.25% | 1,838 | 9.53% | 19,283 |
| Darlington | 16,832 | 51.92% | 15,220 | 46.95% | 365 | 1.13% | 1,612 | 4.97% | 32,417 |
| Dillon | 6,582 | 50.24% | 6,436 | 49.13% | 83 | 0.63% | 146 | 1.11% | 13,101 |
| Dorchester | 41,913 | 54.24% | 33,824 | 43.77% | 1,541 | 1.99% | 8,089 | 10.47% | 77,278 |
| Edgefield | 8,184 | 61.52% | 4,953 | 37.23% | 167 | 1.25% | 3,231 | 24.29% | 13,304 |
| Fairfield | 4,625 | 38.11% | 7,382 | 60.83% | 129 | 1.06% | -2,757 | -22.72% | 12,136 |
| Florence | 32,615 | 50.56% | 31,153 | 48.29% | 742 | 1.15% | 1,462 | 2.27% | 64,510 |
| Georgetown | 20,487 | 55.87% | 15,822 | 43.15% | 359 | 0.98% | 4,665 | 12.72% | 36,668 |
| Greenville | 150,021 | 58.11% | 103,030 | 39.91% | 5,104 | 1.98% | 46,991 | 18.20% | 258,155 |
| Greenwood | 19,431 | 60.71% | 12,145 | 37.95% | 430 | 1.34% | 7,286 | 22.76% | 32,006 |
| Hampton | 3,906 | 41.98% | 5,323 | 57.21% | 76 | 0.81% | -1,417 | -15.23% | 9,305 |
| Horry | 118,821 | 66.11% | 59,180 | 32.92% | 1,743 | 0.97% | 59,641 | 33.19% | 179,744 |
| Jasper | 7,078 | 49.17% | 7,185 | 49.92% | 131 | 0.91% | -107 | -0.75% | 14,394 |
| Kershaw | 20,471 | 60.87% | 12,699 | 37.76% | 459 | 1.37% | 7,772 | 23.11% | 33,629 |
| Lancaster | 30,312 | 60.78% | 18,937 | 37.97% | 619 | 1.25% | 11,375 | 22.81% | 49,868 |
| Laurens | 20,004 | 65.61% | 10,159 | 33.32% | 325 | 1.07% | 9,845 | 32.29% | 30,488 |
| Lee | 3,008 | 35.68% | 5,329 | 63.21% | 94 | 1.11% | -2,321 | -27.53% | 8,431 |
| Lexington | 92,817 | 64.20% | 49,301 | 34.10% | 2,450 | 1.70% | 43,516 | 30.10% | 144,568 |
| Marion | 5,711 | 38.84% | 8,872 | 60.34% | 121 | 0.82% | -3,161 | -21.50% | 14,704 |
| Marlboro | 5,044 | 44.07% | 6,290 | 54.95% | 112 | 0.98% | -1,246 | -10.88% | 11,446 |
| McCormick | 2,958 | 51.92% | 2,687 | 47.17% | 52 | 0.91% | 271 | 4.75% | 5,697 |
| Newberry | 11,443 | 61.42% | 6,958 | 37.35% | 230 | 1.23% | 4,485 | 24.07% | 18,631 |
| Oconee | 29,698 | 73.03% | 10,414 | 25.61% | 556 | 1.36% | 19,284 | 47.42% | 40,668 |
| Orangeburg | 13,603 | 33.01% | 27,295 | 66.24% | 307 | 0.75% | -13,692 | -33.23% | 41,205 |
| Pickens | 42,907 | 74.56% | 13,645 | 23.71% | 994 | 1.73% | 29,262 | 50.85% | 57,546 |
| Richland | 58,313 | 30.09% | 132,570 | 68.40% | 2,939 | 1.51% | -74,257 | -38.31% | 193,822 |
| Saluda | 6,210 | 66.96% | 2,963 | 31.95% | 101 | 1.09% | 3,247 | 35.01% | 9,274 |
| Spartanburg | 93,560 | 62.94% | 52,926 | 35.60% | 2,169 | 1.46% | 40,634 | 27.34% | 148,655 |
| Sumter | 21,000 | 42.93% | 27,379 | 55.97% | 541 | 1.10% | -6,379 | -13.04% | 48,920 |
| Union | 8,183 | 61.73% | 4,935 | 37.23% | 139 | 1.04% | 3,248 | 24.50% | 13,257 |
| Williamsburg | 5,532 | 34.61% | 10,289 | 64.37% | 164 | 1.02% | -4,757 | -29.76% | 15,985 |
| York | 82,727 | 57.43% | 59,008 | 40.96% | 2,315 | 1.61% | 23,719 | 16.47% | 144,050 |
| Totals | 1,385,103 | 55.11% | 1,091,541 | 43.43% | 36,685 | 1.46% | 293,562 | 11.68% | 2,513,329 |


Counties that flipped from Democratic to Republican edit
Results by congressional district edit
Trump won 6 of the 7 congressional districts.
| District | Trump | Biden | Representative |
|---|---|---|---|
| 1st | 52.1% | 46.1% | Joe Cunningham |
| Nancy Mace | |||
| 2nd | 54.9% | 43.6% | Joe Wilson |
| 3rd | 68.1% | 30.5% | Jeff Duncan |
| 4th | 59.3% | 38.9% | William Timmons |
| 5th | 57.6% | 41% | Ralph Norman |
| 6th | 31.8% | 67% | Jim Clyburn |
| 7th | 58.8% | 40.2% | Tom Rice |
Analysis edit
South Carolina—a Deep Southern Bible Belt state that was once part of the Democratic Solid South—has had a Republican tendency since 1964. Since its narrow vote for Kennedy in 1960, it has voted Democratic only in 1976, for Jimmy Carter, the former governor of the neighboring state of Georgia. Accordingly, it has long been the most conservative state on the East Coast of the United States,[29] although it has not been as conservative as its fellow Deep South states of Alabama, Mississippi, and Louisiana, largely due to populous and fast-growing Charleston and Richland Counties' trending more Democratic in the 21st century. As in the case of other Deep Southern states, South Carolina also has a large African-American population[30] that helps keep the state somewhat more competitive than much of the Upper South. (The final state in the Deep South, Georgia, has become much more competitive than any of its fellow Deep South states in recent years due to the explosive growth of the Atlanta area.)
Trump performed somewhat better than polls anticipated, as aggregate polls averaged him only 7 points ahead of Biden.[31] He flipped Clarendon County for the first time since 1972 and Dillon County for the first time since 1988. Biden became the first Democrat since Lyndon B. Johnson in 1964 to win the presidency without Clarendon, Calhoun, Colleton, and McCormick counties and the first Democrat since Harry S. Truman to win without Dillon and Chester counties.
Per exit polls by the Associated Press, Trump's strength in the Palmetto State came from White, born-again/Evangelical Christians, who supported Trump by 87%–90%. South Carolina is entirely in the Bible Belt. As is the case in many Southern states, there was a stark racial divide in voting for this election: White South Carolinians supported Trump by 69%–29%, while Black South Carolinians supported Biden by 92%–7%.[32]
In other elections, longtime Republican U.S. Senator Lindsey Graham won another term in the United States Senate by 10.27 percentage points over Democrat Jaime Harrison. While Harrison lost by a double-digit margin, he still slightly outperformed Biden.
Edison exit polls edit
| 2020 presidential election in South Carolina by demographic subgroup (Edison exit polling)[33][34] | |||
|---|---|---|---|
| Demographic subgroup | Biden | Trump | % of
total vote |
| Total vote | 43.43 | 55.11 | 100 |
| Ideology | |||
| Liberals | 92 | 7 | 15 |
| Moderates | 56 | 42 | 38 |
| Conservatives | 14 | 85 | 47 |
| Party | |||
| Democrats | 96 | 4 | 30 |
| Republicans | 4 | 95 | 41 |
| Independents | 46 | 50 | 29 |
| Gender | |||
| Men | 41 | 57 | 45 |
| Women | 45 | 53 | 55 |
| Race/ethnicity | |||
| White | 26 | 73 | 66 |
| Black | 90 | 7 | 26 |
| Latino | – | – | 5 |
| Asian | – | – | 0 |
| Other | – | – | 3 |
| Age | |||
| 18–24 years old | 53 | 42 | 9 |
| 25–29 years old | 30 | 68 | 6 |
| 30–39 years old | 50 | 47 | 12 |
| 40–49 years old | 53 | 46 | 18 |
| 50–64 years old | 38 | 61 | 28 |
| 65 and older | 40 | 60 | 27 |
| Sexual orientation | |||
| LGBT | – | – | 5 |
| Not LGBT | 40 | 59 | 95 |
| Education | |||
| High school or less | 46 | 53 | 22 |
| Some college education | 46 | 53 | 25 |
| Associate's degree | 36 | 63 | 17 |
| Bachelor's degree | 43 | 55 | 23 |
| Postgraduate degree | 43 | 56 | 14 |
| Income | |||
| Under $30,000 | 62 | 38 | 23 |
| $30,000–49,999 | 42 | 56 | 18 |
| $50,000–99,999 | 47 | 51 | 31 |
| Over $100,000 | 34 | 64 | 30 |
| Issue regarded as most important | |||
| Racial inequality | 88 | 10 | 15 |
| Coronavirus | 89 | 10 | 16 |
| Economy | 11 | 87 | 36 |
| Crime and safety | 16 | 84 | 14 |
| Health care | – | – | 11 |
| Region | |||
| Upcountry | 32 | 66 | 25 |
| Piedmont | 41 | 57 | 14 |
| Central | 52 | 46 | 24 |
| Pee Dee/Waccamaw | 43 | 57 | 15 |
| Low Country | 49 | 50 | 21 |
| Area type | |||
| Urban | 55 | 43 | 14 |
| Suburban | 40 | 58 | 49 |
| Rural | 43 | 56 | 37 |
| Family's financial situation today | |||
| Better than four years ago | 15 | 84 | 49 |
| Worse than four years ago | 88 | 12 | 17 |
| About the same | 65 | 31 | 32 |
See also edit
Notes edit
- Partisan clients
- ^ The DSCC endorsed Jaime Harrison's campaign for the 2020 US Senate election in South Carolina before this poll's sampling period
- ^ This poll's sponsor, Lindsey Must Go, is a PAC opposing Lindsey Graham
- ^ This poll was sponsored by Harrison's campaign
- ^ Poll sponsored by Conservatives for Clean Energy
- Additional candidates
- ^ Calculated by taking the difference of 100% and all other candidates combined.
- ^ a b c d e f g h i j k l m n Key:
A – all adults
RV – registered voters
LV – likely voters
V – unclear - ^ "Refused" and "Third party candidate" with 1%
- ^ Overlapping sample with the previous SurveyMonkey/Axios poll, but more information available regarding sample size
- ^ "Other candidate/write-in" with 0%
- ^ "Refused" with 2%; "Some other candidate" with 1%; Did/would not vote with 0%
- ^ would not vote with 1%; "Someone else" with 0%
- ^ Includes "Refused"
- ^ Standard VI response
- ^ If the only candidates were Biden and Trump
- ^ "Someone else" with 1%
- ^ "Someone else/third party" with 2%
- ^ Overlapping sample with the previous Morning Consult poll, but more information available regarding sample size
- ^ "Someone else" with 0%
- ^ "Someone else" and would not vote with 2%
- ^ Overlapping sample with the previous Morning Consult poll, but more information available regarding sample size and topline numbers
- ^ "Someone else" with 3%
- ^ "Someone else" with 5%
- ^ a b Generic
- ^ a b c Generic Libertarian with 4%; generic Green with 2%
References edit
- ^ "Turnout". Retrieved November 11, 2020.
- ^ Kelly, Ben (August 13, 2018). "US elections key dates: When are the 2018 midterms and the 2020 presidential campaign?". The Independent. Archived from the original on August 2, 2018. Retrieved January 3, 2019.
- ^ "Distribution of Electoral Votes". National Archives and Records Administration. Retrieved January 3, 2019.
- ^ "Real Time Live Presidential Election Results".
- ^ Kinnard, Meg (September 7, 2019). "Nevada, SC, Kansas GOP drop presidential nomination votes". AP NEWS.
- ^ Karni, Annie (September 6, 2019). "GOP plans to drop presidential primaries in 4 states to impede Trump challengers". Boston Globe. MSN. Retrieved September 7, 2019.
- ^ Steakin, Will; Karson, Kendall (September 6, 2019). "GOP considers canceling at least 3 GOP primaries and caucuses, Trump challengers outraged". ABC News. Retrieved September 7, 2019.
- ^ Neidig, Harper (December 11, 2019). "Judge throws out lawsuit against South Carolina GOP for canceling 2020 primary". The Hill.
- ^ "South Carolina Republican Delegation 2020". The Green Papers. Retrieved February 20, 2020.
- ^ a b "2020 Democratic Presidential Preference Primary Election Night Reporting: Official Results". SCVotes.org. March 2, 2020. Retrieved March 2, 2020.
- ^ Peoples, Steve; Kinnard, Meg; Barrow, Bill (February 29, 2020). "Biden wins South Carolina, hopes for Super Tuesday momentum". Associated Press. Archived from the original on February 29, 2020. Retrieved February 29, 2020.
- ^ "South Carolina 2020 Primary: Live Results". The New York Times. February 29, 2020. Retrieved February 29, 2020.
- ^ "Delegate Tracker". interactives.ap.org. Associated Press. Retrieved November 24, 2022.
- ^ "2020 POTUS Race ratings" (PDF). The Cook Political Report. Retrieved May 21, 2019.
- ^ "POTUS Ratings | Inside Elections". insideelections.com. Retrieved May 21, 2019.
- ^ "Larry J. Sabato's Crystal Ball » 2020 President". crystalball.centerforpolitics.org. Retrieved May 21, 2019.
- ^ "2020 Election Forecast". Politico. November 19, 2019.
- ^ "Battle for White House". RCP. April 19, 2019.
- ^ 2020 Bitecofer Model Electoral College Predictions Archived April 23, 2020, at the Wayback Machine, Niskanen Center, March 24, 2020, retrieved: April 19, 2020
- ^ David Chalian; Terence Burlij (June 11, 2020). "Road to 270: CNN's debut Electoral College map for 2020". CNN. Retrieved June 16, 2020.
- ^ "Forecasting the US elections". The Economist. Retrieved July 7, 2020.
- ^ "2020 Election Battleground Tracker". CBS News. July 12, 2020. Retrieved July 13, 2020.
- ^ "2020 Presidential Election Interactive Map". 270 to Win.
- ^ "ABC News Race Ratings". CBS News. July 24, 2020. Retrieved July 24, 2020.
- ^ Montanaro, Domenico (August 3, 2020). "2020 Electoral Map Ratings: Trump Slides, Biden Advantage Expands Over 270 Votes". NPR.org. Retrieved August 3, 2020.
- ^ "Biden dominates the electoral map, but here's how the race could tighten". NBC News. August 6, 2020. Retrieved August 6, 2020.
- ^ "2020 Election Forecast". FiveThirtyEight. August 12, 2020. Retrieved August 14, 2020.
- ^ "2020 Statewide General Election Election Night Reporting". enr-scvotes.org/. Retrieved November 11, 2020.
- ^ "Dave Leip's Atlas of U.S. Presidential Elections".
- ^ "South Carolina Population 2020/2021". www.populationu.com. Retrieved August 31, 2021.
- ^ "South Carolina 2020 Presidential Election Polls: Biden vs. Trump".
- ^ "South Carolina Voter Surveys: How Different Groups Voted". The New York Times. November 3, 2020. ISSN 0362-4331. Retrieved November 17, 2020.
- ^ "South Carolina 2020 President exit polls". www.cnn.com. Retrieved December 28, 2020.
- ^ "South Carolina Exit Polls: How Different Groups Voted". www.nytimes.com. Retrieved December 28, 2020.
External links edit
- Government Documents Round Table of the American Library Association, "South Carolina", Voting & Elections Toolkits
- "South Carolina: Election Tools, Deadlines, Dates, Rules, and Links", Vote.org, Oakland, CA
- "League of Women Voters of South Carolina". (State affiliate of the U.S. League of Women Voters)
- South Carolina at Ballotpedia