


Summary
The 2020 United States presidential election in South Dakota was held on Tuesday, November 3, 2020, as part of the 2020 United States presidential election in which all 50 states plus the District of Columbia participated.[2] South Dakota voters chose electors to represent them in the Electoral College via a popular vote, pitting the Republican Party's nominee, incumbent President Donald Trump, and running mate Vice President Mike Pence against Democratic Party nominee, former Vice President Joe Biden, and his running mate California Senator Kamala Harris. South Dakota has three electoral votes in the Electoral College.[3]
| ||||||||||||||||||||||||||
| Turnout | 73.88%[1] | |||||||||||||||||||||||||
|---|---|---|---|---|---|---|---|---|---|---|---|---|---|---|---|---|---|---|---|---|---|---|---|---|---|---|
| ||||||||||||||||||||||||||


| ||||||||||||||||||||||||||
| ||||||||||||||||||||||||||

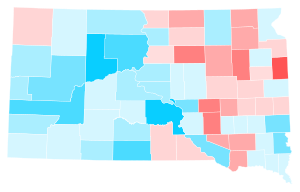
Trump carried South Dakota by 61.8%–35.6%, or a margin of 26.2%. Biden performed four points better than Hillary Clinton in 2016. Prior to the election, all 12 news organizations considered this a state Trump would win, or a safe red state. This was Libertarian Jo Jorgensen’s best state, with 2.63% of the vote.
Primary elections edit
The primary elections were held on June 2, 2020.
Republican primary edit
Donald Trump ran unopposed in the Republican primary, and thus received all of the state's 29 delegates to the 2020 Republican National Convention.[4]
Democratic primary edit
| Candidate | Votes | % | Delegates[6] |
|---|---|---|---|
| Joe Biden | 40,800 | 77.48 | 13 |
| Bernie Sanders (withdrawn) | 11,861 | 22.52 | 3 |
| Total | 52,661 | 100% | 16 |
Libertarian nominee edit
Prior to the South Dakota primaries, the 2020 Libertarian National Convention was held on May 22–24, 2020, selecting Jo Jorgensen, Psychology Senior Lecturer at Clemson University, as their presidential nominee.
General election edit
Final predictions edit
| Source | Ranking |
|---|---|
| The Cook Political Report[7] | Solid R |
| Inside Elections[8] | Solid R |
| Sabato's Crystal Ball[9] | Safe R |
| Politico[10] | Solid R |
| RCP[11] | Solid R |
| Niskanen[12] | Safe R |
| CNN[13] | Solid R |
| The Economist[14] | Safe R |
| CBS News[15] | Likely R |
| 270towin[16] | Safe R |
| ABC News[17] | Solid R |
| NPR[18] | Likely R |
| NBC News[19] | Solid R |
| 538[20] | Solid R |
Polling edit
Graphical summary edit
Aggregate polls
| Source of poll aggregation |
Dates administered |
Dates updated |
Joe Biden Democratic |
Donald Trump Republican |
Other/ Undecided [a] |
Margin |
|---|---|---|---|---|---|---|
| 270 to Win | October 17–25 , 2020 | November 3, 2020 | 42.0% | 52.5% | 5.5% | Trump +10.5 |
| FiveThirtyEight | until November 2, 2020 | November 3, 2020 | 39.0% | 54.5% | 6.5% | Trump +15.4 |
| Average | 40.5% | 53.5% | 6.0% | Trump +13.0 | ||
Polls
| Poll source | Date(s) administered |
Sample size[b] |
Margin of error |
Donald Trump Republican |
Joe Biden Democratic |
Jo Jorgensen Libertarian |
Other | Undecided |
|---|---|---|---|---|---|---|---|---|
| SurveyMonkey/Axios | Oct 20 – Nov 2, 2020 | 606 (LV) | ± 5.5% | 63%[c] | 36% | – | – | – |
| Nielson Brothers Polling | Oct 24–28, 2020 | 484 (LV) | ± 4.45% | 55% | 40% | 3% | – | 2% |
| SurveyMonkey/Axios | Oct 1–28, 2020 | 1,098 (LV) | – | 57% | 41% | – | – | – |
| Mason-Dixon | Oct 19–21, 2020 | 625 (LV) | ± 4% | 51% | 40% | – | 3% | 6% |
| SurveyMonkey/Axios | Sep 1–30, 2020 | 354 (LV) | – | 58% | 41% | – | – | 1% |
| SurveyMonkey/Axios | Aug 1–31, 2020 | 277 (LV) | – | 59% | 38% | – | – | 3% |
| SurveyMonkey/Axios | Jul 1–31, 2020 | 396 (LV) | – | 62% | 35% | – | – | 2% |
| SurveyMonkey/Axios | Jun 8–30, 2020 | 160 (LV) | – | 61% | 37% | – | – | 2% |
Electoral slates edit
These slates of electors were nominated by each party in order to vote in the Electoral College should their candidate win the state:[21]
| Donald Trump and Mike Pence Republican Party |
Joe Biden and Kamala Harris Democratic Party |
Jo Jorgensen and Spike Cohen Libertarian Party |
|---|---|---|
| Kristi Noem[d] Larry Rhoden Jason Ravnsborg |
Joseph M. Yracheta Nicole A. Gronli Randy Seiler |
Devin Saxon Tracey Quint N/A |
Results edit
| Party | Candidate | Votes | % | ±% | |
|---|---|---|---|---|---|
| Republican | Donald Trump Mike Pence |
261,043 | 61.77% | +0.24% | |
| Democratic | Joe Biden Kamala Harris |
150,471 | 35.61% | +3.87% | |
| Libertarian | Jo Jorgensen Spike Cohen |
11,095 | 2.63% | -3.00% | |
| Total votes | 422,609 | 100.00% | |||
Results by county edit
| County | Donald Trump Republican |
Joe Biden Democratic |
Various candidates Other parties |
Margin | Total | ||||
|---|---|---|---|---|---|---|---|---|---|
| # | % | # | % | # | % | # | % | ||
| Aurora | 1,052 | 74.88% | 317 | 22.56% | 36 | 2.56% | 735 | 52.32% | 1,405 |
| Beadle | 4,808 | 67.90% | 2,107 | 29.76% | 166 | 2.34% | 2,701 | 38.14% | 7,081 |
| Bennett | 694 | 58.66% | 466 | 39.39% | 23 | 1.95% | 228 | 19.27% | 1,183 |
| Bon Homme | 2,235 | 74.48% | 721 | 24.03% | 45 | 1.49% | 1,514 | 50.45% | 3,001 |
| Brookings | 8,000 | 54.92% | 6,110 | 41.94% | 457 | 3.14% | 1,890 | 12.98% | 14,567 |
| Brown | 10,580 | 60.30% | 6,538 | 37.26% | 429 | 2.44% | 4,042 | 23.04% | 17,547 |
| Brule | 1,750 | 70.28% | 673 | 27.03% | 67 | 2.69% | 1,077 | 43.25% | 2,490 |
| Buffalo | 183 | 33.33% | 352 | 64.12% | 14 | 2.55% | -169 | -30.79% | 549 |
| Butte | 3,731 | 77.70% | 939 | 19.55% | 132 | 2.75% | 2,792 | 58.15% | 4,802 |
| Campbell | 747 | 85.57% | 117 | 13.40% | 9 | 1.03% | 630 | 72.17% | 873 |
| Charles Mix | 2,552 | 67.46% | 1,177 | 31.11% | 54 | 1.43% | 1,375 | 36.35% | 3,783 |
| Clark | 1,373 | 74.22% | 437 | 23.62% | 40 | 2.16% | 936 | 50.60% | 1,850 |
| Clay | 2,456 | 43.10% | 3,083 | 54.11% | 159 | 2.79% | -627 | -11.01% | 5,698 |
| Codington | 8,958 | 68.06% | 3,837 | 29.15% | 366 | 2.79% | 5,121 | 38.91% | 13,161 |
| Corson | 647 | 50.43% | 622 | 48.48% | 14 | 1.09% | 25 | 1.95% | 1,283 |
| Custer | 3,852 | 70.11% | 1,522 | 27.70% | 120 | 2.19% | 2,330 | 42.41% | 5,494 |
| Davison | 5,613 | 66.39% | 2,648 | 31.32% | 193 | 2.29% | 2,965 | 35.07% | 8,454 |
| Day | 1,869 | 63.06% | 1,052 | 35.49% | 43 | 1.45% | 817 | 27.57% | 2,964 |
| Deuel | 1,699 | 72.30% | 609 | 25.91% | 42 | 1.79% | 1,090 | 46.39% | 2,350 |
| Dewey | 790 | 40.18% | 1,131 | 57.53% | 45 | 2.29% | -341 | -17.45% | 1,966 |
| Douglas | 1,468 | 86.00% | 216 | 12.65% | 23 | 1.35% | 1,252 | 73.35% | 1,707 |
| Edmunds | 1,538 | 77.48% | 417 | 21.01% | 30 | 1.51% | 1,121 | 56.47% | 1,985 |
| Fall River | 2,878 | 71.20% | 1,053 | 26.05% | 111 | 2.75% | 1,825 | 45.15% | 4,042 |
| Faulk | 964 | 81.56% | 198 | 16.75% | 20 | 1.69% | 766 | 64.81% | 1,182 |
| Grant | 2,618 | 69.91% | 1,056 | 28.20% | 71 | 1.89% | 1,562 | 41.71% | 3,745 |
| Gregory | 1,771 | 78.43% | 455 | 20.15% | 32 | 1.42% | 1,316 | 58.28% | 2,258 |
| Haakon | 1,026 | 90.24% | 105 | 9.23% | 6 | 0.53% | 921 | 81.01% | 1,137 |
| Hamlin | 2,372 | 76.94% | 647 | 20.99% | 64 | 2.07% | 1,725 | 55.95% | 3,083 |
| Hand | 1,433 | 78.05% | 373 | 20.32% | 30 | 1.63% | 1,060 | 57.73% | 1,836 |
| Hanson | 1,793 | 75.08% | 557 | 23.32% | 38 | 1.60% | 1,236 | 51.76% | 2,388 |
| Harding | 748 | 92.00% | 49 | 6.03% | 16 | 1.97% | 699 | 85.97% | 813 |
| Hughes | 5,522 | 63.30% | 2,953 | 33.85% | 248 | 2.85% | 2,569 | 29.45% | 8,723 |
| Hutchinson | 2,944 | 78.15% | 762 | 20.23% | 61 | 1.62% | 2,182 | 57.92% | 3,767 |
| Hyde | 564 | 79.44% | 136 | 19.15% | 10 | 1.41% | 428 | 60.29% | 710 |
| Jackson | 738 | 66.19% | 359 | 32.20% | 18 | 1.61% | 379 | 33.99% | 1,115 |
| Jerauld | 721 | 71.67% | 270 | 26.84% | 15 | 1.49% | 451 | 44.83% | 1,006 |
| Jones | 498 | 83.14% | 90 | 15.03% | 11 | 1.83% | 408 | 68.11% | 599 |
| Kingsbury | 1,904 | 68.51% | 819 | 29.47% | 56 | 2.02% | 1,085 | 39.04% | 2,779 |
| Lake | 3,681 | 62.68% | 2,068 | 35.21% | 124 | 2.11% | 1,613 | 27.47% | 5,873 |
| Lawrence | 8,753 | 63.30% | 4,537 | 32.81% | 538 | 3.89% | 4,216 | 30.49% | 13,828 |
| Lincoln | 19,617 | 60.55% | 11,981 | 36.98% | 798 | 2.47% | 7,636 | 23.57% | 32,396 |
| Lyman | 1,042 | 65.25% | 525 | 32.87% | 30 | 1.88% | 517 | 32.38% | 1,597 |
| Marshall | 1,287 | 59.09% | 858 | 39.39% | 33 | 1.52% | 429 | 19.70% | 2,178 |
| McCook | 2,068 | 71.31% | 769 | 26.52% | 63 | 2.17% | 1,299 | 44.79% | 2,900 |
| McPherson | 1,075 | 81.19% | 222 | 16.77% | 27 | 2.04% | 853 | 64.42% | 1,324 |
| Meade | 9,875 | 72.24% | 3,285 | 24.03% | 510 | 3.73% | 6,590 | 48.21% | 13,670 |
| Mellette | 449 | 58.39% | 298 | 38.75% | 22 | 2.86% | 151 | 19.64% | 769 |
| Miner | 787 | 69.16% | 320 | 28.12% | 31 | 2.72% | 567 | 41.04% | 1,138 |
| Minnehaha | 49,249 | 53.34% | 40,482 | 43.85% | 2,595 | 2.81% | 8,767 | 9.49% | 92,326 |
| Moody | 1,951 | 60.85% | 1,179 | 36.77% | 76 | 2.38% | 772 | 24.08% | 3,206 |
| Oglala Lakota | 297 | 9.28% | 2,829 | 88.41% | 74 | 2.31% | -2,532 | -79.13% | 3,200 |
| Pennington | 35,063 | 60.96% | 20,606 | 35.83% | 1,849 | 3.21% | 14,457 | 25.13% | 57,518 |
| Perkins | 1,401 | 83.94% | 239 | 14.32% | 29 | 1.74% | 1,162 | 69.62% | 1,669 |
| Potter | 1,139 | 82.54% | 227 | 16.45% | 14 | 1.01% | 912 | 66.09% | 1,380 |
| Roberts | 2,404 | 55.82% | 1,828 | 42.44% | 75 | 1.74% | 576 | 13.38% | 4,307 |
| Sanborn | 905 | 76.37% | 257 | 21.69% | 23 | 1.94% | 648 | 54.68% | 1,185 |
| Spink | 2,104 | 66.52% | 998 | 31.55% | 61 | 1.93% | 1,106 | 34.97% | 3,163 |
| Stanley | 1,203 | 72.82% | 421 | 25.48% | 28 | 1.70% | 782 | 47.34% | 1,652 |
| Sully | 726 | 78.06% | 185 | 19.89% | 19 | 2.05% | 541 | 58.17% | 930 |
| Todd | 532 | 20.95% | 1,963 | 77.31% | 44 | 1.74% | -1,431 | -56.36% | 2,539 |
| Tripp | 2,161 | 80.16% | 495 | 18.36% | 40 | 1.48% | 1,666 | 61.80% | 2,696 |
| Turner | 3,290 | 72.34% | 1,139 | 25.04% | 119 | 2.62% | 2,151 | 47.30% | 4,548 |
| Union | 5,944 | 67.13% | 2,725 | 30.77% | 186 | 2.10% | 3,219 | 36.36% | 8,855 |
| Walworth | 1,966 | 76.20% | 565 | 21.90% | 49 | 1.90% | 1,401 | 54.30% | 2,580 |
| Yankton | 6,581 | 60.38% | 4,016 | 36.84% | 303 | 2.78% | 2,565 | 23.54% | 10,900 |
| Ziebach | 404 | 44.59% | 481 | 53.09% | 21 | 2.32% | -77 | -8.50% | 906 |
| Totals | 261,043 | 61.77% | 150,471 | 35.61% | 11,095 | 2.62% | 110,572 | 26.16% | 422,609 |

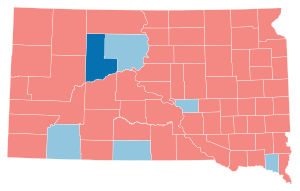
Counties that flipped from Republican to Democratic edit
By congressional district edit
South Dakota has only one congressional district because of its small population compared to other states. This district, called the At-Large district because it covers the entire state, is equivalent to the statewide election results.
| District | Trump | Biden | Representative |
|---|---|---|---|
| At-large | 61.77% | 35.61% | Dusty Johnson |
Analysis edit
South Dakota, a majority-White, mainly-rural state in the Midwestern Plains, is normally a Republican stronghold at both the state and presidential levels, despite being more populated than—and voting to the left of—neighboring North Dakota. It hasn't voted for a Democratic presidential candidate since Lyndon B. Johnson carried it in 1964, against the backdrop of his nationwide landslide victory. It has only been competitive (within 5 points of a Democratic victory) in three elections since then: 1976, 1992, and 1996, all elections the Democratic nominee won. Even South Dakota Senator George McGovern failed to carry his home state as Democratic nominee in the Republican landslide of 1972.
Despite Trump's win in the state, Biden flipped majority-Native American Ziebach County back to Democratic after it flipped red in 2016. Meanwhile, Trump held the majority-Native American counties of Bennett, Mellette and Jackson, and grew his support in Corson County, particularly in white-majority precincts while Biden held on to Native American support in other majority-minority precincts in the state. Per exit polls by the Associated Press, Trump won 63% of White Americans, a group composing 94% of the electorate.[24] A sparsely populated state with a rural and conservative lifestyle, South Dakota has an agrarian populist streak[25] to which Trump made direct appeals. He campaigned personally in the state, using Mount Rushmore as a backdrop to cast himself as waging battle against a "new far-left fascism".[26]
While Biden did not win Minnehaha County, home to the state's largest city, Sioux Falls, that Barack Obama carried by less than one percent in 2008, he reduced Trump's 2016 14.6-percent winning margin in the county to 9.4 points, although Trump received a higher percentage of votes in the county than Mitt Romney did in 2012. Biden became the first Democrat to win the White House without carrying Roberts County since Woodrow Wilson in 1916, as well as the first to do so without carrying Day County since Franklin D. Roosevelt in 1944, and the first to do so without carrying Marshall County since John F. Kennedy in 1960.
See also edit
Notes edit
- ^ Calculated by taking the difference of 100% and all other candidates combined.
- ^ Key:
A – all adults
RV – registered voters
LV – likely voters
V – unclear - ^ Overlapping sample with the previous SurveyMonkey/Axios poll, but more information available regarding sample size
- ^ After her election, Noem was replaced by Dan Lederman.[22]
References edit
- ^ "Voter turnout". Retrieved November 11, 2020.
- ^ Kelly, Ben (August 13, 2018). "US elections key dates: When are the 2018 midterms and the 2020 presidential campaign?". The Independent. Archived from the original on August 2, 2018. Retrieved January 3, 2019.
- ^ "Distribution of Electoral Votes". National Archives and Records Administration. Retrieved January 3, 2019.
- ^ "South Dakota Republican Delegation 2020". The Green Papers. Retrieved June 3, 2020.
- ^ "2020 Primary State Canvass Report and Certificate" (PDF). electionresults.sd.gov. South Dakota Secretary of State. Retrieved August 12, 2020.
- ^ "Delegate Tracker". interactives.ap.org. Associated Press. Retrieved June 2, 2020.
- ^ "2020 POTUS Race ratings" (PDF). The Cook Political Report. Retrieved May 21, 2019.
- ^ "POTUS Ratings | Inside Elections". insideelections.com. Retrieved May 21, 2019.
- ^ "Larry J. Sabato's Crystal Ball » 2020 President". crystalball.centerforpolitics.org. Retrieved May 21, 2019.
- ^ "2020 Election Forecast". Politico. November 19, 2019.
- ^ "Battle for White House". RCP. April 19, 2019.
- ^ 2020 Bitecofer Model Electoral College Predictions Archived April 23, 2020, at the Wayback Machine, Niskanen Center, March 24, 2020, retrieved: April 19, 2020
- ^ David Chalian; Terence Burlij (June 11, 2020). "Road to 270: CNN's debut Electoral College map for 2020". CNN. Retrieved June 16, 2020.
- ^ "Forecasting the US elections". The Economist. Retrieved July 7, 2020.
- ^ "2020 Election Battleground Tracker". CBS News. July 12, 2020. Retrieved July 13, 2020.
- ^ "2020 Presidential Election Interactive Map". 270 to Win.
- ^ "ABC News Race Ratings". CBS News. July 24, 2020. Retrieved July 24, 2020.
- ^ "2020 Electoral Map Ratings: Trump Slides, Biden Advantage Expands Over 270 Votes". NPR.org. Retrieved August 3, 2020.
- ^ "Biden dominates the electoral map, but here's how the race could tighten". NBC News. August 6, 2020. Retrieved August 6, 2020.
- ^ "2020 Election Forecast". FiveThirtyEight. August 12, 2020. Retrieved August 14, 2020.
- ^ "Certificate of Ascertainment of Election" (PDF). South Dakota Secretary of State. Retrieved December 6, 2020.
- ^ Zionts, Arielle (January 19, 2021). "Noem meeting with Trump on Monday instead of voting for him in Electoral College". Rapid City Journal. Retrieved July 25, 2021.
- ^ "General Election - November 3, 2020" (PDF). sdsos.gov. Retrieved November 11, 2020.
- ^ "South Dakota Voter Surveys: How Different Groups Voted". The New York Times. November 3, 2020. ISSN 0362-4331. Retrieved November 17, 2020.
- ^ Cohen, Micah (August 24, 2012). "In South Dakota, Only the Farm Trumps Conservatism". FiveThirtyEight. Retrieved November 17, 2020.
- ^ "Remarks by President Trump at South Dakota's 2020 Mount Rushmore Fireworks Celebration | Keystone, South Dakota". The White House. Retrieved November 17, 2020.
External links edit
- Government Documents Round Table of the American Library Association, "South Dakota", Voting & Elections Toolkits
- "South Dakota: Election Tools, Deadlines, Dates, Rules, and Links", Vote.org, Oakland, CA
- "League of Women Voters of South Dakota". (State affiliate of the U.S. League of Women Voters)
- South Dakota at Ballotpedia