


Summary
The 2020 United States presidential election in Washington was held on Tuesday, November 3, 2020, as part of the 2020 United States presidential election in which all 50 U.S. states plus the District of Columbia participated.[2] Washington voters chose electors to represent them in the Electoral College via a popular vote, pitting the Republican Party's nominee, incumbent President Donald Trump, and running mate Vice President Mike Pence against Democratic Party nominee, former Vice President Joe Biden, and his running mate California Senator Kamala Harris. Washington has 12 electoral votes in the Electoral College.[3]
| ||||||||||||||||||||||||||
| Turnout | 84.11% (of registered voters) | |||||||||||||||||||||||||
|---|---|---|---|---|---|---|---|---|---|---|---|---|---|---|---|---|---|---|---|---|---|---|---|---|---|---|
| ||||||||||||||||||||||||||


| ||||||||||||||||||||||||||
| ||||||||||||||||||||||||||

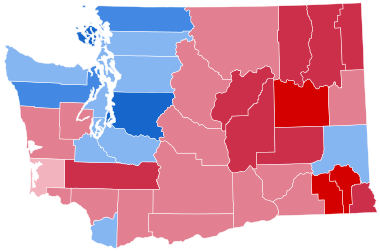
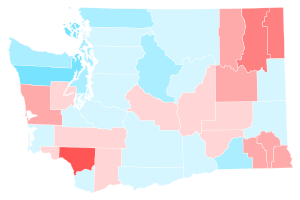
Prior to the election, most news organizations forecast Washington as a state that Biden would win, or a safe blue state. Biden won the state by 19.2%, the largest margin for a presidential candidate of any party since 1964. He also flipped the swing county of Clallam, which now holds the record for the longest ongoing streak of voting for the national winner, having supported the winning candidate in every election since 1980. Biden also became the candidate with the highest vote total in the state's history, with 2,369,612 votes.[4] This was the first time since 1988 that Washington voted to the left of Illinois.
The Seattle metropolitan area, home to almost two-thirds of the state's population, is overwhelmingly Democratic. Despite this, even if the votes from King, Snohomish, and Pierce counties were removed, Biden would have carried the state by over 4,000 votes.[5] However, Trump won a considerable majority in outlying communities, garnering over 70% of the vote in rural counties such as Columbia. Eastern Washington is very rural and leans Republican, partly due to the strong tinge of social conservatism it shares with neighboring Idaho, a GOP stronghold. That said, Biden was able to improve on Clinton's margin in Whitman County--anchored by the college town of Pullman--increasing it from 4.1% in 2016 to 10.2% in 2020, the best performance for a Democrat in the county since 1936. In addition, he narrowed Trump's margin in Spokane County from 8.4% to 4.3%. Biden earned 75% of the vote in King County, home to Seattle. This was the largest margin by any candidate in a presidential race since the county's creation.[6]
Per exit polls by the Associated Press, Biden's strength in Washington came from 59% among white voters, 73% among Latinos and 79% among Asian-Americans. 34% of voters were irreligious and supported Biden by 78%.[7] Additionally, a majority of Native Americans in the state backed Biden by about 65%, with some tribes supporting Biden by over 80%.[8] Biden also became the first Democrat since Washington's admission into the union to win the presidency without winning Mason County, the first Democrat since John F. Kennedy in 1960 to prevail without winning Cowlitz County, and the first Democrat since Woodrow Wilson in 1916 to prevail without winning Grays Harbor County and Pacific County.
Primary elections edit
The primaries for the major parties were on March 10, 2020. On March 14, 2019, Governor Jay Inslee signed a bill moving the state's presidential primary up from May to the second Tuesday in March.[9]
Republican primary edit
Donald Trump, Bill Weld, Joe Walsh, and Rocky de la Fuente had declared their candidacy for the Republican Party, but only Trump met all of the state party's criteria by the official deadline of January 21, 2020, for being included on the ballot.[10] Thus Trump essentially ran unopposed in the Republican primary, and thus he received all of Washington's 43 delegates to the 2020 Republican National Convention.[11]
| Candidate | Votes | % | Delegates[13] |
|---|---|---|---|
| Donald Trump | 684,239 | 98.41 | 43 |
| Write-ins | 11,036 | 1.59 | 0 |
| Total | 695,275 | 100% | 43 |
Democratic primary edit
A number of Democratic Party candidates ran or expressed interest in running.[14][15][16] Additionally, Seattle-based billionaire Howard Schultz announced a potential bid as an independent in early 2019, but backed out in September of that year.[17] The party's candidates included on the ballot at the deadline were Michael Bennet, Joe Biden, Michael Bloomberg, Cory Booker, Pete Buttigieg, John Delaney, Tulsi Gabbard, Amy Klobuchar, Deval Patrick, Bernie Sanders, Tom Steyer, Elizabeth Warren and Andrew Yang.[10]

| Candidate | Votes | % | Delegates[19] |
|---|---|---|---|
| Joe Biden | 591,403 | 37.94 | 46 |
| Bernie Sanders | 570,039 | 36.57 | 43 |
| Elizabeth Warren (withdrawn)[a] | 142,652 | 9.15 | |
| Michael Bloomberg (withdrawn)[a] | 122,530 | 7.86 | |
| Pete Buttigieg (withdrawn)[b] | 63,344 | 4.06 | |
| Amy Klobuchar (withdrawn)[b] | 33,383 | 2.14 | |
| Tulsi Gabbard | 13,199 | 0.85 | |
| Andrew Yang (withdrawn) | 6,403 | 0.41 | |
| Tom Steyer (withdrawn)[b] | 3,455 | 0.22 | |
| Michael Bennet (withdrawn) | 2,044 | 0.13 | |
| Cory Booker (withdrawn) | 1,314 | 0.08 | |
| John Delaney (withdrawn) | 573 | 0.04 | |
| Deval Patrick (withdrawn) | 508 | 0.03 | |
| Write-in votes | 1,479 | 0.09 | |
| Uncommitted | 6,450 | 0.41 | |
| Total | 1,558,776 | 100% | 89 |
Green primary edit
As a minor party, Washington State's Green Party affiliate is excluded from the publicly funded Presidential Primary in Washington State. The Green Party of Washington facilitated its primary by a mail-in ballot to its members after its Spring Convention on May 23[20] (deadline was June 13).
All candidates recognized by the Green Party of the United States by April 23 were on the ballot, plus a write-in option:
- Howie Hawkins
- Dario Hunter
- David Rolde
General election edit
Final predictions edit
| Source | Ranking |
|---|---|
| The Cook Political Report[21] | Solid D |
| Inside Elections[22] | Solid D |
| Sabato's Crystal Ball[23] | Safe D |
| Politico[24] | Solid D |
| RCP[25] | Likely D |
| Niskanen[26] | Safe D |
| CNN[27] | Solid D |
| The Economist[28] | Safe D |
| CBS News[29] | Likely D |
| 270towin[30] | Safe D |
| ABC News[31] | Solid D |
| NPR[32] | Likely D |
| NBC News[33] | Solid D |
| 538[34] | Solid D |
Polling edit
Graphical summary edit
Aggregate polls edit
| Source of poll aggregation |
Dates administered |
Dates updated |
Joe Biden Democratic |
Donald Trump Republican |
Other/ Undecided [c] |
Margin |
|---|---|---|---|---|---|---|
| 270 to Win | October 8–15, 2020 | October 27, 2020 | 57.5% | 35.5% | 7.0% | Biden +22.0 |
| FiveThirtyEight | until November 2, 2020 | November 3, 2020 | 59.4% | 36.4% | 4.2% | Biden +23.0 |
| Average | 58.5% | 36.0% | 5.6% | Biden +22.5 | ||
Polls edit
| Poll source | Date(s) administered |
Sample size[d] |
Margin of error |
Donald Trump Republican |
Joe Biden Democratic |
Jo Jorgensen Libertarian |
Howie Hawkins Green |
Other | Undecided |
|---|---|---|---|---|---|---|---|---|---|
| SurveyMonkey/Axios | Oct 20 – Nov 2, 2020 | 4,142 (LV) | ± 2% | 35%[e] | 62% | – | – | – | – |
| Swayable Archived November 27, 2020, at the Wayback Machine | Oct 23 – Nov 1, 2020 | 489 (LV) | ± 6% | 39% | 59% | 2% | 1% | – | – |
| SurveyMonkey/Axios | Oct 1–28, 2020 | 7,424 (LV) | – | 36% | 62% | – | – | – | – |
| PPP/NPI | Oct 14–15, 2020 | 610 (LV) | ± 4% | 37% | 60% | – | – | – | 2% |
| SurveyUSA/KING-TV | Oct 8–10, 2020 | 591 (LV) | ± 5.2% | 34% | 55% | – | – | 5%[f] | 5% |
| SurveyMonkey/Axios | Sep 1–30, 2020 | 7,953 (LV) | – | 35% | 64% | – | – | – | 2% |
| Strategies 360 | Sep 8–14, 2020 | 501 (RV) | ± 4.4% | 36% | 58% | – | – | – | 7%[g] |
| SurveyMonkey/Axios | Aug 1–31, 2020 | 7,489 (LV) | – | 37% | 61% | – | – | – | 2% |
| SurveyMonkey/Axios | Jul 1–31, 2020 | 7,691 (LV) | – | 37% | 62% | – | – | – | 2% |
| SurveyUSA/KING-TV | Jul 22–27, 2020 | 534 (LV) | ± 5.2% | 28% | 62% | – | – | 6%[h] | – |
| SurveyMonkey/Axios | Jun 8–30, 2020 | 3,939 (LV) | – | 36% | 62% | – | – | – | 2% |
| Public Policy Polling/NPI | May 19–20, 2020 | 1,070 (LV) | ± 3% | 37% | 59% | – | – | – | 5% |
| SurveyUSA/KING-TV | May 16–19, 2020 | 530 (LV) | ± 5.5% | 31% | 57% | – | – | 5%[i] | 7% |
| EMC Research | Mar 31 – Apr 6, 2020 | 583 (A) | ± 4.1% | 39% | 52% | – | – | – | 9% |
| SurveyUSA/KING-TV | Mar 4–6, 2020 | 992 (RV) | ± 3.8% | 34% | 57% | – | – | – | 9% |
| Public Policy Polling/The Cascadia Advocate | Oct 22–23, 2019 | 900 (LV) | ± 3.3% | 37% | 59% | – | – | – | 3% |
| Zogby Interactive/JZ Analytics | Jul 22 – Aug 1, 2019 | 1,265 (LV) | ± 2.8% | 31% | 52% | – | – | – | 17% |
Donald Trump vs. Pete Buttigieg
| Poll source | Date(s) administered |
Sample size[d] |
Margin of error |
Donald Trump (R) |
Pete Buttigieg (D) |
Undecided |
|---|---|---|---|---|---|---|
| Zogby Interactive/JZ Analytics | Jul 22 – Aug 1, 2019 | 1,265 (LV) | ± 2.8% | 32% | 44% | 24% |
with Donald Trump and Kamala Harris
| Poll source | Date(s) administered |
Sample size[d] |
Margin of error |
Donald Trump (R) |
Kamala Harris (D) |
Undecided |
|---|---|---|---|---|---|---|
| Zogby Interactive/JZ Analytics | Jul 22 – Aug 1, 2019 | 1,265 (LV) | ± 2.8% | 33% | 47% | 20% |
Donald Trump vs. Bernie Sanders
| Poll source | Date(s) administered |
Sample size[d] |
Margin of error |
Donald Trump (R) |
Bernie Sanders (D) |
Undecided |
|---|---|---|---|---|---|---|
| SurveyUSA/KING-TV | Mar 4–6, 2020 | 992 (RV) | ± 3.8% | 35% | 56% | 9% |
| Public Policy Polling/The Cascadia Advocate | Oct 22–23, 2019 | 900 (LV) | ± 3.3% | 37% | 58% | 6% |
| Zogby Interactive/JZ Analytics | Jul 22 – Aug 1, 2019 | 1,265 (LV) | ± 2.8% | 32% | 54% | 14% |
Donald Trump vs. Elizabeth Warren
| Poll source | Date(s) administered |
Sample size[d] |
Margin of error |
Donald Trump (R) |
Elizabeth Warren (D) |
Undecided |
|---|---|---|---|---|---|---|
| SurveyUSA/KING-TV | Mar 4–6, 2020 | 992 (RV) | ± 3.8% | 38% | 52% | 10% |
| Public Policy Polling/The Cascadia Advocate | Oct 22–23, 2019 | 900 (LV) | ± 3.3% | 37% | 60% | 3% |
| Zogby Interactive/JZ Analytics | Jul 22 – Aug 1, 2019 | 1,265 (LV) | ± 2.8% | 33% | 48% | 20% |
with Donald Trump and generic Democrat
| Poll source | Date(s) administered |
Sample size[d] |
Margin of error |
Donald Trump (R) |
Generic Democrat |
Undecided |
|---|---|---|---|---|---|---|
| Public Policy Polling | May 21–22, 2019 | 886 (LV) | ± 3.3% | 34% | 59% | 7% |
Electoral slates edit
These slates of electors were nominated by each party in order to vote in the Electoral College should their candidate win the state:[35]
| Joe Biden and Kamala Harris Democratic Party |
Donald Trump and Mike Pence Republican Party |
Jo Jorgensen and Spike Cohen Libertarian Party |
Howie Hawkins and Angela Walker Green Party |
Gloria La Riva and Sunil Freeman Party for Socialism and Liberation |
Alyson Kennedy and Malcolm Jarrett Socialist Workers Party |
|---|---|---|---|---|---|
| Martin Chaney Jack Arends Jackie Lane Patsy Whitefoot Nancy Monacelli Julie Johnson Sophia Danenberg Jen Carter Bryan Kesterson Julian Wheeler Santiago Ramos Payton Swinford |
Eric Rohrbach Timothy Hazelo Ronald Averill Richard Bilskis Dan Wallace Elizabeth Kreiselmaier Craig Keller Tamara Flaherty Timothy Tow Colleen Wise Arthur Coday Sandi Peterson |
Nathan Deily Miguel Duque Nicholas Coelho Larry Nicholas Data Logan Whitney Davis Ciaran Dougherty Steve Hansen Larry Hovde Will Leonard Randy McGlenn Anna Johnson |
Jody Thorsen Grage Cynthia J. Sellers Margaret J. Elisabeth Stonewall Bird Scott Charles Thompson Bruce Radtke Charles Law Richard A. Redick Frank Lockwood Noah Martin Colin Bartlett Daniel Bumbarger |
Jane N. Cutter Andrew T. Freeman Emily Forschmiedt Sean Connolly Jacob Nasrallah Gregory Plancich Ryan Oliveira Nicolas Boone Mitchell Malloy Mario Carbonell Eric Buerk Charles A Susat |
Michele Ann Smith Patricia Ann Scott Sara Jane Gates Keith Bryan Smith Mary Juanita Martin Edwin B. Fruit Scott A. Breen Barbara Anne Kline Rashaad Ali Robert Bruneau Dean Denno Leah Beth Finger |
Results edit
| Party | Candidate | Votes | % | ±% | |
|---|---|---|---|---|---|
| Democratic | Joe Biden Kamala Harris |
2,369,612 | 57.97% | +5.43% | |
| Republican | Donald Trump Mike Pence |
1,584,651 | 38.77% | +1.94% | |
| Libertarian | Jo Jorgensen Spike Cohen |
80,500 | 1.97% | −2.88% | |
| Green | Howie Hawkins Angela Walker |
18,289 | 0.45% | −1.31% | |
| Socialism and Liberation | Gloria La Riva Sunil Freeman |
4,840 | 0.12% | +0.01% | |
| Socialist Workers | Alyson Kennedy Malcolm Jarrett |
2,487 | 0.06% | −0.07% | |
| Write-in | 27,252 | 0.67% | −2.58% | ||
| Total votes | 4,087,631 | 100.00% | N/A | ||
By winning nearly 58% of the vote, Joe Biden's performance was the best showing for a presidential candidate of any party in Washington since Lyndon B. Johnson's landslide victory in 1964.
By county edit
| County | Joe Biden Democratic |
Donald Trump Republican |
Various candidates Other parties |
Margin | Total | ||||
|---|---|---|---|---|---|---|---|---|---|
| # | % | # | % | # | % | # | % | ||
| Adams | 1,814 | 30.95% | 3,907 | 66.65% | 141 | 2.40% | -2,093 | -35.70% | 5,862 |
| Asotin | 4,250 | 35.56% | 7,319 | 61.24% | 382 | 3.20% | -3,069 | -25.68% | 11,951 |
| Benton | 38,706 | 37.57% | 60,365 | 58.59% | 3,962 | 3.84% | -21,659 | -21.02% | 103,033 |
| Chelan | 19,349 | 44.68% | 22,746 | 52.52% | 1,211 | 2.80% | -3,397 | -7.84% | 43,306 |
| Clallam | 24,721 | 50.18% | 23,062 | 46.81% | 1,481 | 3.01% | 1,659 | 3.37% | 49,264 |
| Clark | 140,324 | 50.95% | 126,303 | 45.86% | 8,776 | 3.19% | 14,021 | 5.09% | 275,403 |
| Columbia | 668 | 26.77% | 1,754 | 70.30% | 73 | 2.93% | -1,086 | -43.53% | 2,495 |
| Cowlitz | 23,938 | 39.71% | 34,424 | 57.11% | 1,918 | 3.18% | -10,486 | -17.40% | 60,280 |
| Douglas | 7,811 | 36.66% | 12,955 | 60.80% | 542 | 2.54% | -5,144 | -24.14% | 21,308 |
| Ferry | 1,486 | 34.03% | 2,771 | 63.45% | 110 | 2.52% | -1,285 | -29.42% | 4,367 |
| Franklin | 13,340 | 41.17% | 18,039 | 55.67% | 1,025 | 3.16% | -4,699 | -14.50% | 32,404 |
| Garfield | 366 | 24.58% | 1,069 | 71.79% | 54 | 3.63% | -703 | -47.21% | 1,489 |
| Grant | 11,819 | 31.37% | 24,764 | 65.72% | 1,097 | 2.91% | -12,945 | -34.35% | 37,680 |
| Grays Harbor | 17,354 | 45.14% | 19,877 | 51.71% | 1,210 | 3.15% | -2,523 | -6.57% | 38,441 |
| Island | 29,213 | 54.17% | 22,746 | 42.18% | 1,966 | 3.65% | 6,467 | 11.99% | 53,925 |
| Jefferson | 17,204 | 69.39% | 6,931 | 27.96% | 657 | 2.65% | 10,273 | 41.43% | 24,792 |
| King | 907,310 | 74.95% | 269,167 | 22.24% | 34,030 | 2.81% | 638,143 | 52.71% | 1,210,507 |
| Kitsap | 90,277 | 56.90% | 61,563 | 38.80% | 6,832 | 4.30% | 28,714 | 18.10% | 158,672 |
| Kittitas | 11,421 | 43.32% | 14,105 | 53.50% | 838 | 3.18% | -2,684 | -10.18% | 26,364 |
| Klickitat | 5,959 | 43.95% | 7,237 | 53.37% | 364 | 2.68% | -1,278 | -9.42% | 13,560 |
| Lewis | 14,520 | 32.05% | 29,391 | 64.87% | 1,398 | 3.08% | -14,871 | -32.82% | 45,309 |
| Lincoln | 1,713 | 24.36% | 5,150 | 73.23% | 170 | 2.41% | -3,437 | -48.87% | 7,033 |
| Mason | 17,269 | 46.29% | 18,710 | 50.16% | 1,324 | 3.55% | -1,441 | -3.87% | 37,303 |
| Okanogan | 8,900 | 41.82% | 11,840 | 55.63% | 542 | 2.55% | -2,940 | -13.81% | 21,282 |
| Pacific | 6,794 | 48.31% | 6,953 | 49.44% | 317 | 2.25% | -159 | -1.13% | 14,064 |
| Pend Oreille | 2,593 | 30.32% | 5,728 | 66.97% | 232 | 2.71% | -3,135 | -36.65% | 8,553 |
| Pierce | 249,506 | 53.76% | 197,730 | 42.61% | 16,845 | 3.63% | 51,776 | 11.15% | 464,081 |
| San Juan | 9,725 | 73.69% | 3,057 | 23.16% | 415 | 3.15% | 6,668 | 50.53% | 13,197 |
| Skagit | 38,252 | 52.10% | 32,762 | 44.62% | 2,409 | 3.28% | 5,490 | 7.48% | 73,423 |
| Skamania | 3,192 | 43.65% | 3,885 | 53.13% | 235 | 3.22% | -693 | -9.48% | 7,312 |
| Snohomish | 256,728 | 58.51% | 166,428 | 37.93% | 15,640 | 3.56% | 90,300 | 20.58% | 438,796 |
| Spokane | 135,765 | 45.96% | 148,576 | 50.29% | 11,089 | 3.75% | -12,811 | -4.33% | 295,430 |
| Stevens | 7,839 | 27.57% | 19,808 | 69.67% | 783 | 2.76% | -11,969 | -42.10% | 28,430 |
| Thurston | 96,608 | 57.46% | 65,277 | 38.82% | 6,249 | 3.72% | 31,331 | 18.64% | 168,134 |
| Wahkiakum | 1,165 | 39.08% | 1,741 | 58.40% | 75 | 2.52% | -576 | -19.32% | 2,981 |
| Walla Walla | 13,690 | 43.79% | 16,400 | 52.46% | 1,171 | 3.75% | -2,710 | -8.67% | 31,261 |
| Whatcom | 83,660 | 60.35% | 50,489 | 36.42% | 4,471 | 3.23% | 33,171 | 23.93% | 138,620 |
| Whitman | 11,184 | 52.94% | 9,067 | 42.92% | 875 | 4.14% | 2,117 | 10.02% | 21,126 |
| Yakima | 43,179 | 44.89% | 50,555 | 52.56% | 2,459 | 2.55% | -7,376 | -7.67% | 96,193 |
| Totals | 2,369,612 | 57.97% | 1,584,651 | 38.77% | 133,368 | 3.26% | 784,961 | 19.20% | 4,087,631 |


Counties that flipped from Republican to Democratic edit
- Clallam County (largest municipality: Port Angeles)
By congressional district edit
Biden won 7 of 10 congressional districts.[37]
| District | Trump | Biden | Representative |
|---|---|---|---|
| 1st | 38% | 59% | Suzan DelBene |
| 2nd | 35% | 62% | Rick Larsen |
| 3rd | 51% | 47% | Jaime Herrera Beutler |
| 4th | 58% | 39% | Dan Newhouse |
| 5th | 53% | 44% | Cathy McMorris Rodgers |
| 6th | 39% | 57% | Derek Kilmer |
| 7th | 12% | 86% | Pramila Jayapal |
| 8th | 45% | 51% | Kim Schrier |
| 9th | 24% | 73% | Adam Smith |
| 10th | 41% | 56% | Denny Heck |
| Marilyn Strickland |
See also edit
Notes edit
- ^ a b Candidate withdrew after Super Tuesday when all-mail voting had already begun.
- ^ a b c Candidate withdrew before Super Tuesday when all-mail voting had already begun.
- ^ Calculated by taking the difference of 100% and all other candidates combined.
- ^ a b c d e f Key:
A – all adults
RV – registered voters
LV – likely voters
V – unclear - ^ Overlapping sample with the previous SurveyMonkey/Axios poll, but more information available regarding sample size
- ^ "Another candidate" with 5%
- ^ Includes "Refused"
- ^ "Another candidate" with 6%
- ^ "A candidate from another party" with 5%
References edit
- ^ "November 3, 2020 General Election - Voter Turnout".
- ^ Kelly, Ben (August 13, 2018). "US elections key dates: When are the 2018 midterms and the 2020 presidential campaign?". The Independent. Archived from the original on August 2, 2018. Retrieved January 3, 2019.
- ^ "Distribution of Electoral Votes". National Archives and Records Administration. Retrieved January 3, 2019.
- ^ Farley, Josh (November 7, 2020). "What does Clallam County know? Voters just chose a winner for the tenth straight election". Kitsap Sun. Retrieved November 14, 2020.
- ^ "Washington Election Results". The New York Times. November 3, 2020.
- ^ "Washington Election Results". The New York Times. November 3, 2020.
- ^ "Washington Voter Surveys: How Different Groups Voted". The New York Times. November 3, 2020. ISSN 0362-4331. Retrieved November 15, 2020.
- ^ Brazile, Liz; Browning, Paige (November 16, 2020). "This is why Native American voters in Washington state rallied behind Joe Biden". KUOW-FM. Archived from the original on November 17, 2020. Retrieved October 28, 2021.
- ^ "Gov. Inslee signs bill moving presidential primary up to March". KING. Associated Press. March 14, 2019. Retrieved June 23, 2019.
- ^ a b "Washington presidential primary ballot is set, even as Democratic field remains in flux". The Spokesman-Review. January 23, 2020.
- ^ "Washington Republican Delegation 2020". The Green Papers. Retrieved March 20, 2020.
- ^ "March 10, 2020 Presidential Primary Results – Statewide Results". Washington Secretary of State. March 27, 2020. Archived from the original on March 31, 2020. Retrieved March 31, 2020.
- ^ "Washington Republican Primary Results". USA Today. Retrieved March 31, 2020.
- ^ Taylor, Kate (February 9, 2019). "Elizabeth Warren Formally Announces 2020 Presidential Bid in Lawrence, Mass". The New York Times. Retrieved February 10, 2019.
- ^ Zhou, Li (January 21, 2019). "Kamala Harris announces her historic 2020 presidential campaign". Vox. Retrieved February 10, 2019.
- ^ Detrow, Scott (February 1, 2019). "Cory Booker Makes It Official: He's Running For President In 2020". NPR. Retrieved February 10, 2019.
- ^ Emily Birnbaum (January 27, 2019). "Howard Schultz makes Twitter debut amid 2020 speculation". The Hill. Retrieved January 27, 2019.
- ^ "March 10, 2020 Presidential Primary Results – Statewide Results". Washington Secretary of State. March 27, 2020. Archived from the original on March 31, 2020. Retrieved March 31, 2020.
- ^ "Associated Press Election Services - Delegate Tracker". Associated Press. Retrieved March 20, 2020.
- ^ "Green Party Presidential Primary". March 23, 2020.
- ^ "2020 POTUS Race ratings" (PDF). The Cook Political Report. Retrieved May 21, 2019.
- ^ "POTUS Ratings | Inside Elections". insideelections.com. Retrieved May 21, 2019.
- ^ "Larry J. Sabato's Crystal Ball » 2020 President". crystalball.centerforpolitics.org. Retrieved May 21, 2019.
- ^ "2020 Election Forecast". Politico. November 19, 2019.
- ^ "Battle for White House". RCP. April 19, 2019.
- ^ 2020 Bitecofer Model Electoral College Predictions Archived April 23, 2020, at the Wayback Machine, Niskanen Center, March 24, 2020, retrieved: April 19, 2020.
- ^ David Chalian; Terence Burlij (June 11, 2020). "Road to 270: CNN's debut Electoral College map for 2020". CNN. Retrieved June 16, 2020.
- ^ "Forecasting the US elections". The Economist. Retrieved July 7, 2020.
- ^ "2020 Election Battleground Tracker". CBS News. July 12, 2020. Retrieved July 13, 2020.
- ^ "2020 Presidential Election Interactive Map". 270 to Win.
- ^ "ABC News Race Ratings". CBS News. July 24, 2020. Retrieved July 24, 2020.
- ^ "2020 Electoral Map Ratings: Trump Slides, Biden Advantage Expands Over 270 Votes". NPR.org. Retrieved August 3, 2020.
- ^ "Biden dominates the electoral map, but here's how the race could tighten". NBC News. Retrieved August 6, 2020.
- ^ "2020 Election Forecast". FiveThirtyEight. August 12, 2020. Retrieved August 14, 2020.
- ^ "2020 Electoral College Electors". Washington Secretary of State. Retrieved November 19, 2020.
- ^ "November 3, 2020 General Election Results". Washington Secretary of State. Retrieved November 21, 2020.
- ^ Results. sos.wa.gov (Report). Archived from the original (PDF) on November 24, 2020.
External links edit
- Government Documents Round Table of the American Library Association, "Washington", Voting & Elections Toolkits
- "Washington: Election Tools, Deadlines, Dates, Rules, and Links", Vote.org, Oakland, CA
- "League of Women Voters of Washington". (State affiliate of the U.S. League of Women Voters)
- Washington at Ballotpedia