


Summary
The 2021 Pacific hurricane season was a moderately active Pacific hurricane season, with above-average activity in terms of number of named storms, but below-average activity in terms of major hurricanes,[nb 1] as 19 named storms, 8 hurricanes, and 2 major hurricanes formed in all.[nb 2][2] It also had a near-normal accumulated cyclone energy (ACE). The season officially began on May 15, 2021 in the Eastern Pacific Ocean (east of from 140°W), and on June 1, 2021, in the Central Pacific (from 140°W to the International Date Line) in the Northern Hemisphere. The season ended in both regions on November 30, 2021. These dates historically describe the period each year when most tropical cyclogenesis occurs in these regions of the Pacific and are adopted by convention.[3] However, the formation of tropical cyclones is possible at any time of the year, as illustrated by the formation of Tropical Storm Andres on May 9, which was the earliest forming tropical storm on record in the Eastern Pacific. Conversely, 2021 was the second consecutive season in which no tropical cyclones formed in the Central Pacific.
| 2021 Pacific hurricane season | |
|---|---|
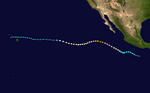
 Season summary map | |
| Seasonal boundaries | |
| First system formed | May 9, 2021 |
| Last system dissipated | November 10, 2021 |
| Strongest storm | |
| Name | Felicia |
| • Maximum winds | 145 mph (230 km/h) (1-minute sustained) |
| • Lowest pressure | 945 mbar (hPa; 27.91 inHg) |
| Seasonal statistics | |
| Total depressions | 19 |
| Total storms | 19 |
| Hurricanes | 8 |
| Major hurricanes (Cat. 3+) | 2 |
| Total fatalities | 13 total |
| Total damage | > $367 million (2021 USD) |
| Related articles | |
In June, Tropical Storm Dolores made landfall near the border of the Mexican states of Colima and Michoacán, killing three people and resulting in US$50 million[nb 3] in insured losses. Just a week later, Hurricane Enrique paralleled the west coast of Mexico, causing an additional two fatalities and a similar amount of damage. In August, Hurricane Nora made landfall on the state of Jalisco and paralleled the Pacific coast of Mexico until dissipating, resulting in an estimated $100 million in damage and three more deaths. Less than two weeks later, Hurricane Olaf made landfall on Baja California Sur as a Category 2 hurricane. In October, Hurricane Pamela struck Nayarit at Category 1 intensity, leaving four people missing and severe flooding. Later that month, Hurricane Rick struck near the Michoacán-Guerrero border at peak intensity as a strong Category 2 hurricane. Altogether, five systems made landfall in Mexico in 2021, the greatest number since 2018.[2]
Seasonal forecasts edit
| Record | Named storms |
Hurricanes | Major hurricanes |
Ref | |
|---|---|---|---|---|---|
| Average (1991–2020): | 15 | 8 | 4 | [4] | |
| Record high activity: | 1992: 27 | 2015: 16 | 2015: 11 | [5] | |
| Record low activity: | 2010: 8 | 2010: 3 | 2003: 0 | [5] | |
| Date | Source | Named storms |
Hurricanes | Major hurricanes |
Ref |
| May 12, 2021 | SMN | 14–20 | 7–10 | 4–5 | [6] |
| May 20, 2021 | NOAA | 12–18 | 5–10 | 2–5 | [7] |
| Area | Named storms |
Hurricanes | Major hurricanes |
Ref | |
| Actual activity: | EPAC | 19 | 8 | 2 | |
| Actual activity: | CPAC | 0 | 0 | 0 | |
| Actual combined activity: | 19 | 8 | 2 | ||
Forecasts include weekly and monthly changes in important factors that help determine the number of tropical storms, hurricanes, and major hurricanes within a particular year. According to the National Oceanic and Atmospheric Administration (NOAA), the average hurricane season in the Eastern and Central Pacific between 1991 and 2020 contained approximately 15 tropical storms, 8 hurricanes, and 4 major hurricanes. The NOAA generally classifies a season as above average, average, or below average based on the cumulative ACE index, but occasionally the number of tropical storms, hurricanes, and major hurricanes within a hurricane season is also considered. Factors they expected to reduce activity were near- or below-average sea surface temperatures across the eastern Pacific and the El Niño–Southern Oscillation remaining in the neutral phase, with the possibility of a La Niña developing.[7]
On May 12, 2021, the Servicio Meteorológico Nacional issued its forecast for the season, predicting a total of 14–20 named storms, 7–10 hurricanes, and 4–5 major hurricanes to develop.[6] On May 20, 2021, the National Oceanic and Atmospheric Administration (NOAA) issued their outlook, calling for a below-normal to near-normal season with 12–18 named storms, 5–10 hurricanes, 2–5 major hurricanes, and an accumulated cyclone energy index of 65% to 120% of the median.
Seasonal summary edit


The 2021 Pacific hurricane season began on May 15 in the East Pacific and on June 1 in the Central Pacific.[8] Overall activity included 19 named storms, 8 hurricanes, and 2 major hurricanes. The total of named storms was above the 1991–2020 average, while the number of hurricanes was average, and the sum of major hurricanes was below average.[9] The official start date was preceded by the formation of Tropical Storm Andres, the earliest named storm on record in the East Pacific.[10] It was accompanied by Tropical Storm Blanca later in May.[11] The following month included the formations of tropical storms Carlos and Dolores, in addition to Hurricane Enrique. While Carlos remained away from land, Dolores made landfall on the Mexico coastline and Enrique delivered impacts across southwestern sections of the country while it passed just offshore.[12] Above-average seasonal activity continued into July with the development of hurricanes Felicia and Hilda, Tropical Storm Guillermo, and Tropical Depression Nine-E; none of these cyclones impacted land.[13] In August, Hurricane Nora made landfall along the west-central coastline of Mexico. Its formation was preceded by Hurricane Linda and tropical storms Ignacio, Kevin, and Marty, which did not impact land.[14] September marked a stark turn around to the activity of the previous months, as it only featured Olaf, which struck San José del Cabo as a Category 2 hurricane.[15] Two hurricanes – Pamela and Rick – moved ashore the Mexico coastline in October.[16] An additional two storms, Terry and Sandra, developed in November, the fourth consecutive November with at least one named storm. Furthermore, those cyclones existed simultaneously, the first occurrence in the East Pacific during November on record. The Accumulated Cyclone Energy index for the 2021 Pacific hurricane season as calculated by Colorado State University using data from the National Hurricane Center was approximately 94 units,[nb 4][17] about 30 percent below average.[9]
Systems edit
Tropical Storm Andres edit
| Tropical storm (SSHWS) | |
  | |
| Duration | May 9 – May 11 |
|---|---|
| Peak intensity | 40 mph (65 km/h) (1-min); 1005 mbar (hPa) |
In early May, the passage of a convectively-coupled kelvin wave (CCKW) enhanced the eastern Pacific monsoon trough, leading to an area of disturbed weather. This disturbance interacted with a Gulf of Tehuantepec gap wind event, which led to the formation of an ill-defined low-pressure area. Despite a marginal environment of wind shear and dry air, the system slowly organized and developed into a tropical depression around 06:00 UTC on May 9. Six hours later, it intensified into Tropical Storm Andres, becoming the earliest tropical storm on record in the East Pacific basin. Andres maintained peak winds of 40 mph (65 km/h) as it curved north-northwest, and the compounded effects of colder waters and drier air atop moderate wind shear instead caused the system to begin weakening. All associated convective activity dissipated by 06:00 UTC on May 11, when Andres was downgraded to a remnant area of low pressure. The low curved west on May 12 and dissipated later that day.[10]
There are no reports of damage or casualties directly associated with Tropical Storm Andres; however, some other rainstorms associated with Andres produced heavy rainfall in Southwestern Mexico.[18][19][20] Moisture from the storm caused intense rain and even a hailstorm as far east as the State of Mexico, including in the state's capital, Toluca.[20] Vehicles became stranded in floods, some small trees got knocked over, and about 50 houses were damaged by a flooding river.[21][22] Four municipalities in the Toluca Valley were flooded; 30 cars were stranded in a flooded parking lot of a church in Metepec, and in Lerma, a shopping center's roof was damaged due to flying debris and hail.[23]
Tropical Storm Blanca edit
| Tropical storm (SSHWS) | |
  | |
| Duration | May 30 – June 3 |
|---|---|
| Peak intensity | 60 mph (95 km/h) (1-min); 998 mbar (hPa) |
Blanca originated from a tropical wave that crossed Central America on May 27. Shower and thunderstorm activity increased ahead of the wave axis, followed by the formation of a low-pressure area. After further organization, the developed into a tropical depression around 18:00 UTC on May 30. It intensified into Tropical Storm Blanca around 12:00 UTC the next day. Favorable environmental conditions allowed the cyclone to intensify, and it attained peak winds of 60 mph (95 km/h) on June 1 when prominent rainbands wrapped into the center. Thereafter, an upper-level trough off the southwestern United States increased shear over Blanca and injected dry air into the core, resulting in a weakening trend. The storm's low-level circulation became separated from convection, and it degenerated to a remnant low by 00:00 UTC on June 4. The remnants of Blanca, which were previously tracking west-northwest, curved toward the west before dissipating later the next day.[24]
Tropical Storm Carlos edit
| Tropical storm (SSHWS) | |
  | |
| Duration | June 12 – June 16 |
|---|---|
| Peak intensity | 50 mph (85 km/h) (1-min); 1003 mbar (hPa) |
A trough developed within the Intertropical Convergence Zone (ITCZ) on June 1. It moved west across the eastern Pacific for several days but failed to develop into a tropical cyclone on several occasions, either because it lacked a coherent circulation or because it lacked sustained convection. A burst of thunderstorms resulted in the formation of a well-defined center on June 12, and the system steadily organized over ensuing hours, finally resulting in the formation of a tropical depression by 12:00 UTC that day. Six hours later, the depression intensified into Tropical Storm Carlos to the southwest of Baja California Sur. The surrounding environment was initially favorable for development and allowed the system to reach peak winds of 50 mph (85 km/h) as it curves west-southwest. However, increasing dry air around the storm caused Carlos to gradually lose its convection, which ultimately resulted in its degradation to a remnant low by 12:00 UTC on June 16. The remnant system was reabsorbed into the ITCZ the following day.[25]
Tropical Storm Dolores edit
| Tropical storm (SSHWS) | |
  | |
| Duration | June 18 – June 20 |
|---|---|
| Peak intensity | 70 mph (110 km/h) (1-min); 989 mbar (hPa) |
A broad cyclonic gyre over Central America, spawned from the interaction of the monsoon trough and a tropical wave, led to the formation of an area of low pressure south of Mexico on June 16. The low gradually organized and became a tropical depression around 18:00 UTC on June 17 while located about 195 mi (315 km) south-southwest of Acapulco. The depression became Tropical Storm Dolores within six hours. Ridging over Mexico shifted east as Dolores developed, causing the cyclone to curve to the north-northwest. A favorable environment facilitated its development, and the storm reached peak winds of 70 mph (110 km/h) as it made landfall near San Juan de Alima, Michoacán, around 15:00 UTC on June 19. It harbored a well-defined eyewall at the time, and it is possible that Dolores temporarily surpassed tropical storm intensity. Once inland, though, the system quickly weakened over the high terrain of southwestern Mexico, dissipating around 06:00 UTC on June 20.[26]
Dolores produced a wide expanse of 5 in (130 mm) or greater rainfall across southwestern Mexico, including a peak accumulation of 17.31 in (440 mm) in Callejones, Colima. At least 20 municipalities in Michoacán were affected by flooding or uprooted trees, blocking many routes through these communities. In Jalisco, the Marabasco River overflowed its banks, briefly isolating 80 homes. Throughout Guerrero, Michoacán, Colima, and Jalisco, more than 50,000 customers lost power. Overall damage to more than 1,000 structures totaled in excess of $50 million. Three people were killed by lightning, two in Oaxaca and one in Jalisco.[26]
Hurricane Enrique edit
| Category 1 hurricane (SSHWS) | |
  | |
| Duration | June 25 – June 30 |
|---|---|
| Peak intensity | 90 mph (150 km/h) (1-min); 972 mbar (hPa) |
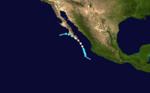
A tropical wave left Africa on June 14 and crossed Central America a week later. The system coalesced as it moved south of Mexico, becoming Tropical Storm Enrique by 12:00 UTC on June 25 since the incipient system was already producing gale-force winds at the time of development. Moderate wind shear initially inhibited the cyclone, but these unfavorable winds slackened late on June 25, allowing the cyclone to begin a 24-hour period of rapid intensification. Enrique intensified into a hurricane around 12:00 UTC on June 26 and reached peak winds of 90 mph (150 km/h) the next morning as it was characterized by a cloud-filled eye. The storm curved north and then bent back northwest, passing within 45 miles (75 km) of the Mexico coastline. Dry air off the mountainous terrain of that country, and later colder waters, soon caused Enrique to lose organization. By 18:00 UTC on June 30, the increasingly disheveled circulation was absorbed into a broad trough east of Baja California.[27]
Two people died from rip currents in Pie de la Cuesta, Guerrero.[28] At least 207 homes were damaged by landslides and winds caused by Enrique in Guerrero.[29] In Lázaro Cárdenas, Michoacán, areas were inundated by more than 50 cm (19 in) of floodwater.[30] A total of 115,904 customers lost power across Jalisco, although 96% of homes returned with power a couple of hours later.[31] A citywide power outage also occurred in Tepic.[32]
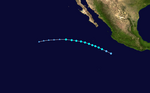
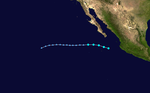
Hurricane Felicia edit
| Category 4 hurricane (SSHWS) | |
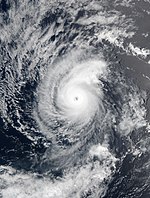  | |
| Duration | July 14 – July 20 |
|---|---|
| Peak intensity | 145 mph (230 km/h) (1-min); 945 mbar (hPa) |
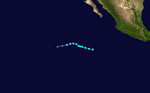
A disturbance of unclear origin was identified over Central America and the far eastern Pacific on July 9. The system progressed westward over the open ocean during the following days, developing into a tropical depression around 00:00 UTC on July 14 and becoming Tropical Storm Felicia six hours later. Felicia immediately underwent rapid intensification, becoming a hurricane by 06:00 UTC on July 15 and a major hurricane 24 hours later. Early on July 17, the system attained peak winds of 145 mph (235 km/h).[33] At that time, Felicia displayed a warm eye encapsulated by a ring of −70 °C (−94 °F) convection and little additional rainbands outside the eyewall, a signature sign of an annular tropical cyclone.[34] It was also a very small storm, with hurricane-force winds extending only 15 miles (25 km) from the center. After a brief westward turn, Felicia resumed a west-northwestward motion into much more hostile environmental conditions on July 18. The cyclone rapidly weakened and degenerated to a remnant low by 18:00 UTC on July 20 while located well east of Hawaii. Low-level wind flow steered the remnant low of Felicia to the west-southwest, and it opened into a trough two days later.[33]
Tropical Storm Guillermo edit
| Tropical storm (SSHWS) | |
  | |
| Duration | July 17 – July 19 |
|---|---|
| Peak intensity | 60 mph (95 km/h) (1-min); 999 mbar (hPa) |
A tropical wave moved off the coast of Africa on July 6 and emerged into the eastern Pacific basin a week later, where the background environment already favored cyclonic spin. Consequently, a disturbance spawned along the wave axis developed into a tropical depression by 00:00 UTC on July 17 and further into Tropical Storm Guillermo within twelve hours. A potent ridge pushed the cyclone west-northwest, while a favorable combination of low wind shear and very warm ocean temperatures allowed it to intensify. Guillermo reached peak winds of 60 mph (95 km/h) on July 18 despite a slightly less organized satellite appearance. Around this time, the storm produced tropical storm-force gusts on Socorro and Clarion islands. After its peak, Guillermo encountered cooler waters and higher wind shear, which ultimately caused it to degenerate to a remnant low by 00:00 UTC on July 20. The low moved faster to the west-southwest before it was absorbed by a trough a day later far away from land.[35]
Hurricane Hilda edit
| Category 1 hurricane (SSHWS) | |
  | |
| Duration | July 30 – August 6 |
|---|---|
| Peak intensity | 85 mph (140 km/h) (1-min); 985 mbar (hPa) |
On July 24, a disturbance formed near south of Gulf of Tehuantepec, which was moving parallel offshore of southern Mexico.[36] As it moved farther from the coast of Mexico, the disturbance gradually became organized, and on July 28, a low pressure area formed,[37] as satellite imagery showed that the associated shower activity was showing signs of organization.[38] The low-pressure area further organized, with a pair of ASCAT passes showing that the low-pressure area had strengthened significantly and was producing tropical storm-force winds, with the circulation looking well-defined on satellite imagery. On July 30, it was designated as a tropical storm.[39] Hilda intensified to a high-end tropical storm a day later as a central dense overcast developed.[40] Later, Hilda further intensified to a hurricane as a short-lived eye appeared in its central dense overcast.[41] Hilda held a similar appearance the next day, with its center located north of its central dense overcast.[42] Hilda briefly developed a closed mid-level eye the next day, though the low-level and mid-level centers were not stacked due to wind shear.[43] However, it became less organized later that day, with a less distinct eye and an incomplete eyewall.[44] By the next day, Hilda was downgraded to a high-end tropical storm since the eyewall was no longer well-defined, while convection continued to pulse in the southern semicircle.[45] Deep convection continued to wane due to shear, cooler waters, and more stable air.[46] By August 5, Hilda weakened into a tropical depression after a rapid weakening of convection near the center. However, convection resumed pulsing later.[47] On August 6, at 03:00 UTC, Hilda became a post-tropical cyclone, as it became devoid of deep convection due to sub-23 °C (73 °F) sea-surface temperatures.[48][49]
Tropical Storm Jimena edit
| Tropical storm (SSHWS) | |
  | |
| Duration | July 30 – August 6 |
|---|---|
| Peak intensity | 40 mph (65 km/h) (1-min); 1004 mbar (hPa) |
On July 26, the NHC noted a disturbance located about 700 miles (1,125 km) south-southwest of the southern tip of Baja California. The system moved parallel to another disturbance which later became Hurricane Hilda.[50] By 21:00 UTC on July 30, the disturbance attained a well-defined center of circulation with sufficient organized convection and was classified as a tropical depression, bearing the designation Nine-E.[51] The depression was initially forecast to become a tropical storm, but failed to do so due to dry air and wind shear caused by nearby Hurricane Hilda. Early on August 1, the system degenerated into a remnant low.[52] Even though Nine-E was a tropical low, the NHC still monitored the system for further development[53] On August 4, it re-intensified into a tropical depression again while maintaining two rainbands in a slightly elongated circulation.[54] On the next day, at 09:00 UTC, the depression intensified into a tropical storm, with the NHC naming it as Jimena, as the storm's deep convection had increased near the low-level center and based on satellite imagery, the storm was producing tropical storm force winds.[55] The convection later diminished on August 6, as it moved over cooler sea-surface temperatures and encountering high wind shear and dry airmass. However, despite all this, Jimena managed its intensity, as it continued to produce tropical storm force winds, based on ASCAT data.[56] A deep convective mass also continued to persist over the center of Jimena.[57] At 21:00 UTC, the NHC issued its last advisory, downgrading the system to a tropical depression as it entered the CPHC's area of responsibility. Its deep convection weakened significantly as it moved over cool sea surface temperatures causing Jimena to weaken.[58] The CPHC later issued its only bulletin for Jimena at 03:00 UTC the next day, stating that Jimena had become a post-tropical cyclone as its deep convection had collapsed completely.[59]
Tropical Storm Ignacio edit
| Tropical storm (SSHWS) | |
  | |
| Duration | August 1 – August 3 |
|---|---|
| Peak intensity | 40 mph (65 km/h) (1-min); 1004 mbar (hPa) |
A parade of tropical waves entered the eastern Pacific in late July. By 12:00 UTC on August 1, one wave spawned a disturbance that had gained sufficient organization to be designated a tropical depression. Moderately wind shear inhibited the newly formed system, and though it intensified into Tropical Storm Ignacio a day later, the system failed to organize beyond that strength as its low-level circulation became separated from associated convective activity. Around this time, the system produced tropical storm-force gusts on Socorro Island. Later on August 2, Ignacio began to succumb to increasingly dry air and cooler waters. It degenerated to a remnant low around 00:00 UTC on August 4, which moved erratically until it dissipated southwest of Baja California twelve hours later.[60]
Tropical Storm Kevin edit
| Tropical storm (SSHWS) | |
  | |
| Duration | August 7 – August 12 |
|---|---|
| Peak intensity | 65 mph (100 km/h) (1-min); 994 mbar (hPa) |
A tropical wave entered the eastern Pacific on August 1, and the resultant disturbance organized into a tropical depression around 12:00 UTC on August 7. The newly formed cyclone swiftly intensified amid very high mid-level moisture and ocean temperatures, becoming Tropical Storm Kevin six hours later and reaching peak winds of 65 mph (100 km/h) on August 8. Wind shear abruptly increased later that day, confining the storm's convection into the western semicircle. Kevin passed near Clarion Island on August 10 as it moved west then west-northwest, producing tropical storm-force gusts there. By 12:00 UTC on August 12, all associated convection dissipated, and the system degenerated to a remnant low. The low curved northwest and dissipated west of Baja California Sur on August 15.[61]
Hurricane Linda edit
| Category 4 hurricane (SSHWS) | |
  | |
| Duration | August 10 – August 19 |
|---|---|
| Peak intensity | 130 mph (215 km/h) (1-min); 953 mbar (hPa) |
A tropical wave moved into the eastern Pacific on August 6, spawning an area of disturbed weather that subsequently became a tropical depression around 06:00 UTC on August 10. It moved generally westward, intensifying into Tropical Storm Linda six hours later and organizing further beyond that point, but temporarily succumbing to some dry air and wind shear. As those factors subsided, Linda strengthened into a hurricane on August 12 and soon began rapidly intensifying over warm ocean waters, a process that culminated in it becoming the season's second and final major hurricane by 18:00 UTC on August 13. The next day, Linda peaked as a Category 4 cyclone with winds of 130 mph (215 km/h). Between August 14–15, the storm underwent an eyewall replacement cycle. Much like Hurricane Felicia, Linda soon acquired characteristics of an annular hurricane, with a 45 mi (75 km) wide eye surrounded by deep, symmetric convection and little additional banding. The hurricane fluctuated in intensity over the next few days as it moved over varying ocean temperatures and through drier air. Late on August 18, Linda progressed over ocean waters cooler than 26 °C (79 °F), which led to rapid weakening. The system ultimately degenerated to a gale-force remnant low by 18:00 UTC on August 19. It later crossed into the Central Pacific basin.[62]
The remnant low later traversed Hawaii on August 22–23, dropping 2 to 7 in (51 to 178 mm) of rain across several islands. The greatest rainfall totals were: 7.12 in (181 mm) at Mount Waialeale, Kauai, and 7.10 in (180 mm) at Manoa Lyon Arboretum, Oahu. Oahu was also buffeted by winds in excess of 30 mph (45 km/h) on August 23, with a peak gust of 56 mph (90 km/h) recorded near Kaena Point.[63]
Tropical Storm Marty edit
| Tropical storm (SSHWS) | |
  | |
| Duration | August 23 – August 24 |
|---|---|
| Peak intensity | 45 mph (75 km/h) (1-min); 1002 mbar (hPa) |
The Atlantic's Hurricane Grace struck mainland Mexico as a Category 3 hurricane on August 21. Although that storm's low-level center dissipated over the mountainous terrain of Mexico, its mid-level circulation emerged into the eastern Pacific and soon became encompassed by deep convection. That thunderstorm activity spawned a new surface center separate from Grace's previous one, and further organization of the disturbance led to the formation of Tropical Storm Marty by 00:00 UTC on August 23. The newly christened tropical storm reached peak winds of 45 mph (75 km/h) early on August 23, but it began to weaken shortly thereafter as wind shear increased. Marty moved west as it encountered an increasingly hostile environment of dry air and cooler waters, resulting its degeneration to a remnant low by 06:00 UTC on August 24. Three days later, it dissipated into a trough well to the west-southwest of Baja California Sur.[64]
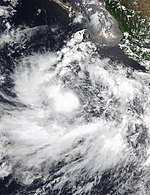
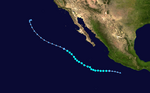
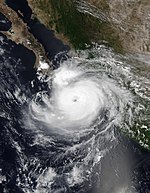
Hurricane Nora edit
| Category 1 hurricane (SSHWS) | |
  | |
| Duration | August 25 – August 30 |
|---|---|
| Peak intensity | 85 mph (140 km/h) (1-min); 976 mbar (hPa) |
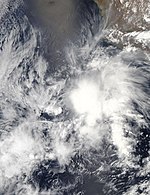
On August 19, an area of disturbed weather formed west of the southern Mexico coast, which was producing disorganized thunder storms.[65] A day later, the system became better defined and signs of the organization of showers and thunderclouds were also noted.[66] On August 25, at 11:00 UTC the system developed a well-defined circulation as a scatterometer pass showed that it was producing near tropical storm-force winds. Thus, the NHC designated the system as Tropical Depression Fourteen-E.[67] A day later at 17:00 UTC, Fourteen-E intensified into a tropical storm, with the NHC naming it as Nora as its deep convection had organized significantly along with improved curvature of its bands.[68] On August 28, at 11:00 UTC, Nora intensified into a Category 1 hurricane, as its inner core structure became further defined with the formation of a low-level eyewall.[69] Nora made landfall on Jalisco, after which it skirted the coasts of Nayarit and Sinaloa as a weakening storm and rapidly dissipated on August 30 as it moved further inland. It brought considerable damage to Mexico, killing two people and leaving six missing due to a landslide in Cabo Corrientes.[70][71] It had also caused flooding and mudslides. The damage caused by the passage through Nora to the country reached 200 million pesos (US$10 million).[72] Nora's remnants caused heavy rain in Arizona,[73] Colorado, and Utah.[74]
Hurricane Olaf edit
| Category 2 hurricane (SSHWS) | |
  | |
| Duration | September 7 – September 11 |
|---|---|
| Peak intensity | 105 mph (165 km/h) (1-min); 975 mbar (hPa) |
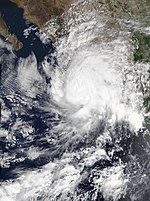
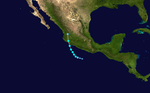
A tropical wave moved off Africa on August 22. It fractured twice over subsequent days, with portions of the original wave axis spawning tropical storms Kate and Mindy in the Atlantic. The southern piece of the wave continued into the East Pacific on September 2, where it led to the formation of a new tropical depression around 18:00 UTC on September 7 about 230 mi (370 km) west-southwest of Manzanillo, Colima. The system drifted toward the northwest in weak steering currents, while favorable environmental parameters allowed it to intensify. The depression became Tropical Storm Olaf around 12:00 UTC on September 8, and Olaf became a hurricane 24 hours later. The cyclone's eye and overall presentation continued to improve into September 10, and Olaf reached its peak as a Category 2 hurricane with winds of 105 mph (165 km/h) at 02:50 UTC that day. It concurrently made landfall near San Jose del Cabo, Baja California Sur. The storm only slowly weakened over land, but this process accelerated as it continued into stable air offshore. It curved west and degenerated to a remnant low around 06:00 UTC on September 11. The low continued in that direction for another day before dissipating.[75]
As Olaf paralleled the Mexico coastline, it produced rainfall totals up to 4 in (100 mm) across Jalisco, which resulted in localized flooding. One man died there following a mudslide. Rainfall accumulations were generally similar across the Baja California Peninsula, though a peak value of 9.27 in (235 mm) was observed in El Triunfo. Many weather stations near Olaf's landfall location lost power upon the storm's final approach, but widespread tropical storm-force winds were nevertheless recorded. The strong winds damaged hotels, uprooted trees, and downed power lines. More than 190,000 customers across the Baja California Peninsula were without power at the height of the storm. Total damage was estimated at $10 million, primarily focused in La Paz and Los Cabos.[75]
Hurricane Pamela edit
| Category 1 hurricane (SSHWS) | |
  | |
| Duration | October 10 – October 13 |
|---|---|
| Peak intensity | 75 mph (120 km/h) (1-min); 987 mbar (hPa) |
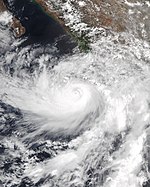
A tropical wave emerged into the eastern Pacific on October 8, and it swiftly organized into a tropical depression by 06:00 UTC on October 10. The system moved west-northwest, tracking parallel to the Mexico coastline initially after formation, and intensified into Tropical Storm Pamela six hours later.[76] Throughout Pamela's duration, the NHC highlighted the expectation of a potentially major hurricane rapidly intensifying up to the Mexico coastline.[77] Despite these projections, the storm suffered first from moderate northerly wind shear and later from dry air intrusions, which caused the storm to fluctuate in intensity over the coming days. It became a hurricane around 06:00 UTC on October 12, weakened thereafter, and regained hurricane strength early the next day. Pamela maintained winds of 75 mph (120 km/h) as it recurved northeast ahead of a broad upper-level trough, and it made landfall at that intensity just north of Mazatlán, Sinaloa, at 12:30 UTC on October 13. Topographical and environmental effects caused Pamela to rapidly dissipate shortly before 00:00 UTC on October 14 over northern Mexico.[76]
Although Pamela made landfall in a remote location, its effects were spread across large portions of northwestern Mexico. Across Colima and Nayarit, widespread rainfall accumulations of 4–8 in (100–200 mm) – with isolated totals up to 12 in (300 mm) – caused widespread flooding.[76] Numerous local communities were inundated or isolated,[78] with individuals stranded and highways collapsed.[79][80] Crops suffered heavy losses.[81] Gusty winds across Sinaloa damaged structures, either directly or from the uprooting of many trees.[82] Across the Southern United States, the remnants of Pamela combined with a cold front, leading to a widespread area of 3–6 in (76–152 mm) rainfall totals, with locally higher amounts. Three people were killed as a result of Pamela, two in Texas when vehicles fell off a bridge into the Martinez Creek near San Antonio and one in Nayarit when one person was swept away into the Acaponeta River.[76][80]
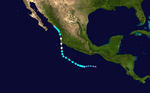
Hurricane Rick edit
| Category 2 hurricane (SSHWS) | |
  | |
| Duration | October 22 – October 25 |
|---|---|
| Peak intensity | 105 mph (165 km/h) (1-min); 977 mbar (hPa) |
A collection of convection formed over Colombia, Panama, and adjacent waters of the Caribbean and East Pacific on October 16. The disturbance moved west without much change in organization until it developed into a tropical depression early on October 22. The system strengthened into Tropical Storm Rick within six hours of formation and continued to intensify amid very favorable environmental conditions as it moved generally north-northwest. Rick became a hurricane early on October 23, around which time the system developed a pinhole eye in microwave imagery. After reaching winds of 90 mph (150 km/h), the system abruptly weakened as its inner core structure eroded. However, the cyclone soon developed a large eye, and it reached a peak intensity of 105 mph (165 km/h) early on October 25. Rick maintained these winds as it made landfall in La Unión de Isidoro Montes de Oca, Guerrero, around 11:00 UTC. The storm weakened rapidly once inland and dissipated before 00:00 UTC on October 26.[83]
Rick produced at least 4 in (100 mm) of rain across coastal sections of Guerrero and Michoacán, with a peak accumulation of 11.06 in (281 mm) in Petacalco and Coyuquilla in Guerrero. These rains prompted flash flooding that stranded cars and caused damage throughout the region, even well inland across the state of Morelos where one man was killed in Tepoztlán. Four rivers and streams overrun their banks across Zihuatanejo and Tecpan de Galeana, including the Petatlán River which cut off the Acapulco–Zihuatanejo federal highway. Many large trees were uprooted and some damage occurred to buildings between Ixtapa and Lázaro Cárdenas. Rick prompted the evacuation of 402 people and damaged 1,277 houses across 11 states and 700 municipalities. Nearly 184,000 homes lost power, especially concentrated in the states of Michoacán and Guerrero. Tens of millions worth in damage occurred.[83]
Tropical Storm Terry edit
| Tropical storm (SSHWS) | |
  | |
| Duration | November 4 – November 10 |
|---|---|
| Peak intensity | 40 mph (65 km/h) (1-min); 1006 mbar (hPa) |
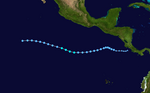
During the morning of November 1, a low pressure system formed over the southwestern Caribbean Sea, just north of Panama.[84] The wave crossed Costa Rica and emerged into the eastern Pacific on November 3.[85] Convection swiftly organized as the system gradually became better defined that day, and the disturbance developed into Tropical Depression Eighteen-E at 15:00 UTC on November 4.[86][87] However, dry air (some of which came from a Gulf of Tehuantepec gap wind event) entrained into the storm, keeping it weak and disorganized.[88] The system remained disorganized while moving westward for the next few days, before organizing into Tropical Storm Terry at 21:00 UTC on November 7.[89] However, Terry weakened to a tropical depression at 15:00 UTC on November 8 as it became less organized.[90] Terry's circulation became better defined later that day, though its convection remained poorly organized. At 06:00 UTC on November 10, the depression opened up into a trough of low pressure.[91]
Terry briefly affected Costa Rica and damaged around 11 houses and knocking over few trees. No fatalities were reported in Costa Rica but Terry's low form brought damage to Panama as well, injuring 1 person.[92] One yellow alert was issued in Mexico though there was no damage there.[93] As a depression, a green alert was issued in the Revillagigedo Islands though it was discontinued a few hours later.[94]
Tropical Storm Sandra edit
| Tropical storm (SSHWS) | |
  | |
| Duration | November 7 – November 9 |
|---|---|
| Peak intensity | 40 mph (65 km/h) (1-min); 1005 mbar (hPa) |
At 19:00 UTC on November 1, the NHC began monitoring an area that was expected to develop into an area of low pressure several miles south of the southwestern coast of Mexico.[95] The system organized further by 01:00 UTC on November 3,[96] and further development prompted the NHC to begin issuing advisories on Tropical Depression Nineteen-E at 15:00 UTC on November 7.[97][98] At 21:00 UTC on November 7, the depression was upgraded into a tropical storm based on scatterometer data, despite the storm's appearance degrading, and the NHC assigned the storm the name Sandra.[99] However, Sandra weakened into a tropical depression 24 hours later, after scatterometer data failed to find tropical storm-force winds.[100] At 21:00 UTC on November 9, Sandra degenerated into a remnant low, after the storm's surface circulation was found to have opened up into a trough of low pressure.[101]
Storm names edit
The following list of names was used for named storms that formed in the North Pacific Ocean east of 140°W during 2021.[102] This is the same list used in the 2015 season, with the exception of the name Pamela, which replaced Patricia.[103] The name Pamela was used for the first time this year. No names were retired following the season, so this list will be used again for the 2027 season.
|
For named storms that form in the Central Pacific Hurricane Center's area of responsibility, encompassing the North Pacific between 140°W and the International Date Line, the names come from a series of four rotating lists. Names are used one after the other without regard to year, and when the bottom of one list is reached, the next named storm receives the name at the top of the next list.[102] No storms formed within the area in 2021. Named storms in the table above that crossed into the area during the season are noted (*).[104]
Season effects edit
This is a table of all of the storms that formed in the 2021 Pacific hurricane season. It includes their name, duration, peak classification and intensities, areas affected, damage, and death totals. Deaths in parentheses are additional and indirect (an example of an indirect death would be a traffic accident), but were still related to that storm. Damage and deaths include totals while the storm was extratropical, a wave, or a low, and all of the damage figures are in 2021 USD.
| Saffir–Simpson scale | ||||||
| TD | TS | C1 | C2 | C3 | C4 | C5 |
| Storm name |
Dates active | Storm category at peak intensity |
Max 1-min wind mph (km/h) |
Min. press. (mbar) |
Areas affected | Damage (USD) |
Deaths | Ref(s) | ||
|---|---|---|---|---|---|---|---|---|---|---|
| Andres | May 9–11 | Tropical storm | 40 (65) | 1005 | Southwestern Mexico | Minimal | None | [19] | ||
| Blanca | May 30– June 3 | Tropical storm | 60 (95) | 998 | None | None | None | |||
| Carlos | June 12–16 | Tropical storm | 50 (85) | 1003 | None | None | None | |||
| Dolores | June 18–20 | Tropical storm | 70 (110) | 989 | Southwestern Mexico, Western Mexico | $50 million | 3 | [105][106][107] | ||
| Enrique | June 25–30 | Category 1 hurricane | 90 (150) | 972 | Western Mexico, Southwestern Mexico, Baja California Peninsula | $50 million | 2 | [107] | ||
| Felicia | July 14–20 | Category 4 hurricane | 145 (230) | 945 | None | None | None | |||
| Guillermo | July 17–19 | Tropical storm | 60 (95) | 999 | Revillagigedo Islands | None | None | |||
| Hilda | July 30 – August 6 | Category 1 hurricane | 85 (140) | 985 | None | None | None | |||
| Jimena | July 30 – August 6 | Tropical storm | 40 (65) | 1004 | None | None | None | |||
| Ignacio | August 1–3 | Tropical storm | 40 (65) | 1004 | Revillagigedo Islands | None | None | |||
| Kevin | August 7–12 | Tropical storm | 65 (100) | 994 | Revillagigedo Islands | None | None | |||
| Linda | August 10–19 | Category 4 hurricane | 130 (215) | 953 | Hawaii | Minimal | None | |||
| Marty | August 23–24 | Tropical storm | 45 (75) | 1002 | None | None | None | |||
| Nora | August 25–30 | Category 1 hurricane | 85 (140) | 976 | Western Mexico | $125 million | 3 | [108][70] | ||
| Olaf | September 7–11 | Category 2 hurricane | 105 (165) | 975 | Baja California Peninsula | $19 million | 1 | [109] | ||
| Pamela | October 10–13 | Category 1 hurricane | 75 (120) | 987 | Revillagigedo Islands, Western Mexico, Baja California Peninsula, Northwestern Mexico, Southern United States | >$97 million | 3 | [110] | ||
| Rick | October 22–25 | Category 2 hurricane | 105 (165) | 977 | Central America, Southwestern Mexico, Northwestern Mexico | >$26.1 million | 1 | [110] | ||
| Terry | November 4–10 | Tropical storm | 40 (65) | 1006 | Costa Rica, Panama | Unknown | None | |||
| Sandra | November 7–9 | Tropical storm | 40 (65) | 1005 | None | None | None | |||
| Season aggregates | ||||||||||
| 19 systems | May 9 – November 10 | 145 (230) | 945 | >$367 million | 13 | |||||
See also edit
- Weather of 2021
- Tropical cyclones in 2021
- Pacific hurricane season
- List of Pacific hurricane records
- 2021 Atlantic hurricane season
- 2021 Pacific typhoon season
- 2021 North Indian Ocean cyclone season
- South-West Indian Ocean cyclone seasons: 2020–21, 2021–22
- Australian region cyclone seasons: 2020–21, 2021–22
- South Pacific cyclone seasons: 2020–21, 2021–22
Notes edit
- ^ Hurricanes reaching Category 3 (1-minute sustained winds higher than 110 miles per hour (178 km/h)) on Saffir–Simpson scale are described as major hurricanes,[1]
- ^ The National Hurricane Center 1991-2020 seasonal averages for a Pacific hurricane season are 15 named storms, 8 hurricanes, and 4 major hurricanes.[2]
- ^ All damage totals are valued as of 2021 and in United States dollars, unless otherwise noted.
- ^ The total represents the sum of the squares of the maximum sustained wind speed (knots) for every (sub)tropical storm's intensity of over 33 knots (38 mph, 61 km/h), divided by 10,000 while they are above that threshold; therefore, tropical depressions are not included.
References edit
- ^ "Saffir-Simpson Hurricane Wind Scale". Miami, Florida: National Hurricane Center. Retrieved July 17, 2023.
- ^ a b c Masters, Jeff; Hanson, Bob (October 24, 2021). "Category 1 Hurricane Rick poised for a Monday morning landfall in southwestern Mexico". New Haven, Connecticut: Yale Climate Connections. Retrieved May 27, 2022.
- ^ "Hurricane Season Information". Frequently Asked Questions About Hurricanes. Miami, Florida: NOAA Atlantic Oceanographic and Meteorological Laboratory. June 1, 2018. Retrieved May 28, 2022.
- ^ "Background Information: East Pacific Hurricane Season". Climate Prediction Center. College Park, Maryland: National Oceanic and Atmospheric Administration. May 20, 2021. Retrieved May 20, 2021.
- ^ a b "Northeast Pacific Ocean Historical Tropical Cyclone Statistics". Fort Collins, Colorado: Colorado State University. Retrieved August 8, 2023.
- ^ a b "Pronóstico para la Temporada de Ciclones Tropicales 2021". YouTube.com.
- ^ a b "NOAA 2021 Eastern Pacific Hurricane Season Outlook". Climate Prediction Center. May 20, 2021. Archived from the original on May 28, 2020. Retrieved May 20, 2021.
- ^ Neal Dorst. When is hurricane season? (Report). Atlantic Oceanographic and Meteorological Laboratory. Archived from the original on December 6, 2010. Retrieved November 25, 2010.
- ^ a b Hurricane Specialist Unit (December 1, 2021). "Monthly Tropical Weather Summary for November 2021". Miami, Florida: National Hurricane Center. Retrieved December 26, 2021.
- ^ a b Stacy R. Stewart (June 30, 2021). Tropical Cyclone Report: Tropical Storm Andres (PDF) (Report). Miami, Florida: National Hurricane Center. Retrieved August 29, 2021.
- ^ Hurricane Specialist Unit (June 1, 2021). "Monthly Tropical Weather Summary for May 2021". Miami, Florida: National Hurricane Center. Retrieved December 26, 2021.
- ^ Hurricane Specialist Unit (July 1, 2021). "Monthly Tropical Weather Summary for June 2021". Miami, Florida: National Hurricane Center. Retrieved December 26, 2021.
- ^ Hurricane Specialist Unit (August 1, 2021). "Monthly Tropical Weather Summary for July 2021". Miami, Florida: National Hurricane Center. Retrieved December 26, 2021.
- ^ Hurricane Specialist Unit (September 1, 2021). "Monthly Tropical Weather Summary for August 2021". Miami, Florida: National Hurricane Center. Retrieved December 26, 2021.
- ^ Hurricane Specialist Unit (October 1, 2021). "Monthly Tropical Weather Summary for September 2021". Miami, Florida: National Hurricane Center. Retrieved December 26, 2021.
- ^ Hurricane Specialist Unit (November 1, 2021). "Monthly Tropical Weather Summary for October 2021". Miami, Florida: National Hurricane Center. Retrieved December 26, 2021.
- ^ "Basin Archives: Northeast Pacific Ocean Historical Tropical Cyclone Statistics". Fort Collins, Colorado: Colorado State University. Retrieved July 8, 2022.
- ^ Óscar Barrón (May 9, 2021). "Pronóstico del clima de hoy: se esperan lluvias por depresión tropical UNO-E del Pacífico". Debate (in Spanish). Retrieved May 9, 2021.
- ^ a b Juan Antonio Palma (May 7, 2021). "Tormentas y probable formación ciclónica para este fin de semana". Meteored.mx | Meteored (in Mexican Spanish). Retrieved May 9, 2021.
- ^ a b "SE FORMA ANDRES!". Noticias Va de Nuez (in Spanish). May 9, 2021. Retrieved May 9, 2021.
- ^ "Tormenta inunda estacionamiento en Metepec; reportan afectaciones en Toluca". www.msn.com (in European Spanish). May 10, 2021. Retrieved May 10, 2021.
- ^ "Tormenta de granizo en Toluca deja calles y casas inundadas". EL IMPARCIAL | Noticias de México y el mundo (in European Spanish). May 10, 2021. Retrieved May 10, 2021.
- ^ "Se adelanta temporada de ciclones". El Heraldo de Aguascalientes (in Spanish). May 10, 2021. Retrieved May 10, 2021.
- ^ Brad J. Reinhart (October 4, 2021). Tropical Cyclone Report: Tropical Storm Blanca (PDF) (Report). Miami, Florida: National Hurricane Center. Retrieved December 25, 2021.
- ^ Daniel P. Brown (December 14, 2021). Tropical Cyclone Report: Tropical Storm Carlos (PDF) (Report). Miami, Florida: National Hurricane Center. Retrieved December 25, 2021.
- ^ a b Philippe P. Papin (January 5, 2022). Tropical Cyclone Report: Tropical Storm Dolores (PDF) (Report). Miami, Florida: National Hurricane Center. Retrieved January 14, 2022.
- ^ Andy Latto (November 2, 2021). Tropical Cyclone Report: Hurricane Enrique (PDF) (Report). Miami, Florida: National Hurricane Center. Retrieved December 25, 2021.
- ^ Hugo Valencia (June 26, 2021). "Huracán 'Enrique' causa 2 muertos en las costas de Guerrero". Noticieros Televisa. Retrieved June 27, 2021.
- ^ "Huracán Enrique dañó 207 casas y causó 28 derrumbes a su paso por Guerrero". López-Dóriga Digital (in Mexican Spanish). June 27, 2021. Retrieved June 27, 2021.
- ^ Demos, Editorial; corresponsal, Ernesto Martínez Elorriaga. "La Jornada - Huracán 'Enrique' provoca inundaciones en Lázaro Cárdenas, Michoacán". www.jornada.com.mx (in Spanish). Retrieved June 28, 2021.
- ^ Staff, Forbes (June 26, 2021). "CFE restablece suministro eléctrico al 96% de usuarios afectados en Jalisco por tormenta 'Enrique'". Forbes México (in Mexican Spanish). Retrieved June 27, 2021.
- ^ Demos, Editorial; corresponsal, Myriam Navarro (June 21, 2021). "La Jornada - Huracán 'Enrique' deja inundaciones y daños materiales en Tepic". www.jornada.com.mx (in Spanish). Retrieved June 27, 2021.
- ^ a b John P. Cangialosi (September 9, 2021). Tropical Cyclone Report: Hurricane Felicia (PDF) (Report). Miami, Florida: National Hurricane Center. Retrieved September 29, 2021.
- ^ Philippe P. Papin; John L. Beven II (July 16, 2021). "Hurricane Felicia Discussion Number 13". Miami, Florida: National Hurricane Center. Retrieved December 25, 2021.
- ^ Stacy R. Stewart (August 15, 2021). National Hurricane Center Tropical Cyclone Report: Tropical Storm Guillermo (PDF) (Report). Miami, Florida: National Hurricane Center. Retrieved August 29, 2021.
- ^ Eric Blake (July 24, 2021). "Five Day Graphical Tropical Cyclone Outlook". www.nhc.noaa.gov. Miami, Florida: National Hurricane Center. Retrieved July 30, 2021.
- ^ Jack Beven (July 28, 2021). "Five Day Graphical Tropical Cyclone Outlook". www.nhc.noaa.gov. Miami, Florida: National Hurricane Center. Retrieved July 30, 2021.
- ^ Jack Beven (July 28, 2021). "Five Day Graphical Tropical Cyclone Outlook". www.nhc.noaa.gov. Miami, Florida: National Hurricane Center. Retrieved July 30, 2021.
- ^ John Cangialosi (July 30, 2021). "Tropical Storm Hilda Discussion Number 1". www.nhc.noaa.gov. Miami, Florida: National Hurricane Center. Retrieved July 30, 2021.
- ^ John Cangialosi (July 31, 2021). "Tropical Storm Hilda Advisory Number 4". www.nhc.noaa.gov. Miami, Florida: National Hurricane Center. Retrieved July 31, 2021.
- ^ Jack Beven (July 31, 2021). "Hurricane Hilda Discussion Number 6". www.nhc.noaa.gov. Miami, Florida: National Hurricane Center. Retrieved July 31, 2021.
- ^ Eric Blake (August 1, 2021). "Hurricane Hilda Discussion Number 9". www.nhc.noaa.gov.
- ^ Robbie Berg (August 2, 2021). "Hurricane Hilda Discussion Number 11". www.nhc.noaa.gov. Miami, Florida: National Hurricane Center. Retrieved August 2, 2021.
- ^ Eric Blake (August 2, 2021). "Hurricane Hilda Discussion Number 13". www.nhc.noaa.gov. Miami, Florida: National Hurricane Center. Retrieved August 3, 2021.
- ^ Philippe Papin; Daniel Brown (August 3, 2021). "Tropical Storm Hilda Discussion Number 15". www.nhc.noaa.gov. Miami, Florida: National Hurricane Center. Retrieved August 3, 2021.
- ^ Eric Blake (August 3, 2021). "Tropical Storm Hilda Discussion Number 17". www.nhc.noaa.gov. Miami, Florida: National Hurricane Center. Retrieved August 3, 2021.
- ^ Stacy Stewart (August 5, 2021). "Tropical Depression Hilda Discussion Number 24". nhc.noaa.gov. Miami, Florida: National Hurricane Center. Retrieved August 5, 2021.
- ^ Dave Roberts (August 6, 2021). "Post-Tropical Cyclone Hilda Advisory Number 28". nhc.noaa.gov. Miami, Florida: National Hurricane Center. Retrieved August 6, 2021.
- ^ Dave Roberts (August 6, 2021). "Post-Tropical Cyclone Hilda Discussion Number 28". nhc.noaa.gov. Miami, Florida: National Hurricane Center. Retrieved August 6, 2021.
- ^ Brad Reinhart; Richard Pasch (July 26, 2021). "Five Day Graphical Tropical Weather Outlook". www.nhc.noaa.gov. Miami, Florida: National Hurricane Center. Retrieved July 31, 2021.
- ^ Dave Roberts (July 31, 2021). "Tropical Depression Nine-E Discussion Number 1". www.nhc.noaa.gov. Miami, Florida: National Hurricane Center. Retrieved August 1, 2021.
- ^ Daniel Brown (August 2, 2021). "Post-Tropical Cyclone Nine-E Advisory Number 7". www.nhc.noaa.gov. Miami, Florida: National Hurricane Center. Retrieved August 2, 2021.
- ^ Stacy Stewart (August 2, 2021). "Five Day Graphical Tropical Weather Outlook". nhc.noaa.gov. Miami, Florida: National Hurricane Center. Retrieved August 2, 2021.
- ^ Eric Blake (August 4, 2021). "Tropical Depression Nine-E Discussion Number 8". nhc.noaa.gov. Miami, Florida: National Hurricane Center. Retrieved August 4, 2021.
- ^ Jack Beven (August 4, 2021). "Tropical Storm Jimena Discussion Number 10". nhc.noaa.gov. Miami, Florida: National Hurricane Center. Retrieved August 5, 2021.
- ^ Jack Beven (August 6, 2021). "Tropical Storm Jimena Discussion Number 14". nhc.noaa.gov. Miami, Florida: National Hurricane Center. Retrieved August 6, 2021.
- ^ Andrew Hagen; Daniel Brown (August 6, 2021). "Tropical Storm Jimena Discussion Number 15". nhc.noaa.gov. Miami, Florida: National Hurricane Center. Retrieved August 6, 2021.
- ^ Andrew Hagen; Daniel Brown (August 6, 2021). "Tropical Storm Jimena Discussion Number 16". nhc.noaa.gov. Miami, Florida: National Hurricane Center. Retrieved August 7, 2021.
- ^ Derek Wroe (August 7, 2021). "Tropical Storm Jimena Discussion Number 17". nhc.noaa.gov. Honolulu, Hawaii: Central Pacific Hurricane Center. Retrieved August 7, 2021.
- ^ John L. Beven II; Christopher W. Landsea (November 5, 2021). Tropical Cyclone Report: Tropical Storm Ignacio (PDF) (Report). Miami, Florida: National Hurricane Center. Retrieved December 25, 2021.
- ^ Stacy R. Stewart (December 2, 2021). Tropical Cyclone Report: Tropical Storm Kevin (PDF) (Report). Miami, Florida: National Hurricane Center. Retrieved December 25, 2021.
- ^ Brad J. Reinhart (December 8, 2021). Tropical Cyclone Report: Hurricane Linda (PDF) (Report). Miami, Florida: National Hurricane Center. Retrieved December 25, 2021.
- ^ Remnants of Linda Pass Through the Islands with Rain and Gusty Winds (Report). Honolulu, Hawaii: National Weather Service Forecast Office. Retrieved November 9, 2023.
- ^ Daniel P. Brown (September 30, 2021). Tropical Cyclone Report: Tropical Storm Marty (PDF) (Report). Miami, Florida: National Hurricane Center. Retrieved December 25, 2021.
- ^ Brad Reinhart; Richard Pasch (August 23, 2021). "Five Day Graphical Tropical Weather Outlook". www.nhc.noaa.gov. Miami, Florida: National Hurricane Center. Retrieved August 28, 2021.
- ^ Stacy Stewart (August 24, 2021). "Five Day Graphical Tropical Weather Outlook". www.nhc.noaa.gov. Miami, Florida: National Hurricane Center. Retrieved August 28, 2021.
- ^ Robbie Berg (August 25, 2021). "Tropical Depression Fourteen-E Discussion Number 1". www.nhc.noaa.gov. Miami, Florida: National Hurricane Center. Retrieved August 28, 2021.
- ^ Robbie Berg (August 25, 2021). "Tropical Storm Nora Discussion Number 4". www.nhc.noaa.gov. Miami, Florida: National Hurricane Center. Retrieved August 28, 2021.
- ^ Philippe Papin; Jack Beven (August 28, 2021). "Hurricane Nora Discussion Number 11". www.nhc.noaa.gov. Miami, Florida: National Hurricane Center. Retrieved August 28, 2021.
- ^ a b "Tropical Storm Nora fading, after leaving 1 dead, 7 missing". 30 August 2021.
- ^ "Hallan cuerpo de pescador desaparecido en Acapulco; faltan 5 tras paso del huracán Nora".
- ^ "Another storm expected to move up the coast of Puerto Vallarta this week". 6 September 2021.
- ^ Corrado, Brent (August 31, 2021). "Remnants of Hurricane Nora bring rain to Arizona; Flash Flood Watches issued". KSAZ-TV. Phoenix, Arizona: Fox Broadcasting Company. Associated Press. Retrieved September 9, 2021.
- ^ "Remnants of Hurricane Nora to move across Colorado, bringing back flooding concerns". The Denver Post. 2021-09-01. Retrieved 2022-04-11.
- ^ a b Andy S. Latto (January 10, 2022). Tropical Cyclone Report: Hurricane Otto (PDF) (Report). Miami, Florida: National Hurricane Center. Retrieved January 10, 2022.
- ^ a b c d John P. Cangialosi (November 29, 2021). Tropical Cyclone Report: Hurricane Pamela (PDF) (Report). Miami, Florida: National Hurricane Center. Retrieved December 25, 2021.
- ^ Stacy R. Stewart (October 11, 2021). "Tropical Storm Pamela Discussion Number 6". Miami, Florida: National Hurricane Center. Retrieved December 25, 2021.
- ^ Juan Carlos Flores (October 11, 2021). "Inminente salto de 'Pamela' a huracán categoría 1: SMN". La Jornada (in Mexican Spanish). Retrieved December 25, 2021.
- ^ Myriam Navarro (October 13, 2021). "Tormenta tropical 'Pamela' inunda calles de municipios de Nayarit". La Jornada (in Mexican Spanish). Retrieved December 25, 2021.
- ^ a b Karla Méndez (October 13, 2021). "Se desborda río en Nayarit tras paso de 'Pamela'". Excélsior (in Mexican Spanish). Retrieved December 25, 2021.
- ^ Gabriela Castro (October 14, 2021). "Superan las 7 mil hectáreas de cultivos con daños en Sinaloa por el huracán Pamela". El Debate (in Mexican Spanish). Retrieved December 25, 2021.
- ^ José Galarza (October 14, 2021). "Huracán Pamela arrasa con palapas en la Isla de la Piedra, Mazatlán". El Debate (in Mexican Spanish). Retrieved December 25, 2021.
- ^ a b Robbie Berg (January 24, 2022). Tropical Cyclone Report: Hurricane Rick (PDF) (Report). Miami, Florida: National Hurricane Center. Retrieved January 25, 2022.
- ^ Stacy Stewart (November 1, 2021). Five Day Graphical Tropical Weather Outlook. www.nhc.noaa.gov (Report). Miami, Florida: National Hurricane Center. Retrieved November 5, 2021.
- ^ Richard Pasch (November 2, 2021). Five Day Graphical Tropical Weather Outlook. www.nhc.noaa.gov (Report). Miami, Florida: National Hurricane Center. Retrieved November 5, 2021.
- ^ Andrew Latto (November 4, 2021). Five Day Graphical Tropical Weather Outlook. www.nhc.noaa.gov (Report). Miami, Florida: National Hurricane Center. Retrieved November 5, 2021.
- ^ Andrew Latto (November 4, 2021). Tropical Depression Eighteen-E Discussion Number 1 (Report). Miami, Florida: National Hurricane Center. Retrieved November 6, 2021.
- ^ John Cangialosi (November 6, 2021). Tropical Depression Eighteen-E Discussion Number 7 (Report). Miami, Florida: National Hurricane Center. Retrieved November 6, 2021.
- ^ Daniel Brown (November 7, 2021). Tropical Storm Terry Discussion Number 14 (Report). Miami, Florida: National Hurricane Center. Retrieved November 7, 2021.
- ^ Daniel Brown (November 8, 2021). Tropical Depression Terry Discussion Number 17 (Report). Miami, Florida: National Hurricane Center. Retrieved November 21, 2021.
- ^ Daniel Brown (November 8, 2021). "Tropical Depression Terry Discussion Number 18". Miami, Florida: National Hurricane Center. Retrieved November 8, 2021.
- ^ "Overall Green Tropical Cyclone alert for TERRY-21 Off-shore from 04 Nov 2021 15:00 UTC to 07 Nov 2021 21:00 UTC". www.gdacs.org. Retrieved 2022-03-06.
- ^ jay_hobgood. "Tropical Storms Sandra and Terry Develop over East Pacific | Talking Tropical Cyclones and Other Topics". Retrieved 2022-03-06.
- ^ "REMNANTS OF TERRY". www.nhc.noaa.gov. Retrieved 2022-03-06.
- ^ Andrew Latto (November 1, 2021). Five-Day Graphical Tropical Weather Outlook (Report). Miami, Florida: National Hurricane Center. Retrieved November 7, 2021.
- ^ Daniel Brown (November 2, 2021). Five-Day Graphical Tropical Weather Outlook (Report). Miami, Florida: National Hurricane Center. Retrieved November 7, 2021.
- ^ Philippe Papin (November 7, 2021). Tropical Depression Nineteen-E Public Advisory Number 1 (Report). Miami, Florida: National Hurricane Center. Retrieved November 7, 2021.
- ^ Philippe Papin (November 7, 2021). Tropical Depression Nineteen-E Discussion Number 1 (Report). Miami, Florida: National Hurricane Center. Retrieved November 7, 2021.
- ^ Philippe Papin (November 7, 2021). Tropical Storm Sandra Discussion Number 2 (Report). Miami, Florida: National Hurricane Center. Retrieved November 7, 2021.
- ^ Tom Birchard (November 8, 2021). Tropical Storm Sandra Discussion Number 6 (Report). Miami, Florida: National Hurricane Center. Retrieved November 9, 2021.
- ^ Dave Roberts (November 9, 2021). Tropical Storm Sandra Discussion Number 10 (Report). Miami, Florida: National Hurricane Center. Retrieved November 21, 2021.
- ^ a b National Hurricane Operations Plan (PDF) (Report). Washington, D.C.: NOAA Office of the Federal Coordinator for Meteorological Services and Supporting Research. May 2021. pp. 3-10–12. Retrieved March 7, 2024.
- ^ "World Meteorological Organization retires storm names Erika, Joaquin and Patricia" (Press release). National Oceanic and Atmospheric Administration. April 25, 2016. Retrieved March 7, 2024.
- ^ 2021 Hurricane Season Summary for the Central Pacific Basin (PDF) (Report). NOAA. November 28, 2021. Retrieved January 27, 2024.
- ^ "Dolores se disipa en México tras dejar tres muertes por tormentas eléctricas". www.efe.com (in Spanish). Retrieved June 21, 2021.
- ^ "Tormenta tropical 'Dolores' deja un muerto a su paso por Jalisco". Noticieros Televisa (in Mexican Spanish). June 21, 2021. Retrieved June 21, 2021.
- ^ a b Global Catastrophe Recap June 2021 (PDF) (Report). Aon. July 9, 2021. Retrieved July 12, 2021.
- ^ Global Catastrophe Recap September 2021 (PDF) (Report). Aon Benfield. October 12, 2021. Retrieved October 12, 2021.[permanent dead link]
- ^ "Huracán "Olaf" dejó daños estimados en 200 millones de pesos en BCS". El Heraldo de Mexico. September 21, 2021. Retrieved September 24, 2021.
- ^ a b Global Catastrophe Recap October 2021 (PDF) (Report). Aon. November 11, 2021. p. 5. Retrieved November 22, 2021.
External links edit
- National Hurricane Center and Central Pacific Hurricane Center (website)
- Servicio Meteorológico Nacional (website, in Spanish)
- Joint Typhoon Warning Center (website)