


Summary
The air mass coefficient defines the direct optical path length through the Earth's atmosphere, expressed as a ratio relative to the path length vertically upwards, i.e. at the zenith. The air mass coefficient can be used to help characterize the solar spectrum after solar radiation has traveled through the atmosphere.
The air mass coefficient is commonly used to characterize the performance of solar cells under standardized conditions, and is often referred to using the syntax "AM" followed by a number. "AM1.5" is almost universal when characterizing terrestrial power-generating panels.
Description edit
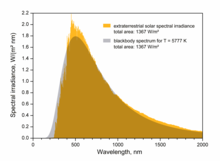
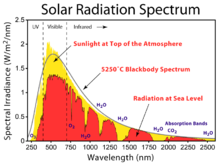
The overall intensity of solar radiation is like that of a black body radiator of the same size at about 5,800 K.[1] As it passes through the atmosphere, sunlight is attenuated by scattering and absorption; the more atmosphere through which it passes, the greater the attenuation.
As the sunlight travels through the atmosphere, chemicals interact with the sunlight and absorb certain wavelengths changing the amount of short-wavelength light reaching the Earth's surface. A more active component of this process is water vapor, which results in a wide variety of absorption bands at many wavelengths, while molecular nitrogen, oxygen and carbon dioxide add to this process. By the time it reaches the Earth's surface, the spectrum is strongly confined between the far infrared and near ultraviolet.
Atmospheric scattering plays a role in removing higher frequencies from direct sunlight and scattering it about the sky.[2] This is why the sky appears blue and the sun yellow — more of the higher-frequency blue light arrives at the observer via indirect scattered paths; and less blue light follows the direct path, giving the sun a yellow tinge.[3] The greater the distance in the atmosphere through which the sunlight travels, the greater this effect, which is why the sun looks orange or red at dawn and sunset when the sunlight is travelling very obliquely through the atmosphere — progressively more of the blues and greens are removed from the direct rays, giving an orange or red appearance to the sun; and the sky appears pink — because the blues and greens are scattered over such long paths that they are highly attenuated before arriving at the observer, resulting in characteristic pink skies at dawn and sunset.
Definition edit
For a path length through the atmosphere, and solar radiation incident at angle relative to the normal to the Earth's surface, the air mass coefficient is:[4]


-
(A.1)

where is the path length at zenith (i.e., normal to the Earth's surface) at sea level.

The air mass number is thus dependent on the Sun's elevation path through the sky and therefore varies with time of day and with the passing seasons of the year, and with the latitude of the observer.
Calculation edit

A first-order approximation for air mass is given by
-
(A.1)

where is the zenith angle, typically in degrees.
The above approximation overlooks the atmosphere's finite height, and predicts an infinite air mass at the horizon. However, it is reasonably accurate for values of up to around 75°. A number of refinements have been proposed to more accurately model the path thickness towards the horizon, such as that proposed by Kasten and Young (1989):[5]
-
(A.2)

A more comprehensive list of such models is provided in the main article Airmass, for various atmospheric models and experimental data sets. At sea level the air mass towards the horizon ( = 90°) is approximately 38.[6]
Modelling the atmosphere as a simple spherical shell provides a reasonable approximation:[7]
-
(A.3)

where the radius of the Earth = 6371 km, the effective height of the atmosphere ≈ 9 km, and their ratio ≈ 708. To avoid taking the difference of two large numbers, this can be written as


which also shows the similarity to the simple formula given above.

These models are compared in the table below:
| Flat Earth | Kasten & Young | Spherical shell | |
|---|---|---|---|
| degree | (A.1) | (A.2) | (A.3) |
| 0° | 1.0 | 1.0 | 1.0 |
| 60° | 2.0 | 2.0 | 2.0 |
| 70° | 2.9 | 2.9 | 2.9 |
| 75° | 3.9 | 3.8 | 3.8 |
| 80° | 5.8 | 5.6 | 5.6 |
| 85° | 11.5 | 10.3 | 10.6 |
| 88° | 28.7 | 19.4 | 20.3 |
| 90° | 37.9 | 37.6 |

These simple models assume that for these purposes the atmosphere can be considered to be effectively concentrated into around the bottom 9 km,[8] i.e. essentially all the atmospheric effects are due to the atmospheric mass in the lower half of the Troposphere. This is a useful and simple model when considering the atmospheric effects on solar intensity.
One can also assume that the air density falls off exponentially with height. If x is the distance along the light ray from where it meets the ground, divided by the equivalent thickness of the atmosphere (approximately 9 km), then the height of a point is:

The air mass is then:

where is the complementary error function. This gives a lower value, of around 33, when the sun is on the horizon. However, neither this model nor the previous take into consideration the bending of light rays due to refraction (see Levelling). A more realistic model would be based on the barometric formula for density.

Cases edit
- AM0
The spectrum outside the atmosphere is referred to as "AM0", meaning "zero atmospheres". Solar cells used for space power applications, like those on communications satellites, are generally characterized using AM0.
- AM1
The spectrum after travelling through the atmosphere to sea level with the sun directly overhead is referred to, by definition, as "AM1". This means "one atmosphere". AM1 ( =0°) to AM1.1 ( =25°) is a useful range for estimating performance of solar cells in equatorial and tropical regions.
- AM1.5
Solar panels do not generally operate under exactly one atmosphere's thickness: if the sun is at an angle to the Earth's surface the effective thickness will be greater. Many of the world's major population centres, and hence solar installations and industry, across Europe, China, Japan, the United States of America and elsewhere (including northern India, southern Africa and Australia) lie in temperate latitudes. An AM number representing the spectrum at mid-latitudes is therefore much more common.
"AM1.5", 1.5 atmosphere thickness, corresponds to a solar zenith angle of =48.2°. While the summertime AM number for mid-latitudes during the middle parts of the day is less than 1.5, higher figures apply in the morning and evening and at other times of the year. Therefore, AM1.5 is useful to represent the overall yearly average for mid-latitudes. The specific value of 1.5 has been selected in the 1970s for standardization purposes, based on an analysis of solar irradiance data in the conterminous United States.[9] Since then, the solar industry has been using AM1.5 for all standardized testing or rating of terrestrial solar cells or modules, including those used in concentrating systems. The latest AM1.5 standards pertaining to photovoltaic applications are the ASTM G-173[10][11] and IEC 60904, all derived from simulations obtained with the SMARTS code.
The illuminance for Daylight (this version) under AM1.5 is given as 109,870 lux (corresponding with the AM1.5 spectrum to 1000.4 W/m2).
- AM2~3
AM2 ( =60°) to AM3 ( =70°) is a useful range for estimating the overall average performance of solar cells installed at high latitudes such as in northern Europe. Similarly AM2 to AM3 is useful to estimate wintertime performance in temperate latitudes, e.g. airmass coefficient is greater than 2 at all hours of the day in winter at latitudes as low as 37°.
- AM38
AM38 is generally regarded as being the airmass in the horizontal direction ( =90°, i.e. sunset) at sea level.[6] However, in practice there is a high degree of variability in the solar intensity received at angles close to the horizon as described in the next section Solar intensity.
- At higher altitudes
The relative air mass is only a function of the sun's zenith angle, and therefore does not change with local elevation. Conversely, the absolute air mass, equal to the relative air mass multiplied by the local atmospheric pressure and divided by the standard (sea-level) pressure, decreases with elevation above sea level. For solar panels installed at high altitudes, e.g. in an Altiplano region, it is possible to use a lower absolute AM numbers than for the corresponding latitude at sea level: AM numbers less than 1 towards the equator, and correspondingly lower numbers than listed above for other latitudes. However, this approach is approximate and not recommended. It is best to simulate the actual spectrum based on the relative air mass (e.g., 1.5) and the actual atmospheric conditions for the specific elevation of the site under scrutiny.
Solar intensity edit
Solar intensity at the collector reduces with increasing airmass coefficient, but due to the complex and variable atmospheric factors involved, not in a simple or linear fashion. For example, almost all high energy radiation is removed in the upper atmosphere (between AM0 and AM1) and so AM2 is not twice as bad as AM1. Furthermore, there is great variability in many of the factors contributing to atmospheric attenuation,[12] such as water vapor, aerosols, photochemical smog and the effects of temperature inversions. Depending on level of pollution in the air, overall attenuation can change by up to ±70% towards the horizon, greatly affecting performance particularly towards the horizon where effects of the lower layers of atmosphere are amplified manyfold.
One empirical approximation model for solar intensity versus airmass is given by:[13][14]
-
(I.1)

where solar intensity external to the Earth's atmosphere = 1.353 kW/m2, and the factor of 1.1 is derived assuming that the diffuse component is 10% of the direct component.[13]

This formula fits comfortably within the mid-range of the expected pollution-based variability:
| AM | range due to pollution[12] | formula (I.1) | ASTM G-173[11] | |
|---|---|---|---|---|
| degree | W/m2 | W/m2 | W/m2 | |
| - | 0 | 1367[15] | 1353 | 1347.9[16] |
| 0° | 1 | 840 .. 1130 = 990 ± 15% | 1040 | |
| 23° | 1.09 | 800 .. 1110 = 960 ± 16%[17] | 1020 | |
| 30° | 1.15 | 780 .. 1100 = 940 ± 17% | 1010 | |
| 45° | 1.41 | 710 .. 1060 = 880 ± 20%[17] | 950 | |
| 48.2° | 1.5 | 680 .. 1050 = 870 ± 21%[17] | 930 | 1000.4[18] |
| 60° | 2 | 560 .. 970 = 770 ± 27% | 840 | |
| 70° | 2.9 | 430 .. 880 = 650 ± 34%[17] | 710 | |
| 75° | 3.8 | 330 .. 800 = 560 ± 41%[17] | 620 | |
| 80° | 5.6 | 200 .. 660 = 430 ± 53% | 470 | |
| 85° | 10 | 85 .. 480 = 280 ± 70% | 270 | |
| 90° | 38 | 20 |
This illustrates that significant power is available at only a few degrees above the horizon. For example, when the sun is more than about 60° above the horizon ( <30°) the solar intensity is about 1000 W/m2 (from equation I.1 as shown in the above table), whereas when the sun is only 15° above the horizon ( =75°) the solar intensity is still about 600 W/m2 or 60% of its maximum level; and at only 5° above the horizon still 27% of the maximum.
At higher altitudes edit
One approximate model for intensity increase with altitude and accurate to a few kilometres above sea level is given by:[13][19]
-
(I.2)
![{\displaystyle I=1.1\times I_{\mathrm {o} }\times [(1-h/7.1)0.7^{(AM)^{0.678})}+h/7.1]\,}](https://wikimedia.org/api/rest_v1/media/math/render/svg/8398f4bddfe3dde983c935eeb7ab5c1cc2a40de2)
where is the solar collector's height above sea level in km and is the airmass (from A.2) as if the collector was installed at sea level.


Alternatively, given the significant practical variabilities involved, the homogeneous spherical model could be applied to estimate AM, using:
-
(A.4)

where the normalized heights of the atmosphere and of the collector are respectively ≈ 708 (as above) and .

And then the above table or the appropriate equation (I.1 or I.3 or I.4 for average, polluted or clean air respectively) can be used to estimate intensity from AM in the normal way.
These approximations at I.2 and A.4 are suitable for use only to altitudes of a few kilometres above sea level, implying as they do reduction to AM0 performance levels at only around 6 and 9 km respectively. By contrast much of the attenuation of the high energy components occurs in the ozone layer - at higher altitudes around 30 km.[20] Hence these approximations are suitable only for estimating the performance of ground-based collectors.
Solar cell efficiency edit
The earth's atmosphere absorbs a considerable amount of the ultraviolet light. The resulting spectrum at the Earth's surface has fewer photons, but they are of lower energy on average, so the number of photons, above the bandgap, per unit of sunlight energy is greater than in space. This means that solar cells are more efficient at AM1 than AM0. This apparently counter-intuitive result arises simply because silicon cells can't make much use of the high energy radiation which the atmosphere filters out. As illustrated below, even though the efficiency is lower at AM0 the total output power (Pout) for a typical solar cell is still highest at AM0. Conversely, the shape of the spectrum does not significantly change with further increases in atmospheric thickness, and hence cell efficiency does not greatly change for AM numbers above 1.
| AM | Solar intensity | Output power | Efficiency |
|---|---|---|---|
| Pin W/m2 | Pout W/m2 | Pout / Pin | |
| 0 | 1350 | 160 | 12% |
| 1 | 1000 | 150 | 15% |
| 2 | 800 | 120 | 15% |
This illustrates the more general point that given that solar energy is "free", and where available space is not a limitation, other factors such as total output power Pout, and Pout per unit of invested money (e.g. per dollar), are often more important considerations than efficiency (Pout/Pin).
See also edit
Notes and references edit
- ^ or more precisely 5,777 K as reported in NASA Solar System Exploration - Sun: Facts & Figures Archived 2015-07-03 at the Wayback Machine retrieved 27 April 2011 "Effective Temperature ... 5777 K"
- ^ See also the article Diffuse sky radiation.
- ^ Yellow is the color negative of blue — yellow is the aggregate color of what remains after scattering removes some blue from the "white" light from the sun.
- ^ Peter Würfel (2005). The Physics of Solar Cells. Weinheim: Wiley-VCH. ISBN 3-527-40857-6.
- ^ Kasten, F. and Young, A. T. (1989). Revised optical air mass tables and approximation formula. Applied Optics 28:4735–4738.
- ^ a b The main article Airmass reports values in the range 36 to 40 for different atmospheric models
- ^ Schoenberg, E. (1929). Theoretische Photometrie, g) Über die Extinktion des Lichtes in der Erdatmosphäre. In Handbuch der Astrophysik. Band II, erste Hälfte. Berlin: Springer.
- ^ The main article Airmass reports values in the range 8 to 10 km for different atmospheric models
- ^ Gueymard, C.; Myers, D.; Emery, K. (2002). "Proposed reference irradiance spectra for solar energy systems testing". Solar Energy. 73 (6): 443–467. Bibcode:2002SoEn...73..443G. doi:10.1016/S0038-092X(03)00005-7.
- ^ Reference Solar Spectral Irradiance: Air Mass 1.5 NREL retrieved 1 May 2011
- ^ a b Reference Solar Spectral Irradiance: ASTM G-173 ASTM retrieved 1 May 2011
- ^ a b Planning and installing photovoltaic systems: a guide for installers, architects and engineers, 2nd Ed. (2008), Table 1.1, Earthscan with the International Institute for Environment and Development, Deutsche Gesellschaft für Sonnenenergie. ISBN 1-84407-442-0.
- ^ a b c PVCDROM retrieved 1 May 2011, Stuart Bowden and Christiana Honsberg, Solar Power Labs, Arizona State University
- ^ Meinel, A. B. and Meinel, M. P. (1976). Applied Solar Energy Addison Wesley Publishing Co.
- ^ The Earthscan reference uses 1367 W/m2 as the solar intensity external to the atmosphere.
- ^ The ASTM G-173 standard measures solar intensity over the band 280 to 4000 nm.
- ^ a b c d e Interpolated from data in the Earthscan reference using suitable Least squares estimate variants of equation I.1:
- for polluted air:
-
(I.3)
-
- for clean air:
-
(I.4)
-
- ^ The ASTM G-173 standard measures solar intensity under "rural aerosol loading" i.e. clean air conditions - thus the standard value fits closely to the maximum of the expected range.
- ^ Laue, E. G. (1970), The measurement of solar spectral irradiance at different terrestrial elevations, Solar Energy, vol. 13, no. 1, pp. 43-50, IN1-IN4, 51-57, 1970.
- ^ R.L.F. Boyd (Ed.) (1992). Astronomical photometry: a guide, section 6.4. Kluwer Academic Publishers. ISBN 0-7923-1653-3.

