


Summary
Ammonia pollution is pollution by the chemical ammonia (NH3) – a compound of nitrogen and hydrogen which is a byproduct of agriculture and industry. Common forms include air pollution by the ammonia gas emitted by rotting agricultural slurry and fertilizer factories while natural sources include the burning coal mines of Jharia, the caustic Lake Natron and the guano of seabird colonies. Gaseous ammonia reacts with other pollutants in the air to form fine particles of ammonium salts, which affect human breathing. Ammonia gas can also affect the chemistry of the soil on which it settles and will, for example, degrade the conditions required by the sphagnum moss and heathers of peatland.[1][2][3][4]

Ammonia also has effects on aquatic ecosystems and decreases the biodiversity.[5] Ammonia is toxic to aquatic life which leads to increased amounts of fish deaths.[6] Ammonia pollution also leads to eutrophication. Eutrophication is the growth of algae that kills other aquatic life and creates dead zones. Ammonia pollution affects freshwater and salt water ecosystems differently due to physical and chemical differences.
Ammonia detection is facilitated through the use of filter packs and fabric denuders (a gas separator). Techniques such as satellite imaging and rainwater analysis are also used.[7] Much is still unknown about the impact of ammonia pollution, but rising emission rates concern scientists. The level of ammonia in the atmosphere was more than twice as large in 2010 as it was in 1940.[8] Ammonia is now recognized by many countries as a major pollutant and some have begun taking steps to limit their emissions.[7]
Sources edit
The table below lists sources of ammonia pollution and their percent contribution to global ammonia emissions. The sources are also classified as either anthropogenic (resulting from humans) or natural.
| Source | Description | Percent of Global Emissions | Type |
|---|---|---|---|
| Agriculture | 1. Livestock waste contains high amounts of nitrogen because farmers use nutrient dense feed. Almost 80% of this nitrogen ends up in animals’ manure as ammonium (NH4+) which is converted to ammonia (NH3) through volatilization:
About half of the NH4+ is converted to ammonia gas, which then enters the atmosphere or dissolves in runoff. Volatilization is increased in moist, warm, and acidic environments.[9][10] 2. Artificial fertilizer usage such as in slurry is manufactured to have high nutrient contents. This includes nitrogen based compounds like ammonium (NH4+) which, similar to manure, is released as ammonia through volatilization (into the atmosphere or in runoff).[10][7] 3. Concentrated animal feeding operations (CAFOs) contribute largely to ammonia emissions. Studies show that ammonia emission rates were 700 kg/h and ammonia emissions from a single CAFO averaged 101.9 ± 40.6 kg/h and 437.7 ± 202.0 kgCH4/h, respectively, corresponding to emission factors per livestock of 9.1 ± 2.7 gNH3/LU/h and 40.1 ± 17.8 gCH4/LU/h. [11] |
Over 70%
(⅔ from livestock) (⅓ from fertilizer) |
Anthropogenic |
| Oceans | Decomposition of waste in the ocean releases ammonium into the seawater. Surface levels can release this into the atmosphere through volatilization which increases with rough waves, high winds, high acidity, and high temperatures.[12][13] | 15% | Natural |
| Wildfires | Combustion of biomass (organic matter) results in the release of many chemicals which sometimes include ammonia. Different biomass results in different emissions. The burning of tropical forest biomass, such as the Amazon Basin, releases the largest quantity of ammonia.[14][7] | 10% | Anthropogenic and natural |
| Automobiles | The catalytic converters in engines reduce noxious chemical emission, but also cause ammonia to be released as a byproduct. Operation of a three way catalyst converter type causes this. Newer vehicles have reduced ammonia emissions through modifications such as decreasing exhaust temperatures and increasing air to fuel ratios.[7][15] | < 2% | Anthropogenic |
| Industrial Processes | Production plants may release ammonia as a byproduct through chemical combustion or in effluent streams.[8] | < 2% | Anthropogenic |
| Other | Human waste, wild animal waste, wastewater, and decomposition all contribute to ammonia emissions via volatilization.[8][16] | < 1% | Anthropogenic and natural |

Effects edit
Ammonia decreases the biodiversity of terrestrial and aquatic ecosystems and also forms aerosols in the atmosphere which can cause human health complications if inhaled.
Biodiversity edit
Gaseous ammonia emissions enter Earth’s soil and water through both wet and dry deposition. Aqueous ammonia, another form of the compound, may seep directly into the ground or flow into aquatic ecosystems. Both terrestrial and aquatic ammonia pollution decrease biodiversity mainly through the process of nitrification.
Terrestrial Effects edit
In terrestrial settings, ammonia increases soil acidity (decreased pH) and causes eutrophication (an overabundance of nutrients). Both of these occur as a direct result of nitrification. In this process, ammonia is converted into nitrate by bacteria (usually of genera Nitrosomonas and Nitrobacter) performing the following two step reaction:
Step 1: Ammonia (NH3 ) is oxidized into nitrite (NO2−) by:

Step 2: Nitrite (NO2−) is oxidized into nitrate(NO3−)

The products of this reaction include hydrogen (H+) ions which lower the soil pH and lead to acidification. Increased soil acidity in the ecosystem leads to decreased protection against cold temperatures, drought, disease, and invasive species. The other product, nitrate (NO3−), is a key nutrient for plant growth. This excess nitrate from ammonia nitrification favors nitrophilous plants (those that prefer high nitrate concentrations) and disadvantages others. For example, an increase in nitrophilous plant populations shade other plants from necessary sunlight. Sensitive plant groups such as lichen and moss are particularly susceptible to ammonia pollution and habitats such as bogs, peatlands, grasslands, heathlands, and forests are mainly affected.[17][18]
In livestock, high ammonia concentrations has been linked to ascites, gastrointestinal irritation and respiratory disease. These issues are easily observable in poultry, specifically turkeys. Turkeys have been shown to have trachea irritation at 10 ppm and at above 20 ppm they have an increased rate of contracting Newcastle disease. Above 25 ppm, growth rate and body weight is reduced. Above 50 ppm, there are increases levels of keratoconjunctivitis and tracheitis. Such trachea and lung complications make turkeys more prone to contracting infections like E. coli.[19]
Aquatic effects edit
Ammonia seeps into aquatic ecosystem in many different ways from both anthropogenic (waste water, fertilizers, and industrial waste) and natural (Nitrogen fixation and air deposition) sources.[20] Ammonia is toxic to most aquatic life including fish, corals, and planktonic crustaceans.[21] Ammonia can have 2 different forms in water.

This reaction is showing how ammonia changes into ammonia in water and generates a hydroxide ion. The form that the ammonia takes in the water also depends on the pH and temperature. Waters that are more basic have more ammonia compared to the amount of ammonium.[21] Ammonia is directly toxic to aquatic life while ammonium is not. This is because ammonia can diffuse across cell membranes but ammonium can't.[22] This means that the more basic the waters, the more toxic ammonia pollution will be to the aquatic life.
Freshwater effects edit
Freshwater systems are commonly limited by nitrogen.[23] This means that increases in nitrogen in freshwater ecosystems can increase the primary productivity of plants and algae. When too much nitrogen is added to the water, the algae in the water can increase their output so rapidly that eutrophication occurs.[24] Eutrophication is an increase in algal growth which causes the oxygen dissolved in the water to decrease. This decrease creates hypoxic waters that cause the death of other aquatic life like fish. This decreases the amount of biodiversity in the waters where this occurs.[25]
Ammonia is also directly toxic to fish and as the amount of ammonia increases, the more that accumulates in their bodies and it becomes harder to for the animals to remove it from their bodies. Freshwaters tend to have a wide range of pH values from 6.5 to 9.[26] Freshwaters that have a higher pH would be more sensitive to increases in ammonia due to the balance between ammonia and ammonium and the aquatic life would be more affected. The ammonia causes stress on the fish and damages internal organs which will eventually lead to death.[27]
Salt water effects edit
Salt water systems are also commonly limited by nitrogen. Eutrophication can also occur in salt water due to increases in ammonia available, however it is more common in freshwaters because they have limited circulation and shallower waters.[28] The pH of the ocean tends to be about 8.1 which means that more of the ammonia found in the ocean waters would be in the form of ammonia and not ammonium. This also means that there are more toxic effects than other waters that are more acidic.
Ammonia in salt water ecosystems will have similar effects on fish as ammonia in freshwater ecosystems. Another aquatic animal that that is affected by increasing amounts of ammonia is coral. Coral are very important for diversity in oceans and increasing concentrations of ammonia in the water is harming the bacteria that are found on the coral.[29] The coral and bacteria are in a symbiotic relationship and the death of the bacteria leads to the bleaching of the coral and death. Corals support biodiversity in the ocean and the loss of coral reefs leads to a decrease in biodiversity.
Human health edit
Gaseous ammonia that is not deposited forms aerosols by combining with other emissions such as sulfur dioxide (SO2) and nitrogen oxides (NOX). Atmospheric reactions among sulfur dioxide, nitrogen oxides, intermediate products, and other gases eventually result in formation of ammonium nitrate (NH4NO3) and ammonium bisulfate (NH4HSO4) by the following:


These resulting ammonium (NH4) aerosols are classified as fine particulate matter (PM2.5 or particulate matter less than 2.5 microns in size). The small size of PM2.5 particles allows them to enter the lungs and bloodstream through inhalation. Ammonium particles can then cause complications including asthma, lung cancer, cardiovascular issues, birth defects, and premature death in humans. The smaller ammonium PM2.5 can also travel further distances (100–1000 km) when compared to unreacted ammonia (less than 10–100 km) in the atmosphere.[4] Some countries like China have focused on reducing SO2 and NOX emissions, however increased NH3 pollution still results in PM2.5 formation and reduces air quality.[30]
Monitoring techniques edit
Ammonia pollution is most commonly measured by its presence in the atmosphere. It has no automatic relay system as with other pollutant measurements such as carbon dioxide; therefore, ammonia samples must be collected through other methods including filter packs, fabric denuders, satellite imaging, and rainwater analysis.
Filter packs edit
Filter packs consist of an air pump fitted with a Teflon and glass fiber filter. The pump sucks in air and the filters remove ammonia particles. The Teflon and glass fiber filter are coated in citric acid which reacts with the slightly basic ammonia particles. This reaction essentially "glues" the ammonia in place. Later, the filter is tested with Nessler’s reagent (an ammonia indicator) and a spectrophotometer reads the amount of ammonia present.[31]
Fabric denuders edit
Fabric denuders function through passive sampling (no pump is used and collection depends only on airflow). A pipe fitted with cloth filters on either side serves as a tunnel for air to diffuse through. The cloth is coated in phosphoric acid which attracts ammonia gas (a base). Air flows through the tube and ammonia sticks to the filters which can then be tested for NH3 concentrations using Nessler's reagent and a spectrophotometer.[31]
Satellite imaging edit
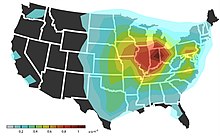
Systems of satellites measure gas signatures in the atmosphere over time. Ammonia’s signature is charted giving an estimate of its prevalence in the air and where it is most concentrated. NASA has been using satellite imaging to monitor ammonia emissions since 2008.[7]
Rainwater analysis edit
Buckets of rain are collected and then tested for ammonia using techniques described above. This provides the concentration of ammonia gas trapped in atmospheric water vapor.[7]
Regulations edit
Although ammonia is now recognized as a potentially hazardous air pollutant, only some countries have taken further action to reduce their emission. Reduction strategies predominantly focus on controlling agricultural practices.
Policy edit
The European Union has had two policies in place since 1999 to prevent ammonia pollution. These include the Gothenburg Protocol (1999) and the Directive on Integrated Pollution Protection and Control (1999). The National Emission Ceilings Directive was also put into effect in 2001 by the EU to further reduce NH3 emissions. The Gothenburg Protocol was revised in 2012 to set new, stricter, ceiling limits on ammonia until 2020 and to include all EU-27 countries. The United Kingdom in particular has announced that they plan to cut emissions by 16% by 2030, however no new policies have been enacted.[32]
Ammonia pollution regulations mainly focus on mitigation through better farming practices. One suggested change is keeping manure and fertilizer in large storage tanks to prevent runoff and volatilization into the air. Another strategy involves feeding livestock diets less dense in protein. This would result in less nitrogen proteins (including ammonia) ending up in manure. A final idea is using less urea and ammonium based fertilizers which are prone to volatilization into ammonia.[9][32]
See also edit
References edit
- ^ Van Damme, Martin; Clarisse, Lieven (5 December 2018), "Industrial and agricultural ammonia point sources exposed" (PDF), Nature, 564 (7734): 99–103, Bibcode:2018Natur.564...99V, doi:10.1038/s41586-018-0747-1, PMID 30518888, S2CID 54458643
- ^ Sutton, Mark A.; Howard, Clare M. (5 December 2018), "Satellite pinpoints ammonia sources globally", Nature, 564 (7734): 49–50, Bibcode:2018Natur.564...49S, doi:10.1038/d41586-018-07584-7, PMID 30518893
- ^ Mark Sutton; Stefan Reis; Samantha Baker, eds. (2008), Atmospheric Ammonia, Springer, ISBN 9781402091216
- ^ a b "Ammonia | Air Pollution Information System". www.apis.ac.uk. Retrieved 2020-11-15.
- ^ Wang, Huan; García Molinos, Jorge; Heino, Jani; Zhang, Huan; Zhang, Peiyu; Xu, Jun (2021-08-01). "Eutrophication causes invertebrate biodiversity loss and decreases cross-taxon congruence across anthropogenically-disturbed lakes". Environment International. 153: 106494. doi:10.1016/j.envint.2021.106494. ISSN 0160-4120.
- ^ Services, Florida Department of Agriculture and Consumer. "Florida Department of Agriculture & Consumer Services". www.fdacs.gov. Retrieved 2024-04-15.
- ^ a b c d e f g Plautz, Jason (2018-09-13). "Ammonia, a poorly understood smog ingredient, could be key to limiting deadly pollution". Science. doi:10.1126/science.aav3862. ISSN 0036-8075. S2CID 133673554.
- ^ a b c Bauer, Susanne E.; Tsigaridis, Kostas; Miller, Ron (2016). "Significant atmospheric aerosol pollution caused by world food cultivation". Geophysical Research Letters. 43 (10): 5394–5400. Bibcode:2016GeoRL..43.5394B. doi:10.1002/2016GL068354. ISSN 1944-8007.
- ^ a b "The surprising way fumes from farms are harming our health". Ensia. Retrieved 2020-11-14.
- ^ a b Del Moro, Sarah; Holcomb, Jess; Horneck, Don; Sullivan, Dan. (2013). Ammonia Volatilization [PowerPoint presentation]. Hermiston Agricultural Research and Extension Center, Oregon. https://extension.oregonstate.edu/sites/default/files/documents/1/delmorofarmfairnh3.pdf
- ^ Vechi, N. T.; Mellqvist, J.; Samuelsson, J.; Offerle, B.; Scheutz, C. (2023-01-15). "Ammonia and methane emissions from dairy concentrated animal feeding operations in California, using mobile optical remote sensing". Atmospheric Environment. 293: 119448. doi:10.1016/j.atmosenv.2022.119448. ISSN 1352-2310.
- ^ Paulot, F.; Jacob, D. J.; Johnson, M. T.; Bell, T. G.; Baker, A. R.; Keene, W. C.; Lima, I. D.; Doney, S. C.; Stock, C. A. (2015). "Global oceanic emission of ammonia: Constraints from seawater and atmospheric observations". Global Biogeochemical Cycles. 29 (8): 1165–1178. Bibcode:2015GBioC..29.1165P. doi:10.1002/2015GB005106. hdl:1912/7658. ISSN 1944-9224. S2CID 18373876.
- ^ US EPA, OW (2015-08-20). "Aquatic Life Criteria - Ammonia". US EPA. Retrieved 2020-10-22.
- ^ "What Is Left in the Air After a Wildfire Depends on Exactly What Burned". Eos. 23 January 2020. Retrieved 2020-11-14.
- ^ Wang, Chengxiong; Tan, Jianwei; Harle, Gavin; Gong, Huiming; Xia, Wenzheng; Zheng, Tingting; Yang, Dongxia; Ge, Yunshan; Zhao, Yunkun (2019-11-05). "Ammonia Formation over Pd/Rh Three-Way Catalysts during Lean-to-Rich Fluctuations: The Effect of the Catalyst Aging, Exhaust Temperature, Lambda, and Duration in Rich Conditions". Environmental Science & Technology. 53 (21): 12621–12628. Bibcode:2019EnST...5312621W. doi:10.1021/acs.est.9b03893. ISSN 0013-936X. PMID 31577131. S2CID 203639098.
- ^ Valach, Alex C.; Häni, Christoph; Bühler, Marcel; Mohn, Joachim; Schrade, Sabine; Kupper, Thomas (2023-12-02). "Ammonia emissions from a dairy housing and wastewater treatment plant quantified with an inverse dispersion method accounting for deposition loss". Journal of the Air & Waste Management Association. 73 (12): 930–950. doi:10.1080/10962247.2023.2271426. ISSN 1096-2247.
- ^ Guthrie, Susan; Giles, Sarah; Dunkerley, Fay; Tabaqchali, Hadeel; Harshfield, Amelia; Ioppolo, Becky; Manville, Catriona (2018-09-16), Impact of ammonia emissions from agriculture on biodiversity: An evidence synthesis
- ^ "Effects of Nitrogen Fertilizers on Soil pH". Vegetable Crops Hotline. Retrieved 2020-11-14.
- ^ "Ammonia Emission from Animal Feeding Operations and Its Impacts". ohioline.osu.edu. Retrieved 2024-03-14.
- ^ US EPA, OW (2015-08-20). "Aquatic Life Criteria - Ammonia". www.epa.gov. Retrieved 2024-04-12.
- ^ a b "Ecological Effects of Ammonia | Minnesota Department of Agriculture". www.mda.state.mn.us. Retrieved 2024-04-12.
- ^ Edwards, Thea (10 January 2024). "Ammonia and aquatic ecosystems - A review of global sources, biogeochemical cycling, and effects on fish". Science of The Total Environment. 907: 167911 – via Elsevier Science Direct.
- ^ Mischler, John (13 May 2014). "Nitrogen Limitation of Pond Ecosystems on the Plains of Eastern Colorado". PLoS One. 9 (5): e95757 – via PubMed.
- ^ Glibert, Patricia; Seitzinger, Sybil; Heil, Cynthia; Burkholder, JoAnn; Parrow, Matthew; Codispoti, Louis; Kelly, Vince (2005-06-01). "The Role of Eutrophication in the Global Proliferation of Harmful Algal Blooms". Oceanography. 18 (2): 198–209. doi:10.5670/oceanog.2005.54. ISSN 1042-8275.
- ^ Wang, Huan; García Molinos, Jorge; Heino, Jani; Zhang, Huan; Zhang, Peiyu; Xu, Jun (2021-08-01). "Eutrophication causes invertebrate biodiversity loss and decreases cross-taxon congruence across anthropogenically-disturbed lakes". Environment International. 153: 106494. doi:10.1016/j.envint.2021.106494. ISSN 0160-4120.
- ^ US EPA, ORD (2015-11-04). "pH". www.epa.gov. Retrieved 2024-04-15.
- ^ Services, Florida Department of Agriculture and Consumer. "Florida Department of Agriculture & Consumer Services". www.fdacs.gov. Retrieved 2024-04-15.
- ^ Yang, Xiao-e (March 2008). "Mechanisms and assessment of water eutrophication". Journal of Zhejiang University Science. 9 (3): 197–209 – via PubMed.
- ^ Zhu, Baohua; Wang, Guangce; Huang, Bo; Tseng, C. K. (2004-09-01). "Effects of temperature, hypoxia, ammonia and nitrate on the bleaching among three coral species". Chinese Science Bulletin. 49 (18): 1923–1928. doi:10.1007/BF03184283. ISSN 1861-9541.
- ^ Fu, Xiao; Wang, Shuxiao; Xing, Jia; Zhang, Xiaoye; Wang, Tao; Hao, Jiming (2017-06-13). "Increasing Ammonia Concentrations Reduce the Effectiveness of Particle Pollution Control Achieved via SO2 and NOX Emissions Reduction in East China". Environmental Science & Technology Letters. 4 (6): 221–227. doi:10.1021/acs.estlett.7b00143.
- ^ a b Fitz, DR; Pisano JT; Goorahoo, D; Krauter, CF; Malkina, IL (2016). A Passive Flux Denuder for Evaluating Emissions of Ammonia at a Dairy Farm, 11th International Emission Inventory Conference, San Diego, 2003. EPA.
- ^ a b "Ammonia (NH3) emissions — European Environment Agency". www.eea.europa.eu. Retrieved 2020-11-15.