


Summary
Arkansas's 4th congressional district is a congressional district located in the southwestern portion of the U.S. state of Arkansas. Notable towns in the district include Camden, Hope, Hot Springs, Magnolia, Pine Bluff, and Texarkana.
| Arkansas's 4th congressional district | |||
|---|---|---|---|
Interactive map of district boundaries since January 3, 2023 | |||
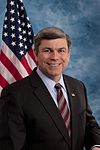
| Representative |
| ||
| Area | 20,951 sq mi (54,260 km2) | ||
| Distribution |
| ||
| Population (2022) | 751,385[1] | ||
| Median household income | $48,035[2] | ||
| Ethnicity |
| ||
| Cook PVI | R+20[3] | ||


The district is currently represented by Republican Bruce Westerman.
Historically, the district has supported conservative Democrats such as Mike Ross and David Pryor, and was reckoned as a classic Yellow Dog Democrat district. However, the growing Republican trend in the state has overtaken the district since the start of the 21st century with the district supporting George W. Bush with 51% in 2004 and support grew as John McCain won the district in 2008 with 58% of the vote.
Composition edit
The 4th congressional district consists of the entirety of the following counties, with the exception of Pulaski County, which it shares with the 1st and 2nd districts. Pulaski County municipalities within the 4th district include portions of Little Rock (shared with the 2nd district) and the entirety of Hensley, Landmark, Sweet Home, Woodson, and Wrightsville.
| # | County | Seat | Population |
|---|---|---|---|
| 3 | Ashley | Hamburg | 16,307 |
| 11 | Bradley | Warren | 10,104 |
| 13 | Calhoun | Hampton | 4.641 |
| 19 | Clark | Arkadelphia | 21,274 |
| 25 | Cleveland | Rison | 7,378 |
| 27 | Columbia | Magnolia | 22,150 |
| 39 | Dallas | Fordyce | 6,185 |
| 43 | Drew | Monticello | 16,945 |
| 47 | Franklin | Ozark, Charleston | 17,468 |
| 51 | Garland | Hot Springs | 99,784 |
| 53 | Grant | Sheridan | 18,383 |
| 57 | Hempstead | Hope | 19,343 |
| 59 | Hot Spring | Malvern | 33,258 |
| 61 | Howard | Nashville | 12,533 |
| 69 | Jefferson | Pine Bluff | 63,661 |
| 71 | Johnson | Clarksville | 26,129 |
| 73 | Lafayette | Lewisville | 6,095 |
| 81 | Little River | Ashdown | 11,805 |
| 83 | Logan | Booneville, Paris | 21,400 |
| 91 | Miller | Texarkana | 42,415 |
| 97 | Montgomery | Mount Ida | 8,620 |
| 99 | Nevada | Prescott | 8,120 |
| 101 | Newton | Jasper | 7,071 |
| 103 | Ouachita | Camden | 21,793 |
| 109 | Pike | Murfreesboro | 10,208 |
| 113 | Polk | Mena | 19,436 |
| 115 | Pope | Russellville | 64,593 |
| 119 | Pulaski | Little Rock | 400,009 |
| 127 | Scott | Waldron | 9,851 |
| 133 | Sevier | De Queen | 15,632 |
| 139 | Union | El Dorado | 37,397 |
| 149 | Yell | Dardanelle, Danville | 20,044 |
Recent statewide election results edit
| Year | Office | Results |
|---|---|---|
| 2000 | President | Bush 51 - 48% |
| 2004 | President | Bush 51 - 48% |
| 2008 | President | McCain 58 - 39% |
| 2012 | President | Romney 62 - 36% |
| 2016 | President | Trump 64 - 31% |
| 2020 | President | Trump 68 - 30% |
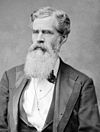
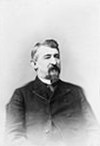
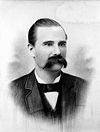
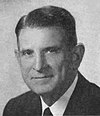
List of members representing the district edit


Recent US House election results edit
2002 edit
| Party | Candidate | Votes | % | ±% | |
|---|---|---|---|---|---|
| Democratic | Michael Avery Ross* | 119,633 | 60.56% | ||
| Republican | Jay Dickey | 77,904 | 39.44% | ||
| Majority | 41,729 | 21.12% | |||
| Total votes | 197,537 | 100.00 | |||
| Democratic hold | |||||
2004 edit
| Party | Candidate | Votes | % | ±% | |
|---|---|---|---|---|---|
| Democratic | Michael Avery Ross* | 243,003 | 100.00% | ||
| Majority | 243,003 | 100.00% | |||
| Total votes | 100.00 | ||||
| Democratic hold | |||||
2006 edit
| Party | Candidate | Votes | % | ±% | |
|---|---|---|---|---|---|
| Democratic | Michael Avery Ross* | 128,236 | 74.73% | ||
| Republican | Joe Ross | 43,360 | 25.27% | ||
| Majority | 84,876 | 49.46% | |||
| Total votes | 171,596 | 100.00 | |||
| Democratic hold | |||||
2008 edit
| Party | Candidate | Votes | % | ±% | |
|---|---|---|---|---|---|
| Democratic | Michael Avery Ross* | 203,178 | 86.17% | ||
| Green | J. Joshua Drake | 32,603 | 13.83% | ||
| Majority | 170,575 | 72.34% | |||
| Total votes | 235,781 | 100.00 | |||
| Democratic hold | |||||
2010 edit
| Party | Candidate | Votes | % | ±% | |
|---|---|---|---|---|---|
| Democratic | Michael Avery Ross* | 102,479 | 57.53% | ||
| Republican | Beth Anne Rankin | 71,526 | 40.15% | ||
| Green | J. Joshua Drake | 4,129 | 2.32% | ||
| Majority | 30,953 | 17.38% | |||
| Total votes | 178,134 | 100.00 | |||
| Democratic hold | |||||
2012 edit
| Party | Candidate | Votes | % | ±% | |
|---|---|---|---|---|---|
| Republican | Tom Cotton | 154,149 | 59.53% | ||
| Democratic | Gene Jeffress | 95,013 | 36.69% | ||
| Libertarian | Bobby Tullis | 4,984 | 1.92% | ||
| Green | J. Joshua Drake | 4,807 | 1.86% | ||
| Majority | 59,136 | 22.84% | |||
| Total votes | 258,953 | 100.00 | |||
| Republican gain from Democratic | |||||
2014 edit
| Party | Candidate | Votes | % | ±% | |
|---|---|---|---|---|---|
| Republican | Bruce Westerman (incumbent) | 110,789 | 54% | ||
| Democratic | James Lee Witt | 87,742 | 43% | ||
| Libertarian | Ken Hamilton | 7,598 | 3% | ||
| Majority | 23,047 | 11% | |||
| Total votes | 206,131 | 100.00% | |||
| Republican hold | |||||
2016 edit
| Party | Candidate | Votes | % | ±% | |
|---|---|---|---|---|---|
| Republican | Bruce Westerman (incumbent) | 182,885 | 75% | ||
| Libertarian | Ken Hamilton | 61,274 | 25% | ||
| Majority | 121,611 | 50% | |||
| Total votes | 244,159 | 100.00% | |||
| Republican hold | |||||
2018 edit
| Party | Candidate | Votes | % | |
|---|---|---|---|---|
| Republican | Bruce Westerman (incumbent) | 136,740 | 66.74% | |
| Democratic | Hayden Shamel | 63,984 | 31.23% | |
| Libertarian | Tom Canada | 3,952 | 1.93% | |
| Write-in | 216 | 0.11% | ||
| Total votes | 204,892 | 100% | ||
| Republican hold | ||||
2020 edit
| Party | Candidate | Votes | % | |
|---|---|---|---|---|
| Republican | Bruce Westerman (incumbent) | 191,617 | 69.7 | |
| Democratic | William Hanson | 75,750 | 27.5 | |
| Libertarian | Frank Gilbert | 7,668 | 2.8 | |
| Total votes | 275,035 | 100.0 | ||
| Republican hold | ||||
2022 edit
| Party | Candidate | Votes | % | |
|---|---|---|---|---|
| Republican | Bruce Westerman (incumbent) | 153,850 | 71.00 | |
| Democratic | John White | 56,745 | 26.19 | |
| Libertarian | Gregory Maxwell | 6,101 | 2.82 | |
| Total votes | 216,696 | 100.0 | ||
| Republican hold | ||||
References edit
- Specific
- ^ "My Congressional District".
- ^ "My Congressional District".
- ^ "2022 Cook PVI: District Map and List". Cook Political Report. Retrieved January 10, 2023.
- ^ Pruden III, William. "William Fadjo Cravens (1899–1974)". Encyclopedia of Arkansas. Retrieved December 22, 2020.
- ^ "2018 Arkansas general election results". Arkansas Secretary of State. Retrieved June 9, 2019.
- ^ "U.S. CONGRESS DISTRICT 04". Arkansas Secretary of State. Retrieved December 14, 2022.
- General
- Martis, Kenneth C. (1989). The Historical Atlas of Political Parties in the United States Congress. New York: Macmillan Publishing Company.
- Martis, Kenneth C. (1982). The Historical Atlas of United States Congressional Districts. New York: Macmillan Publishing Company.
- Congressional Biographical Directory of the United States 1774–present
34°13′11″N 93°12′16″W / 34.21972°N 93.20444°W