


Summary
Background radiation is a measure of the level of ionizing radiation present in the environment at a particular location which is not due to deliberate introduction of radiation sources.
Background radiation originates from a variety of sources, both natural and artificial. These include both cosmic radiation and environmental radioactivity from naturally occurring radioactive materials (such as radon and radium), as well as man-made medical X-rays, fallout from nuclear weapons testing and nuclear accidents.
Definition edit
Background radiation is defined by the International Atomic Energy Agency as "Dose or the dose rate (or an observed measure related to the dose or dose rate) attributable to all sources other than the one(s) specified.[1] A distinction is thus made between the dose which is already in a location, which is defined here as being "background", and the dose due to a deliberately introduced and specified source. This is important where radiation measurements are taken of a specified radiation source, where the existing background may affect this measurement. An example would be measurement of radioactive contamination in a gamma radiation background, which could increase the total reading above that expected from the contamination alone.
However, if no radiation source is specified as being of concern, then the total radiation dose measurement at a location is generally called the background radiation, and this is usually the case where an ambient dose rate is measured for environmental purposes.
Background dose rate examples edit
Background radiation varies with location and time, and the following table gives examples:
| Radiation source | World[2] | US[3] | Japan[4] | Remark |
|---|---|---|---|---|
| Inhalation of air | 1.26 | 2.28 | 0.40 | mainly from radon, depends on indoor accumulation |
| Ingestion of food & water | 0.29 | 0.28 | 0.40 | (potassium-40, carbon-14, etc.) |
| Terrestrial radiation from ground | 0.48 | 0.21 | 0.40 | depends on soil and building material |
| Cosmic radiation from space | 0.39 | 0.33 | 0.30 | depends on altitude |
| sub total (natural) | 2.40 | 3.10 | 1.50 | sizeable population groups receive 10–20 mSv |
| Medical | 0.60 | 3.00 | 2.30 | worldwide figure excludes radiotherapy; US figure is mostly CT scans and nuclear medicine. |
| Consumer items | – | 0.13 | cigarettes, air travel, building materials, etc. | |
| Atmospheric nuclear testing | 0.005 | – | 0.01 | peak of 0.11 mSv in 1963 and declining since; higher near sites |
| Occupational exposure | 0.005 | 0.005 | 0.01 | worldwide average to workers only is 0.7 mSv, mostly due to radon in mines;[2] US is mostly due to medical and aviation workers.[3] |
| Chernobyl accident | 0.002 | – | 0.01 | peak of 0.04 mSv in 1986 and declining since; higher near site |
| Nuclear fuel cycle | 0.0002 | 0.001 | up to 0.02 mSv near sites; excludes occupational exposure | |
| Other | – | 0.003 | Industrial, security, medical, educational, and research | |
| sub total (artificial) | 0.61 | 3.14 | 2.33 | |
| Total | 3.01 | 6.24 | 3.83 | millisieverts per year |
Natural background radiation edit


Radioactive material is found throughout nature. Detectable amounts occur naturally in soil, rocks, water, air, and vegetation, from which it is inhaled and ingested into the body. In addition to this internal exposure, humans also receive external exposure from radioactive materials that remain outside the body and from cosmic radiation from space. The worldwide average natural dose to humans is about 2.4 mSv (240 mrem) per year.[2] This is four times the worldwide average artificial radiation exposure, which in 2008 amounted to about 0.6 millisieverts (60 mrem) per year. In some developed countries, like the US and Japan, artificial exposure is, on average, greater than the natural exposure, due to greater access to medical imaging. In Europe, average natural background exposure by country ranges from under 2 mSv (200 mrem) annually in the United Kingdom to more than 7 mSv (700 mrem) annually for some groups of people in Finland.[5]
The International Atomic Energy Agency states:
- "Exposure to radiation from natural sources is an inescapable feature of everyday life in both working and public environments. This exposure is in most cases of little or no concern to society, but in certain situations the introduction of health protection measures needs to be considered, for example when working with uranium and thorium ores and other Naturally Occurring Radioactive Material (NORM). These situations have become the focus of greater attention by the Agency in recent years."[6]
Terrestrial sources edit
Terrestrial radiation, for the purpose of the table above, only includes sources that remain external to the body. The major radionuclides of concern are potassium, uranium and thorium and their decay products, some of which, like radium and radon are intensely radioactive but occur in low concentrations. Most of these sources have been decreasing, due to radioactive decay since the formation of the Earth, because there is no significant amount currently transported to the Earth. Thus, the present activity on Earth from uranium-238 is only half as much as it originally was because of its 4.5 billion year half-life, and potassium-40 (half-life 1.25 billion years) is only at about 8% of original activity. But during the time that humans have existed the amount of radiation has decreased very little.
Many shorter half-life (and thus more intensely radioactive) isotopes have not decayed out of the terrestrial environment because of their on-going natural production. Examples of these are radium-226 (decay product of thorium-230 in decay chain of uranium-238) and radon-222 (a decay product of radium-226 in said chain).
Thorium and uranium (and their daughters) primarily undergo alpha and beta decay, and are not easily detectable. However, many of their daughter products are strong gamma emitters. Thorium-232 is detectable via a 239 keV peak from lead-212, 511, 583 and 2614 keV from thallium-208, and 911 and 969 keV from actinium-228. Uranium-238 manifests as 609, 1120, and 1764 keV peaks of bismuth-214 (cf. the same peak for atmospheric radon). Potassium-40 is detectable directly via its 1461 keV gamma peak.[7]
The level over the sea and other large bodies of water tends to be about a tenth of the terrestrial background. Conversely, coastal areas (and areas by the side of fresh water) may have an additional contribution from dispersed sediment.[7]
Airborne sources edit
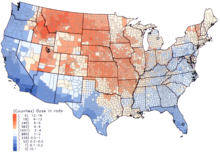
The biggest source of natural background radiation is airborne radon, a radioactive gas that emanates from the ground. Radon and its isotopes, parent radionuclides, and decay products all contribute to an average inhaled dose of 1.26 mSv/a (millisievert per year). Radon is unevenly distributed and varies with weather, such that much higher doses apply to many areas of the world, where it represents a significant health hazard. Concentrations over 500 times the world average have been found inside buildings in Scandinavia, the United States, Iran, and the Czech Republic.[8] Radon is a decay product of uranium, which is relatively common in the Earth's crust, but more concentrated in ore-bearing rocks scattered around the world. Radon seeps out of these ores into the atmosphere or into ground water or infiltrates into buildings. It can be inhaled into the lungs, along with its decay products, where they will reside for a period of time after exposure.
Although radon is naturally occurring, exposure can be enhanced or diminished by human activity, notably house construction. A poorly sealed dwelling floor, or poor basement ventilation, in an otherwise well insulated house can result in the accumulation of radon within the dwelling, exposing its residents to high concentrations. The widespread construction of well insulated and sealed homes in the northern industrialized world has led to radon becoming the primary source of background radiation in some localities in northern North America and Europe.[citation needed] Basement sealing and suction ventilation reduce exposure. Some building materials, for example lightweight concrete with alum shale, phosphogypsum and Italian tuff, may emanate radon if they contain radium and are porous to gas.[8]
Radiation exposure from radon is indirect. Radon has a short half-life (4 days) and decays into other solid particulate radium-series radioactive nuclides. These radioactive particles are inhaled and remain lodged in the lungs, causing continued exposure. Radon is thus assumed to be the second leading cause of lung cancer after smoking, and accounts for 15,000 to 22,000 cancer deaths per year in the US alone.[9][better source needed] However, the discussion about the opposite experimental results is still going on.[10]
About 100,000 Bq/m3 of radon was found in Stanley Watras's basement in 1984.[11][12] He and his neighbours in Boyertown, Pennsylvania, United States may hold the record for the most radioactive dwellings in the world. International radiation protection organizations estimate that a committed dose may be calculated by multiplying the equilibrium equivalent concentration (EEC) of radon by a factor of 8 to 9 nSv·m3/Bq·h and the EEC of thoron by a factor of 40 nSv·m3/Bq·h.[2]
Most of the atmospheric background is caused by radon and its decay products. The gamma spectrum shows prominent peaks at 609, 1120, and 1764 keV, belonging to bismuth-214, a radon decay product. The atmospheric background varies greatly with wind direction and meteorological conditions. Radon also can be released from the ground in bursts and then form "radon clouds" capable of traveling tens of kilometers.[7]
Cosmic radiation edit
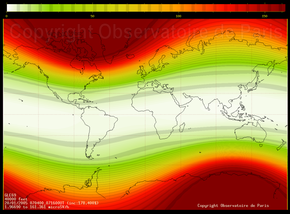
The Earth and all living things on it are constantly bombarded by radiation from outer space. This radiation primarily consists of positively charged ions from protons to iron and larger nuclei derived from outside the Solar System. This radiation interacts with atoms in the atmosphere to create an air shower of secondary radiation, including X-rays, muons, protons, alpha particles, pions, electrons, and neutrons. The immediate dose from cosmic radiation is largely from muons, neutrons, and electrons, and this dose varies in different parts of the world based largely on the geomagnetic field and altitude. For example, the city of Denver in the United States (at 1650 meters elevation) receives a cosmic ray dose roughly twice that of a location at sea level.[13] This radiation is much more intense in the upper troposphere, around 10 km altitude, and is thus of particular concern for airline crews and frequent passengers, who spend many hours per year in this environment. During their flights airline crews typically get an additional occupational dose between 2.2 mSv (220 mrem) per year [14] and 2.19 mSv/year,[15] according to various studies.[16]
Similarly, cosmic rays cause higher background exposure in astronauts than in humans on the surface of Earth. Astronauts in low orbits, such as in the International Space Station or the Space Shuttle, are partially shielded by the magnetic field of the Earth, but also suffer from the Van Allen radiation belt which accumulates cosmic rays and results from the Earth's magnetic field. Outside low Earth orbit, as experienced by the Apollo astronauts who traveled to the Moon, this background radiation is much more intense, and represents a considerable obstacle to potential future long term human exploration of the Moon or Mars.
Cosmic rays also cause elemental transmutation in the atmosphere, in which secondary radiation generated by the cosmic rays combines with atomic nuclei in the atmosphere to generate different nuclides. Many so-called cosmogenic nuclides can be produced, but probably the most notable is carbon-14, which is produced by interactions with nitrogen atoms. These cosmogenic nuclides eventually reach the Earth's surface and can be incorporated into living organisms. The production of these nuclides varies slightly with short-term variations in solar cosmic ray flux, but is considered practically constant over long scales of thousands to millions of years. The constant production, incorporation into organisms and relatively short half-life of carbon-14 are the principles used in radiocarbon dating of ancient biological materials, such as wooden artifacts or human remains.
The cosmic radiation at sea level usually manifests as 511 keV gamma rays from annihilation of positrons created by nuclear reactions of high energy particles and gamma rays. At higher altitudes there is also the contribution of continuous bremsstrahlung spectrum.[7]
Food and water edit
Two of the essential elements that make up the human body, namely potassium and carbon, have radioactive isotopes that add significantly to our background radiation dose. An average human contains about 17 milligrams of potassium-40 (40K) and about 24 nanograms (10−9 g) of carbon-14 (14C),[17] (half-life 5,730 years). Excluding internal contamination by external radioactive material, these two are the largest components of internal radiation exposure from biologically functional components of the human body. About 4,000 nuclei of 40K [18] decay per second, and a similar number of 14C. The energy of beta particles produced by 40K is about 10 times that from the beta particles from 14C decay.
14C is present in the human body at a level of about 3700 Bq (0.1 μCi) with a biological half-life of 40 days.[19] This means there are about 3700 beta particles per second produced by the decay of 14C. However, a 14C atom is in the genetic information of about half the cells, while potassium is not a component of DNA. The decay of a 14C atom inside DNA in one person happens about 50 times per second, changing a carbon atom to one of nitrogen.[20]
The global average internal dose from radionuclides other than radon and its decay products is 0.29 mSv/a, of which 0.17 mSv/a comes from 40K, 0.12 mSv/a comes from the uranium and thorium series, and 12 μSv/a comes from 14C.[2]
Areas with high natural background radiation edit
Some areas have greater dosage than the country-wide averages.[21] In the world in general, exceptionally high natural background locales include Ramsar in Iran, Guarapari in Brazil, Karunagappalli in India,[22] Arkaroola in Australia[23] and Yangjiang in China.[24]
The highest level of purely natural radiation ever recorded on the Earth's surface was 90 μGy/h on a Brazilian black beach (areia preta in Portuguese) composed of monazite.[25] This rate would convert to 0.8 Gy/a for year-round continuous exposure, but in fact the levels vary seasonally and are much lower in the nearest residences. The record measurement has not been duplicated and is omitted from UNSCEAR's latest reports. Nearby tourist beaches in Guarapari and Cumuruxatiba were later evaluated at 14 and 15 μGy/h.[26][27] Note that the values quoted here are in Grays. To convert to Sieverts (Sv) a radiation weighting factor is required; these weighting factors vary from 1 (beta & gamma) to 20 (alpha particles).
The highest background radiation in an inhabited area is found in Ramsar, primarily due to the use of local naturally radioactive limestone as a building material. The 1000 most exposed residents receive an average external effective radiation dose of 6 mSv (600 mrem) per year, six times the ICRP recommended limit for exposure to the public from artificial sources.[28] They additionally receive a substantial internal dose from radon. Record radiation levels were found in a house where the effective dose due to ambient radiation fields was 131 mSv (13.1 rem) per year, and the internal committed dose from radon was 72 mSv (7.2 rem) per year.[28] This unique case is over 80 times higher than the world average natural human exposure to radiation.
Epidemiological studies are underway to identify health effects associated with the high radiation levels in Ramsar. It is much too early to draw unambiguous statistically significant conclusions.[28] While so far support for beneficial effects of chronic radiation (like longer lifespan) has been observed in few places only,[28] a protective and adaptive effect is suggested by at least one study whose authors nonetheless caution that data from Ramsar are not yet sufficiently strong to relax existing regulatory dose limits.[29] However, the recent statistical analyses discussed that there is no correlation between the risk of negative health effects and elevated level of natural background radiation.[30]
Photoelectric edit
Background radiation doses in the immediate vicinity of particles of high atomic number materials, within the human body, have a small enhancement due to the photoelectric effect.[31]
Neutron background edit
Most of the natural neutron background is a product of cosmic rays interacting with the atmosphere. The neutron energy peaks at around 1 MeV and rapidly drops above. At sea level, the production of neutrons is about 20 neutrons per second per kilogram of material interacting with the cosmic rays (or, about 100–300 neutrons per square meter per second). The flux is dependent on geomagnetic latitude, with a maximum near the magnetic poles. At solar minimums, due to lower solar magnetic field shielding, the flux is about twice as high vs the solar maximum. It also dramatically increases during solar flares. In the vicinity of larger heavier objects, e.g. buildings or ships, the neutron flux measures higher; this is known as "cosmic ray induced neutron signature", or "ship effect" as it was first detected with ships at sea.[7]
Artificial background radiation edit
Atmospheric nuclear testing edit
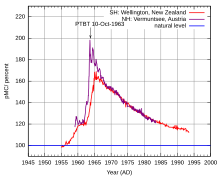
Frequent above-ground nuclear explosions between the 1940s and 1960s scattered a substantial amount of radioactive contamination. Some of this contamination is local, rendering the immediate surroundings highly radioactive, while some of it is carried longer distances as nuclear fallout; some of this material is dispersed worldwide. The increase in background radiation due to these tests peaked in 1963 at about 0.15 mSv per year worldwide, or about 7% of average background dose from all sources. The Limited Test Ban Treaty of 1963 prohibited above-ground tests, thus by the year 2000 the worldwide dose from these tests has decreased to only 0.005 mSv per year.[35]
Occupational exposure edit
The International Commission on Radiological Protection recommends limiting occupational radiation exposure to 50 mSv (5 rem) per year, and 100 mSv (10 rem) in 5 years.[36]
However, background radiation for occupational doses includes radiation that is not measured by radiation dose instruments in potential occupational exposure conditions. This includes both offsite "natural background radiation" and any medical radiation doses. This value is not typically measured or known from surveys, such that variations in the total dose to individual workers is not known. This can be a significant confounding factor in assessing radiation exposure effects in a population of workers who may have significantly different natural background and medical radiation doses. This is most significant when the occupational doses are very low.
At an IAEA conference in 2002, it was recommended that occupational doses below 1–2 mSv per year do not warrant regulatory scrutiny.[37]
Nuclear accidents edit

Under normal circumstances, nuclear reactors release small amounts of radioactive gases, which cause small radiation exposures to the public. Events classified on the International Nuclear Event Scale as incidents typically do not release any additional radioactive substances into the environment. Large releases of radioactivity from nuclear reactors are extremely rare. To the present day, there were two major civilian accidents – the Chernobyl accident and the Fukushima I nuclear accidents – which caused substantial contamination. The Chernobyl accident was the only one to cause immediate deaths.
Total doses from the Chernobyl accident ranged from 10 to 50 mSv over 20 years for the inhabitants of the affected areas, with most of the dose received in the first years after the disaster, and over 100 mSv for liquidators. There were 28 deaths from acute radiation syndrome.[38]
Total doses from the Fukushima I accidents were between 1 and 15 mSv for the inhabitants of the affected areas. Thyroid doses for children were below 50 mSv. 167 cleanup workers received doses above 100 mSv, with 6 of them receiving more than 250 mSv (the Japanese exposure limit for emergency response workers).[39]
The average dose from the Three Mile Island accident was 0.01 mSv.[40]
Non-civilian: In addition to the civilian accidents described above, several accidents at early nuclear weapons facilities – such as the Windscale fire, the contamination of the Techa River by the nuclear waste from the Mayak compound, and the Kyshtym disaster at the same compound – released substantial radioactivity into the environment. The Windscale fire resulted in thyroid doses of 5–20 mSv for adults and 10–60 mSv for children.[41] The doses from the accidents at Mayak are unknown.
Nuclear fuel cycle edit
The Nuclear Regulatory Commission, the United States Environmental Protection Agency, and other U.S. and international agencies, require that licensees limit radiation exposure to individual members of the public to 1 mSv (100 mrem) per year.
Energy sources edit
Per UNECE life-cycle assessment, nearly all sources of energy result in some level of occupational and public exposure to radionuclides as result of their manufacturing or operations. The following table uses man·Sievert/GW-annum:[42]
| Source | Public | Occupational |
|---|---|---|
| Nuclear power | 0.43 | 4.5 |
| Coal (modern) | 0.7 | 11 |
| Coal (older) | 1.4 | 11 |
| Natural gas | 0.1 | 0.02 |
| Oil | 0.0003 | 0.15 |
| Geothermal | 1–20 | 0.05 |
| Solar power | 0.8 | |
| Wind power | 0.1 | |
| Biomass | 0.01 |
Coal burning edit
Coal plants emit radiation in the form of radioactive fly ash which is inhaled and ingested by neighbours, and incorporated into crops. A 1978 paper from Oak Ridge National Laboratory estimated that coal-fired power plants of that time may contribute a whole-body committed dose of 19 μSv/a to their immediate neighbours in a radius of 500 m.[43] The United Nations Scientific Committee on the Effects of Atomic Radiation's 1988 report estimated the committed dose 1 km away to be 20 μSv/a for older plants or 1 μSv/a for newer plants with improved fly ash capture, but was unable to confirm these numbers by test.[44] When coal is burned, uranium, thorium and all the uranium daughters accumulated by disintegration – radium, radon, polonium – are released.[45] Radioactive materials previously buried underground in coal deposits are released as fly ash or, if fly ash is captured, may be incorporated into concrete manufactured with fly ash.
Other sources of dose uptake edit
Medical edit
The global average human exposure to artificial radiation is 0.6 mSv/a, primarily from medical imaging. This medical component can range much higher, with an average of 3 mSv per year across the USA population.[3] Other human contributors include smoking, air travel, radioactive building materials, historical nuclear weapons testing, nuclear power accidents and nuclear industry operation.
A typical chest x-ray delivers 20 μSv (2 mrem) of effective dose.[46] A dental x-ray delivers a dose of 5 to 10 μSv.[47] A CT scan delivers an effective dose to the whole body ranging from 1 to 20 mSv (100 to 2000 mrem). The average American receives about 3 mSv of diagnostic medical dose per year; countries with the lowest levels of health care receive almost none. Radiation treatment for various diseases also accounts for some dose, both in individuals and in those around them.
Consumer items edit
Cigarettes contain polonium-210, originating from the decay products of radon, which stick to tobacco leaves. Heavy smoking results in a radiation dose of 160 mSv/year to localized spots at the bifurcations of segmental bronchi in the lungs from the decay of polonium-210. This dose is not readily comparable to the radiation protection limits, since the latter deal with whole body doses, while the dose from smoking is delivered to a very small portion of the body.[48]
Radiation metrology edit
In a radiation metrology laboratory, background radiation refers to the measured value from any incidental sources that affect an instrument when a specific radiation source sample is being measured. This background contribution, which is established as a stable value by multiple measurements, usually before and after sample measurement, is subtracted from the rate measured when the sample is being measured.
This is in accordance with the International Atomic Energy Agency definition of background as being "Dose or dose rate (or an observed measure related to the dose or dose rate) attributable to all sources other than the one(s) specified.[1]
The same issue occurs with radiation protection instruments, where a reading from an instrument may be affected by the background radiation. An example of this is a scintillation detector used for surface contamination monitoring. In an elevated gamma background the scintillator material will be affected by the background gamma, which will add to the reading obtained from any contamination which is being monitored. In extreme cases it will make the instrument unusable as the background swamps the lower level of radiation from the contamination. In such instruments the background can be continually monitored in the "Ready" state, and subtracted from any reading obtained when being used in "Measuring" mode.
Regular Radiation measurement is carried out at multiple levels. Government agencies compile radiation readings as part of environmental monitoring mandates, often making the readings available to the public and sometimes in near-real-time. Collaborative groups and private individuals may also make real-time readings available to the public. Instruments used for radiation measurement include the Geiger–Müller tube and the Scintillation detector. The former is usually more compact and affordable and reacts to several radiation types, while the latter is more complex and can detect specific radiation energies and types. Readings indicate radiation levels from all sources including background, and real-time readings are in general unvalidated, but correlation between independent detectors increases confidence in measured levels.
List of near-real-time government radiation measurement sites, employing multiple instrument types:
- Europe and Canada: European Radiological Data Exchange Platform (EURDEP) Simple map of Gamma Dose Rates
- USA: EPA Radnet near-real-time and laboratory data by state
List of international near-real-time collaborative/private measurement sites, employing primarily Geiger-Muller detectors:
- GMC map: http://www.gmcmap.com/ (mix of old-data detector stations and some near-real-time ones)
- Netc: http://www.netc.com/
- Radmon: http://www.radmon.org/
- Radiation Network: http://radiationnetwork.com/
- Radioactive@Home: http://radioactiveathome.org/map/ Archived 29 March 2016 at the Wayback Machine
- Safecast: http://safecast.org/tilemap (the green circles are real-time detectors)
- uRad Monitor: http://www.uradmonitor.com/
See also edit
References edit
- ^ a b International Atomic Energy Agency (2007). IAEA Safety Glossary: Terminology Used in Nuclear Safety and Radiation Protection. ISBN 9789201007070.
- ^ a b c d e United Nations Scientific Committee on the Effects of Atomic Radiation (2008). Sources and effects of ionizing radiation. New York: United Nations (published 2010). p. 4. ISBN 978-92-1-142274-0. Retrieved 9 November 2012.
- ^ a b c Ionizing radiation exposure of the population of the United States. Bethesda, Md.: National Council on Radiation Protection and Measurements. 2009. ISBN 978-0-929600-98-7. NCRP No. 160. Archived from the original on 2 February 2014. Retrieved 9 November 2012.
- ^ Ministry of Education, Culture, Sports, Science, and Technology of Japan "Radiation in environment" Archived 22 March 2011 at the Wayback Machine retrieved 2011-6-29
- ^ "Naturally-Occurring Radioactive Materials (NORM)". World Nuclear Association. March 2019. Archived from the original on 20 January 2016. Retrieved 26 August 2014.
- ^ "Exposure to radiation from natural sources". Nuclear Safety & Security. IAEA. Archived from the original on 9 February 2016. Retrieved 4 January 2016.
- ^ a b c d e Gary W. Philips, David J. Nagel, Timothy Coffey – A Primer on the Detection of Nuclear and Radiological Weapons, Center for Technology and National Security Policy, National Defense University, May 2005
- ^ a b United Nations Scientific Committee on the Effects of Atomic Radiation (2006). "Annex E: Sources-to-effects assessment for radon in homes and workplaces" (PDF). Effects of Ionizing Radiation. Vol. II. New York: United Nations (published 2008). ISBN 978-92-1-142263-4. Archived (PDF) from the original on 9 October 2022. Retrieved 2 December 2012.
- ^ "Radon and Cancer: Questions and Answers – National Cancer Institute (USA)". 6 December 2011.
- ^ Fornalski, K. W.; Adams, R.; Allison, W.; Corrice, L. E.; Cuttler, J. M.; Davey, Ch.; Dobrzyński, L.; Esposito, V. J.; Feinendegen, L. E.; Gomez, L. S.; Lewis, P.; Mahn, J.; Miller, M. L.; Pennington, Ch. W.; Sacks, B.; Sutou, S.; Welsh, J. S. (2015). "The assumption of radon-induced cancer risk". Cancer Causes & Control. 10 (26): 1517–18. doi:10.1007/s10552-015-0638-9. PMID 26223888. S2CID 15952263.
- ^ Thomas, John J.; Thomas, Barbara R.; Overeynder, Helen M. (27–30 September 1995). Indoor Radon Concentration Data: Its Geographic and Geologic Distribution, an Example from the Capital District, NY (PDF). International Radon Symposium. Nashville, TN: American Association of Radon Scientists and Technologists. Archived (PDF) from the original on 9 October 2022. Retrieved 28 November 2012.
- ^ Upfal, Mark J.; Johnson, Christine (2003). "65 Residential Radon" (PDF). In Greenberg, Michael I.; Hamilton, Richard J.; Phillips, Scott D.; McCluskey, Gayla J. (eds.). Occupational, industrial, and environmental toxicology (2nd ed.). St Louis, Missouri: Mosby. ISBN 9780323013406. Archived (PDF) from the original on 9 October 2022. Retrieved 28 November 2012.
- ^ "Background Radiation & Other Sources of Exposure". Radiation Safety Training. Miami University. Retrieved 30 September 2016.
- ^ "Radiation Exposure During Commercial Airline Flights". Retrieved 17 March 2011.
- ^ Health Physics Society. "Radiation exposure during commercial airline flights". Retrieved 24 January 2013.
- ^ "Radiobiology Research Team". Federal Aviation Administration. Retrieved 23 January 2022.
- ^ "Radioactive Human Body". sciencedemonstrations.fas.harvard.edu. Retrieved 12 October 2022.
- ^ "Radioactive human body – Harvard University Natural Science Lecture Demonstrations". Archived from the original on 12 June 2015.
- ^ "Carbon 14" (PDF). Human Health Fact Sheet. Argonne National Lab. August 2005. Archived (PDF) from the original on 27 February 2008. Retrieved 4 April 2011.
- ^ Asimov, Isaac (1976) [1957]. "The Explosions Within Us". Only A Trillion (Revised and updated ed.). New York: ACE books. pp. 37–39. ISBN 978-1-157-09468-5.
- ^ Annual terrestrial radiation doses in the world Archived 23 June 2007 at the Wayback Machine
- ^ Nair, MK; Nambi, KS; Amma, NS; Gangadharan, P; Jayalekshmi, P; Jayadevan, S; Cherian, V; Reghuram, KN (1999). "Population study in the high natural background radiation area in Kerala, India". Radiation Research. 152 (6 Suppl): S145–48. Bibcode:1999RadR..152S.145N. doi:10.2307/3580134. JSTOR 3580134. PMID 10564957.
- ^ "Extreme Slime". Catalyst. ABC. 3 October 2002.
- ^ Zhang, SP (2010). "Mechanism study of adaptive response in high background radiation area of Yangjiang in China". Zhonghua Yu Fang Yi Xue Za Zhi. 44 (9): 815–19. PMID 21092626.
- ^ United Nations Scientific Committee on the Effects of Atomic Radiation (2000). "Annex B". Sources and Effects of Ionizing Radiation. Vol. 1. United Nations. p. 121. Retrieved 11 November 2012.
- ^ Freitas, AC; Alencar, AS (2004). "Gamma dose rates and distribution of natural radionuclides in sand beaches – Ilha Grande, Southeastern Brazil" (PDF). Journal of Environmental Radioactivity. 75 (2): 211–23. doi:10.1016/j.jenvrad.2004.01.002. ISSN 0265-931X. PMID 15172728. Archived from the original (PDF) on 21 February 2014. Retrieved 2 December 2012.
- ^ Vasconcelos, Danilo C.; et al. (27 September – 2 October 2009). Natural Radioactivity in Extreme South of Bahia, Brazil Using Gamma-Ray Spectrometry (PDF). International Nuclear Atlantic Conference. Rio de Janeiro: Associação Brasileira de Energia Nuclear. ISBN 978-85-99141-03-8. Archived from the original (PDF) on 21 February 2014. Retrieved 2 December 2012.
- ^ a b c d Hendry, Jolyon H; Simon, Steven L; Wojcik, Andrzej; Sohrabi, Mehdi; Burkart, Werner; Cardis, Elisabeth; Laurier, Dominique; Tirmarche, Margot; Hayata, Isamu (1 June 2009). "Human exposure to high natural background radiation: what can it teach us about radiation risks?" (PDF). Journal of Radiological Protection. 29 (2A): A29–A42. Bibcode:2009JRP....29...29H. doi:10.1088/0952-4746/29/2A/S03. PMC 4030667. PMID 19454802. Archived from the original (PDF) on 21 October 2013. Retrieved 1 December 2012.
- ^ Ghiassi-nejad, M; Mortazavi, SM; Cameron, JR; Niroomand-rad, A; Karam, PA (January 2002). "Very high background radiation areas of Ramsar, Iran: preliminary biological studies" (PDF). Health Physics. 82 (1): 87–93 [92]. doi:10.1097/00004032-200201000-00011. PMID 11769138. S2CID 26685238. Archived (PDF) from the original on 9 October 2022. Retrieved 11 November 2012.
Our preliminary studies seem to indicate the presence of adaptive response in the cells of some Ramsar residents, but we do not claim to have seen hormetic effects in any of those studied. Given the apparent lack of ill effects among observed populations of these high dose rate areas, these data suggest that current dose limits may be overly conservative. However, the available data do not seem sufficient to cause national or international advisory bodies to change their current conservative radiation protection recommendations;
- ^ Dobrzyński, L.; Fornalski, K.W.; Feinendegen, L.E. (2015). "Cancer Mortality Among People Living in Areas With Various Levels of Natural Background Radiation". Dose-Response. 13 (3): 1–10. doi:10.1177/1559325815592391. PMC 4674188. PMID 26674931.
- ^ Pattison, J. E.; Hugtenburg, R. P.; Green, S. (2009). "Enhancement of natural background gamma-radiation dose around uranium microparticles in the human body". Journal of the Royal Society Interface. 7 (45): 603–11. doi:10.1098/rsif.2009.0300. PMC 2842777. PMID 19776147.
- ^ "Atmospheric δ14C record from Wellington". Trends: A Compendium of Data on Global Change. Carbon Dioxide Information Analysis Center. 1994. Archived from the original on 1 February 2014. Retrieved 11 June 2007.
- ^ Levin, I.; et al. (1994). "δ14C record from Vermunt". Trends: A Compendium of Data on Global Change. Carbon Dioxide Information Analysis Center. Archived from the original on 23 September 2008. Retrieved 4 January 2016.
- ^ "Radiocarbon dating". University of Utrecht. Retrieved 19 February 2008.
- ^ United Nations Scientific Committee on the Effects of Atomic Radiation (2000). Sources and Effects of Ionizing Radiation - UNSCEAR 2000 Report to the General Assembly, with Scientific Annexes (Report). Retrieved 12 September 2022.
- ^ ICRP (2007). The 2007 Recommendations of the International Commission on Radiological Protection. ICRP publication 103. Vol. 37. ISBN 978-0-7020-3048-2. Retrieved 17 May 2012.
{{cite book}}:|journal=ignored (help) - ^ "OCCUPATIONAL RADIATION PROTECTION: PROTECTING WORKERS AGAINST EXPOSURE TO IONIZING RADIATION" (PDF). International Atomic Energy Agency. 30 August 2002. Archived (PDF) from the original on 29 November 2003. Retrieved 21 October 2022.
- ^ World Health Organization (April 2006). "Health effects of the Chernobyl accident: an overview". Retrieved 24 January 2013.
- ^ Geoff Brumfiel (23 May 2012). "Fukushima's doses tallied". Nature. 485 (7399): 423–24. Bibcode:2012Natur.485..423B. doi:10.1038/485423a. PMID 22622542.
- ^ U.S. Nuclear Regulatory Commission (August 2009). "Backgrounder on the Three Mile Island Accident". Retrieved 24 January 2013.
- ^ "Radiological Consequences of the 1957 Windscale Fire". 10 October 1997. Archived from the original on 17 May 2013. Retrieved 24 January 2013.
- ^ "Life Cycle Assessment of Electricity Generation Options | UNECE". unece.org. Retrieved 8 November 2021.
- ^ McBride, J. P.; Moore, R. E.; Witherspoon, J. P.; Blanco, R. E. (8 December 1978). "Radiological impact of airborne effluents of coal and nuclear plants" (PDF). Science. 202 (4372): 1045–50. Bibcode:1978Sci...202.1045M. doi:10.1126/science.202.4372.1045. PMID 17777943. S2CID 41057679. Archived from the original (PDF) on 27 September 2012. Retrieved 15 November 2012.
- ^ United Nations Scientific Committee on the Effects of Atomic Radiation (1988). "Annex A". Sources, Effects and Risks of Ionizing Radiation. Vol. 120. New York: United Nations. pp. 187–88. Bibcode:1989RadR..120..187K. doi:10.2307/3577647. ISBN 978-92-1-142143-9. JSTOR 3577647. S2CID 7316994. Retrieved 16 November 2012.
{{cite book}}:|journal=ignored (help) - ^ Gabbard, Alex (1993). "Coal Combustion: Nuclear Resource or Danger?". Oak Ridge National Laboratory Review. 26 (3–4): 18–19. Archived from the original on 5 February 2007.
- ^ Wall, B.F.; Hart, D. (1997). "Revised Radiation Doses for Typical X-Ray Examinations" (PDF). The British Journal of Radiology. 70 (833): 437–439. doi:10.1259/bjr.70.833.9227222. PMID 9227222. Archived (PDF) from the original on 9 October 2022. Retrieved 18 May 2012. (5,000 patient dose measurements from 375 hospitals)
- ^ Hart, D.; Wall, B.F. (2002). Radiation Exposure of the UK Population from Medical and Dental X-ray Examinations (PDF). National Radiological Protection Board. p. 9. ISBN 978-0859514682. Archived (PDF) from the original on 9 October 2022. Retrieved 18 May 2012.[permanent dead link]
- ^ Dade W. Moeller. "Doses from cigarette smoking". Health Physics Society. Archived from the original on 2 August 2014. Retrieved 24 January 2013.
External links edit
- Background radiation description from the Radiation Effects Research Foundation
- Environmental and Background Radiation FAQ from the Health Physics Society
- Radiation Dose Chart Archived 15 July 2018 at the Wayback Machine from the American Nuclear Society
- Radiation Dose Calculator from the United States Environmental Protection Agency