
KNOWPIA
WELCOME TO KNOWPIA

Barrow-in-Furness Borough Council elections 
Summary
Barrow-in-Furness Borough Council in Cumbria, England, was elected every four years. This was changed in 2011 from the previous situation where one-third of the council was elected each year, followed by one year where there was an election to Cumbria County Council instead.[1]
The council was established in 1974 and abolished in 2023.
Since the last boundary changes in 2008, 36 councillors had been elected from 13 wards.[1]
Political control edit
Since the first election to the council in 1973 political control of the council has been held by the following parties:[2]
| Party in control | Years | |
|---|---|---|
| Labour | 1973–1976 | |
| Conservative | 1976–1979 | |
| Labour | 1979–1991 | |
| No overall control | 1991–1994 | |
| Labour | 1994–1999 | |
| No overall control | 1999–2003 | |
| Labour | 2003–2006 | |
| No overall control | 2006–2011 | |
| Labour | 2011–2023 | |
Leadership edit
The leaders of the council since 2008 have been:[3]
| Councillor | Party | From | To | |
|---|---|---|---|---|
| Jack Richardson | Conservative | 14 May 2008 | 17 May 2011 | |
| Dave Pidduck | Labour | 17 May 2011 | 20 May 2019 | |
| Ann Thomson | Labour | 20 May 2019 | 30 Jan 2023 | |
Council elections edit
- 1973 Barrow-in-Furness Borough Council election
- 1976 Barrow-in-Furness Borough Council election
- 1979 Barrow-in-Furness Borough Council election (New ward boundaries)[4]
- 1980 Barrow-in-Furness Borough Council election
- 1982 Barrow-in-Furness Borough Council election
- 1983 Barrow-in-Furness Borough Council election
- 1984 Barrow-in-Furness Borough Council election
- 1986 Barrow-in-Furness Borough Council election
- 1987 Barrow-in-Furness Borough Council election
- 1988 Barrow-in-Furness Borough Council election
- 1990 Barrow-in-Furness Borough Council election
- 1991 Barrow-in-Furness Borough Council election
- 1992 Barrow-in-Furness Borough Council election
- 1994 Barrow-in-Furness Borough Council election
- 1995 Barrow-in-Furness Borough Council election
- 1996 Barrow-in-Furness Borough Council election
- 1998 Barrow-in-Furness Borough Council election
- 1999 Barrow-in-Furness Borough Council election (New ward boundaries)[5][6]
- 2000 Barrow-in-Furness Borough Council election
- 2002 Barrow-in-Furness Borough Council election
- 2003 Barrow-in-Furness Borough Council election
- 2004 Barrow-in-Furness Borough Council election
- 2006 Barrow-in-Furness Borough Council election
- 2007 Barrow-in-Furness Borough Council election
- 2008 Barrow-in-Furness Borough Council election (New ward boundaries reduced the number of seats by 2)[7][8]
- 2010 Barrow-in-Furness Borough Council election
- 2011 Barrow-in-Furness Borough Council election
- 2015 Barrow-in-Furness Borough Council election
- 2019 Barrow-in-Furness Borough Council election
Borough result maps edit
-
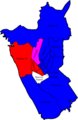 2006 results map
 -
 2007 results map
 -
 2008 results map
 -
 2010 results map
 -
 2011 results map
 -
 2015 results map
 -
 2019 results map


By-election results edit
1994-1998 edit
| Party | Candidate | Votes | % | ±% | |
|---|---|---|---|---|---|
| Labour | 1,592 | 65.0 | -15.8 | ||
| Conservative | 500 | 20.4 | +1.2 | ||
| Independent | 357 | 14.6 | +14.6 | ||
| Majority | 1,092 | 44.6 | |||
| Turnout | 2,449 | ||||
| Labour hold | Swing | ||||
| Party | Candidate | Votes | % | ±% | |
|---|---|---|---|---|---|
| Labour | 2,145 | 71.3 | -1.4 | ||
| Conservative | 864 | 28.7 | +1.4 | ||
| Majority | 1,281 | 42.6 | |||
| Turnout | 3,009 | ||||
| Labour hold | Swing | ||||
1998-2002 edit
| Party | Candidate | Votes | % | ±% | |
|---|---|---|---|---|---|
| Conservative | 587 | 65.1 | -15.3 | ||
| Labour | 315 | 34.9 | +15.3 | ||
| Majority | 272 | 30.2 | |||
| Turnout | 902 | 20.8 | |||
| Conservative hold | Swing | ||||
2006-2011 edit
| Party | Candidate | Votes | % | ±% | |
|---|---|---|---|---|---|
| Conservative | Katherine Unwin | 400 | 44.3 | -8.0 | |
| Labour | Denis Bell | 355 | 39.4 | -8.3 | |
| Socialist People's Party | June Gibbons | 147 | 16.3 | +16.3 | |
| Majority | 45 | 4.9 | |||
| Turnout | 902 | 18.6 | |||
| Conservative hold | Swing | ||||
| Party | Candidate | Votes | % | ±% | |
|---|---|---|---|---|---|
| Conservative | Bob Maltman | 478 | 52.3 | +9.4 | |
| Labour | Lorraine Biggins | 177 | 19.4 | -1.7 | |
| Socialist People's Party | Sarah Martinez | 155 | 17.0 | +17.0 | |
| BNP | Mike Ashburner | 104 | 11.4 | +11.4 | |
| Majority | 301 | 32.93 | |||
| Turnout | 914 | 21.9 | |||
| Conservative hold | Swing | ||||
2015-2019 edit
| Party | Candidate | Votes | % | ±% | |
|---|---|---|---|---|---|
| Labour | Michael Cassells | 428 | 53.0 | -24.1 | |
| UKIP | Colin Rudd | 193 | 23.9 | +1.0 | |
| Conservative | Carole Friend | 187 | 23.1 | +23.1 | |
| Majority | 235 | 29.1 | |||
| Turnout | 808 | ||||
| Labour hold | Swing | ||||
| Party | Candidate | Votes | % | ±% | |
|---|---|---|---|---|---|
| Labour | Shaun Blezzard | 595 | 47.7 | -3.4 | |
| Conservative | Des English | 415 | 33.3 | -15.6 | |
| UKIP | Dick Young | 237 | 19.0 | N/A | |
| Majority | 180 | 14.4 | |||
| Turnout | 21.4 | ||||
| Labour gain from Conservative | Swing | ||||
The by-election was triggered by the death of Councillor Bill Bleasdale of the Conservative Party.[13]
| Party | Candidate | Votes | % | ±% | |
|---|---|---|---|---|---|
| Labour | Lee Roberts | 317 | 52.1 | -3.0 | |
| Conservative | Roy Worthington | 257 | 42.3 | -2.6 | |
| UKIP | Colin Rudd | 34 | 5.6 | +5.6 | |
| Majority | 60 | 9.9 | |||
| Turnout | 608 | ||||
| Labour hold | Swing | ||||
2019-2023 edit
| Party | Candidate | Votes | % | ±% | |
|---|---|---|---|---|---|
| Labour | Jo Tyson | 600 | 62.6 | +2.9 | |
| Conservative | Niyall Phillips | 359 | 37.4 | +17.1 | |
| Majority | 241 | 25.1 | |||
| Turnout | 959 | ||||
| Labour hold | Swing | ||||
| Party | Candidate | Votes | % | ±% | |
|---|---|---|---|---|---|
| Conservative | Jay Zaccarini | 881 | 61.0 | +15.3 | |
| Labour | Paul Griffiths | 564 | 39.0 | +5.5 | |
| Majority | 317 | 21.9 | |||
| Turnout | 1,445 | ||||
| Conservative hold | Swing | ||||
References edit
- ^ a b "Move to Whole Council Elections for Barrow Borough Council". Barrow Borough Council. Archived from the original on 27 September 2011. Retrieved 23 June 2011.
- ^ "England council elections". BBC News Online. Archived from the original on 19 July 2011. Retrieved 22 June 2011.
- ^ "Council minutes". Barrow-in-Furness Borough Council. Retrieved 14 June 2022.
- ^ The Borough of Barrow-in-Furness (Electoral Arrangements) Order 1976
- ^ "Barrow-in-Furness". BBC News Online. Archived from the original on 12 November 2012. Retrieved 10 May 2010.
- ^ legislation.gov.uk - The Borough of Barrow-in-Furness (Electoral Changes) Order 1998 Archived 1 April 2018 at the Wayback Machine. Retrieved on 4 October 2015.
- ^ "Barrow-In-Furness". BBC News Online. 19 April 2008. Archived from the original on 5 May 2008. Retrieved 10 May 2010.
- ^ legislation.gov.uk - The Borough of Barrow-in-Furness (Electoral Changes) Order 2008 Archived 1 April 2018 at the Wayback Machine. Retrieved on 3 November 2015.
- ^ "Tories hold on in Dalton North". News and Star. 19 January 2007. Archived from the original on 7 March 2012. Retrieved 10 May 2010.
- ^ "Tories jubilant after by-election". News and Star. 5 September 2008. Archived from the original on 7 March 2012. Retrieved 10 May 2010.
- ^ "Local Elections Archive Project — Risedale Ward". www.andrewteale.me.uk. Retrieved 27 September 2022.
- ^ "Results revealed in Cumbria elections". The Mail. Barrow-in-Furness. 5 May 2016. Archived from the original on 22 August 2016. Retrieved 6 August 2016.
- ^ Addison, Mike (12 April 2016). "Candidate unveiled by Barrow and Furness Labour Party to fight Dalton South by-election". The Westmorland Gazette. Archived from the original on 19 August 2016. Retrieved 6 August 2016.
- ^ "Local Elections Archive Project — Parkside Ward". www.andrewteale.me.uk. Retrieved 27 September 2022.
- ^ "Local Elections Archive Project — Hindpool Ward". www.andrewteale.me.uk. Retrieved 27 September 2022.
- ^ "Local Elections Archive Project — Roosecote Ward". www.andrewteale.me.uk. Retrieved 27 September 2022.
- By-election results Archived 29 March 2010 at the Wayback Machine
External links edit
- Barrow-in-Furness Council