


Summary
Biogeography-based optimization (BBO) is an evolutionary algorithm (EA) that optimizes a function by stochastically and iteratively improving candidate solutions with regard to a given measure of quality, or fitness function. BBO belongs to the class of metaheuristics since it includes many variations, and since it does not make any assumptions about the problem and can therefore be applied to a wide class of problems.
BBO is typically used to optimize multidimensional real-valued functions, but it does not use the gradient of the function, which means that it does not require the function to be differentiable as required by classic optimization methods such as gradient descent and quasi-newton methods. BBO can therefore be used on discontinuous functions.
BBO optimizes a problem by maintaining a population of candidate solutions, and creating new candidate solutions by combining existing ones according to a simple formula. In this way the objective function is treated as a black box that merely provides a measure of quality given a candidate solution, and the function's gradient is not needed.
Like many EAs, BBO was motivated by a natural process; in particular, BBO was motivated by biogeography, which is the study of the distribution of biological species through time and space.[1] BBO was originally introduced by Dan Simon in 2008.[2]
Underlying principles edit
Mathematical models of biogeography describe speciation (the evolution of new species), the migration of species (animals, fish, birds, or insects) between islands, and the extinction of species.[3] Islands that are friendly to life are said to have a high habitat suitability index (HSI).[4] Features that correlate with HSI include rainfall, vegetative diversity, topographic diversity, land area, temperature, and others. The features that determine are called suitability index variables (SIVs). In terms of habitability, SIVs are the independent variables and HSI is the dependent variable.
Islands with a high HSI can support many species, and islands with a low HSI can support only a few species. Islands with a high HSI have many species that emigrate to nearby habitats because of the large populations and the large numbers of species that they host. Note that emigration from an island with a high HSI does not occur because species want to leave their home; after all, their home island is an attractive place to live. Emigration occurs because of the accumulation of random effects on a large number of species with large populations. Emigration occurs as animals ride flotsam, swim, fly, or ride the wind to neighboring islands. When a species emigrates from an island, it does not mean that the species completely disappears from its original island; only a few representatives emigrate, so an emigrating species remains present on its original island while at the same time migrating to a neighboring island. However, in BBO it is assumed that emigration from an island results in extinction from that island. This assumption is necessary in BBO because species represent the independent variables of a function, and each island represents a candidate solution to a function optimization problem.
Islands with a high HSI not only have a high emigration rate, but they also have a low immigration rate because they already support many species. Species that migrate to such islands will tend to die in spite of the island's high HSI, because there is too much competition for resources from other species.
Islands with a low HSI have a high immigration rate because of their low populations. Again, this is not because species want to immigrate to such islands; after all, these islands are undesirable places to live. The reason that immigration occurs to these islands is because there is a lot of room for additional species. Whether or not the immigrating species can survive in its new home, and for how long, is another question. However, species diversity is correlated with HSI, so when more species arrive at a low HSI island, the island's HSI will tend to increase.[4]
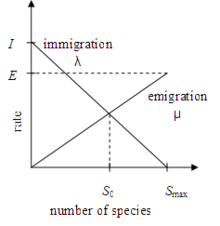
The figure on the right illustrates an island migration model.[3] The immigration rate and the emigration rate are functions of the number of species on the island. The maximum possible immigration rate occurs when there are zero species on the island. As the number of species increases, the island becomes more crowded, fewer species are able to survive immigration, and the immigration rate decreases. The largest possible number of species that the habitat can support is , at which point the immigration rate is zero. If there are no species on the island, then the emigration rate is zero. As the number of species on the island increases, it becomes more crowded, more species representatives are able to leave the island, and the emigration rate increases. When the island contains the largest number of possible species , the emigration rate reaches its maximum possible value .


In BBO, is the probability that a given independent variable in the -th candidate solution will be replaced; that is, is the immigration probability of . If an independent variable is to be replaced, then the emigrating candidate solution is chosen with a probability that is proportional to the emigration probability . This is usually performed using roulette wheel selection.


for , where is the number of candidate solutions in the population.


Algorithm edit
Like most other EAs, BBO includes mutation. A basic BBO algorithm with a population size of for optimizing an -dimensional function can be described as follows.

Initialize a population of candidate solutions While not(termination criterion) For each , set emigration probability fitness of , do with For each , set immigration probability do For each individual do For each independent variable index do Use to probabilistically decide whether to immigrate to If immigrating then Use to probabilistically select the emigrating individual End if Next independent variable index: Probabilistically mutate Next individual: Next generation


![{\displaystyle \mu _{k}\in [0,1]}](https://wikimedia.org/api/rest_v1/media/math/render/svg/6d02276410f1d3161d652d200e1d831baf760105)


![{\displaystyle s\in [1,n]}](https://wikimedia.org/api/rest_v1/media/math/render/svg/204fce467241a7677c583a9510c1bd47d07158ac)


Discussion of the BBO algorithm edit
- The population size is a tuning parameter. If is too small or too large, then the optimization performance of BBO will suffer. Typical implementations of BBO use a value of somewhere between 20 and 200.
- The initial population of candidate solutions is usually generated randomly. However, it could be generated in a problem-dependent way based on some reasonable guesses or previously-known good solutions to the optimization problem.
- The termination criterion is problem-dependent, like in any other EA. In most applications the termination criterion is a generation count limit or a function evaluation limit (that is, how often the objective function is evaluated).
- is a temporary population so that all emigrating variables can originate from the population that is in place at the beginning of the generation, which is .


Algorithmic variations edit
Many variations have been proposed to the basic BBO algorithm, among which are the following.
- Elitism is implemented in most EAs to make sure that the best candidate solution is not lost from one generation to the next. This can be implemented in a variety of ways, but one common way is to save the best candidate solutions at the beginning of each generation in a set ; then replace the worst candidate solutions with at the end of the generation, after migration and mutation have completed. The size of is a tuning parameter, but typically includes the best two individuals. Elitism was originally proposed for genetic algorithms by DeJong.[5] Elitism can make a significant difference in the performance of BBO, and is highly recommended.
- Duplicate replacement is often implemented in BBO. This is a procedure at the end of each generation that replaces duplicate individuals in the population. Scanning for duplicates can be computationally intensive because it is an operation, so it is often performed only every few generations, rather than every generation.
- Blending can be implemented in BBO. With blending, instead of replacing in an immigrating candidate solution with from the emigrating candidate solution, is set equal to a linear combination of its original value and :


- where , and corresponds to standard migration as shown in the algorithm above. Blended BBO is based on blended crossover in genetic algorithms,[6] and has been shown to outperform standard BBO.[7]

![{\displaystyle \alpha \in [0,1]}](https://wikimedia.org/api/rest_v1/media/math/render/svg/daf3c62599ea71319c85f715c9e590d2bab2d036)

- The BBO algorithm presented above is called partial immigration-based BBO because the immigrating candidate solution is selected before the emigrating candidate solution is selected, and migration for each independent variable in the immigrating candidate solution is performed independently of all other independent variables. Other approaches for selecting the immigrating and emigrating candidate solutions have also been proposed.[8][9]
- The migration curves in the above figure are linear, but nonlinear migration curves often give better performance.[10]
Hybridization edit
- BBO has been hybridized with several other EAs, including particle swarm optimization,[9][11] differential evolution,[12] evolution strategy,[13] opposition-based computing,[14] case-based reasoning,[15] artificial bee colony algorithm,[citation needed] bacterial foraging optimization,[16] harmony search,[17] and the simplex algorithm.[18]
- BBO can be combined with local search to create a memetic algorithm that performs much better than BBO alone.[19]
Software edit
MATLAB edit
- The following MATLAB code gives a BBO implementation for minimizing the 20-dimensional Rosenbrock function. Note that the following code is very basic, although it does include elitism. A serious BBO implementation should include some of the variations discussed above, such as duplicate replacement, blending, nonlinear migration, and local optimization.
function BBO
% Biogeography-based optimization (BBO) to minimize a continuous function
% This program was tested with MATLAB R2012b

GenerationLimit = 50; % generation count limit
PopulationSize = 50; % population size
ProblemDimension = 20; % number of variables in each solution (i.e., problem dimension)
MutationProbability = 0.04; % mutation probability per solution per independent variable
NumberOfElites = 2; % how many of the best solutions to keep from one generation to the next
MinDomain = -2.048; % lower bound of each element of the function domain
MaxDomain = +2.048; % upper bound of each element of the function domain

% Initialize the population
rng(round(sum(100*clock))); % initialize the random number generator
x = zeros(PopulationSize, ProblemDimension); % allocate memory for the population
for index = 1 : PopulationSize % randomly initialize the population
    x(index, :) = MinDomain + (MaxDomain - MinDomain) * rand(1, ProblemDimension);
end
Cost = RosenbrockCost(x); % compute the cost of each individual
[x, Cost] = PopulationSort(x, Cost); % sort the population from best to worst
MinimumCost = zeros(GenerationLimit, 1); % allocate memory
MinimumCost(1) = Cost(1); % save the best cost at each generation in the MinimumCost array
disp(['Generation 0 min cost = ', num2str(MinimumCost(1))]);
z = zeros(PopulationSize, ProblemDimension); % allocate memory for the temporary population

% Compute migration rates, assuming the population is sorted from most fit to least fit
mu = (PopulationSize + 1 - (1:PopulationSize)) / (PopulationSize + 1); % emigration rate
lambda = 1 - mu; % immigration rate

for Generation = 1 : GenerationLimit
    % Save the best solutions and costs in the elite arrays
    EliteSolutions = x(1 : NumberOfElites, :);
    EliteCosts = Cost(1 : NumberOfElites);

    % Use migration rates to decide how much information to share between solutions
    for k = 1 : PopulationSize
        % Probabilistic migration to the k-th solution
        for j = 1 : ProblemDimension

            if rand < lambda(k) % Should we immigrate?
                % Yes - Pick a solution from which to emigrate (roulette wheel selection)
                RandomNum = rand * sum(mu);
                Select = mu(1);
                SelectIndex = 1;
                while (RandomNum > Select) && (SelectIndex < PopulationSize)
                    SelectIndex = SelectIndex + 1;
                    Select = Select + mu(SelectIndex);
                end
                z(k, j) = x(SelectIndex, j); % this is the migration step
            else
                z(k, j) = x(k, j); % no migration for this independent variable
            end

        end
    end

    % Mutation
    for k = 1 : PopulationSize
        for ParameterIndex = 1 : ProblemDimension
            if rand < MutationProbability
                z(k, ParameterIndex) = MinDomain + (MaxDomain - MinDomain) * rand;
            end
        end
    end

    x = z; % replace the solutions with their new migrated and mutated versions
    Cost = RosenbrockCost(x); % calculate cost
    [x, Cost] = PopulationSort(x, Cost); % sort the population and costs from best to worst

    for k = 1 : NumberOfElites % replace the worst individuals with the previous generation's elites
        x(PopulationSize-k+1, :) = EliteSolutions(k, :);
        Cost(PopulationSize-k+1) = EliteCosts(k);
    end

    [x, Cost] = PopulationSort(x, Cost); % sort the population and costs from best to worst
    MinimumCost(Generation+1) = Cost(1);
    disp(['Generation ', num2str(Generation), ' min cost = ', num2str(MinimumCost(Generation+1))])
end

% Wrap it up by displaying the best solution and by plotting the results
disp(['Best solution found = ', num2str(x(1, :))])
close all
plot(0:GenerationLimit, MinimumCost);
xlabel('Generation')
ylabel('Minimum Cost')
return

%%%%%%%%%%%%%%%%%%%%%%%%%%%%%%%%%%%%%%%%%%%%%%%%%%%%
function [x, Cost] = PopulationSort(x, Cost)
% Sort the population and costs from best to worst
[Cost, indices] = sort(Cost, 'ascend');
x = x(indices, :);
return

%%%%%%%%%%%%%%%%%%%%%%%%%%%%%%%%%%%%%%%%%%%%%%%%%%%%
function [Cost] = RosenbrockCost(x)
% Compute the Rosenbrock function value of each element in x
NumberOfDimensions = size(x, 2);
Cost = zeros(size(x, 1), 1); % allocate memory for the Cost array
for PopulationIndex = 1 : length(x)
    Cost(PopulationIndex) = 0;
    for i = 1 : NumberOfDimensions-1
        Temp1 = x(PopulationIndex, i);
        Temp2 = x(PopulationIndex, i+1);
        Cost(PopulationIndex) = Cost(PopulationIndex) + 100 * (Temp2 - Temp1^2)^2 + (Temp1 - 1)^2;
    end
end
return
R edit
Extensions edit
BBO has been extended to noisy functions (that is, functions whose fitness evaluation is corrupted by noise);[21] constrained functions;[22] combinatorial functions;[23] and multi-objective functions.[24][25] Moreover, a micro biogeography-inspired multi-objective optimization algorithm (μBiMO) was implemented: it is suitable for solving multi-objective optimisations in the field of industrial design because it is based on a small number of islands (hence the name μBiMO), i.e. few objective function calls are required.[26]
Mathematical analyses edit
BBO has been mathematically analyzed using Markov models[27] and dynamic system models.[28]
Applications edit
Scholars have applied BBO into various academic and industrial applications. They found BBO performed better than state-of-the-art global optimization methods.
For example, Wang et al. proved BBO performed equal performance with FSCABC but with simpler codes.[29]
Yang et al. showed BBO was superior to GA, PSO, and ABC.[30]
References edit
- ^ Quammen, D. (1997). The Song of the Dodo: Island Biogeography in an Age of Extinction. Scribner.
- ^ Simon, D. (2008). "Biogeography-based optimization" (PDF). IEEE Transactions on Evolutionary Computation. 12 (6): 702–713. doi:10.1109/tevc.2008.919004. S2CID 8319014.
- ^ a b MacArthur, R.; Wilson, E. (1967). The Theory of Island Biogeography. Princeton University Press.
- ^ a b Wesche, T.; Goertler, G.; Hubert, W. (1987). "Modified habitat suitability index model for brown trout in southeastern Wyoming". North American Journal of Fisheries Management. 7 (2): 232–237. doi:10.1577/1548-8659(1987)7<232:mhsimf>2.0.co;2.
- ^ De Jong, K. (1975). An Analysis of the Behaviour of a Class of Genetic Adaptive Systems (Ph.D.). University of Michigan.
- ^ Muhlenbein, H.; Schlierkamp-Voosen, D. (1993). "Predictive models for the breeder genetic algorithm: I. Continuous parameter optimization". Evolutionary Computation. 1 (1): 25–49. doi:10.1162/evco.1993.1.1.25. S2CID 16085506.
- ^ Ma, H.; Simon, D. (2011). "Blended biogeography-based optimization for constrained optimization" (PDF). Engineering Applications of Artificial Intelligence. 24 (3): 517–525. doi:10.1016/j.engappai.2010.08.005.
- ^ Simon, D. (2013). Evolutionary Optimization Algorithms. Wiley.
- ^ a b Kundra, H.; Sood, M. (2010). "Cross-Country Path Finding using Hybrid approach of PSO and BBO" (PDF). International Journal of Computer Applications. 7 (6): 15–19. doi:10.5120/1167-1370.
- ^ Ma, H. (2010). "An analysis of the equilibrium of migration models for biogeography-based optimization" (PDF). Information Sciences. 180 (18): 3444–3464. doi:10.1016/j.ins.2010.05.035.
- ^ Zhang, Y. (2015). "Pathological Brain Detection in Magnetic Resonance Imaging Scanning by Wavelet Entropy and Hybridization of Biogeography-based Optimization and Particle Swarm Optimization" (PDF). Progress in Electromagnetics Research. 152: 41–58. doi:10.2528/pier15040602.
- ^ Bhattacharya, A.; Chattopadhyay, P. (2010). "Hybrid differential evolution with biogeography-based optimization for solution of economic load dispatch". IEEE Transactions on Power Systems. 25 (4): 1955–1964. Bibcode:2010ITPSy..25.1955B. doi:10.1109/tpwrs.2010.2043270. S2CID 30052218.
- ^ Du, D.; Simon, D.; Ergezer, M. (2009). "Biogeography-based optimization combined with evolutionary strategy and immigration refusal" (PDF). IEEE Conference on Systems, Man, and Cybernetics. San Antonio, Texas. pp. 1023–1028.
- ^ Ergezer, M.; Simon, D.; Du, D. (2009). "Oppositional biogeography-based optimization" (PDF). IEEE Conference on Systems, Man, and Cybernetics. San Antonio, Texas. pp. 1035–1040.
- ^ Kundra, H.; Kaur, A.; Panchal, V. (2009). "An integrated approach to biogeography based optimization with case-based reasoning for exploring groundwater possibility" (PDF). The Delving: Journal of Technology and Engineering Sciences. 1 (1): 32–38.
- ^ Lohokare, M.; Pattnaik, S.; Devi, S.; Panigrahi, B.; Das, S.; Bakwad, K. (2009). "Intelligent biogeography-based optimization for discrete variables". World Congress on Nature and Biologically Inspired Computing. Coimbatore, India. pp. 1088–1093. doi:10.1109/NABIC.2009.5393808.
- ^ Wang, G.; Guo, L.; Duan, H.; Wang, H.; Liu, L.; Shao, M. (2013). "Hybridizing harmony search with biogeography based optimization for global numerical optimization". Journal of Computational and Theoretical Nanoscience. 10 (10): 2312–2322. Bibcode:2013JCTN...10.2312W. doi:10.1166/jctn.2013.3207.
- ^ Wang, L.; Xu, Y. (2011). "An effective hybrid biogeography-based optimization algorithm for parameter estimation of chaotic systems". Expert Systems with Applications. 38 (12): 15103–15109. doi:10.1016/j.eswa.2011.05.011.
- ^ Simon, D.; Omran, M.; Clerc, M. "Linearized Biogeography-Based Optimization with Re-initialization and Local Search". Retrieved 6 September 2013.
- ^ "Bbo: Biogeography-Based Optimization". 2014-09-18.
- ^ Ma, H.; Fei, M.; Simon, D.; Yu, M. "Biogeography-Based Optimization for Noisy Fitness Functions". Retrieved 7 September 2013.
- ^ Roy, P.; Ghoshal, S.; Thakur, S. (2010). "Biogeography based optimization for multi-constraint optimal power flow with emission and non-smooth cost function". Expert Systems with Applications. 37 (12): 8221–8228. doi:10.1016/j.eswa.2010.05.064.
- ^ Song, Y.; Liu, M.; Wang, Z. (2010). "Biogeography-based optimization for the traveling salesman problems". International Joint Conference on Computational Science and Optimization. Huangshan, Anhui, China. pp. 295–299.
- ^ Roy, P.; Ghoshal, S.; Thakur, S. (2010). "Multi-objective optimal power flow using biogeography-based optimization". Electric Power Components and Systems. 38 (12): 1406–1426. doi:10.1080/15325001003735176. S2CID 109069222.
- ^ Di Barba, P.; Dughiero, F.; Mognaschi, M.E.; Savini, A.; Wiak, S. (2016). "Biogeography-Inspired Multiobjective Optimization and MEMS Design". IEEE Transactions on Magnetics. 52 (3): 1–4. Bibcode:2016ITM....5288982D. doi:10.1109/TMAG.2015.2488982. S2CID 17355264.
- ^ Mognaschi, M.E. (2017). "Micro biogeography-inspired multi-objective optimisation for industrial electromagnetic design". Electronics Letters. 53 (22): 1458–1460. doi:10.1049/el.2017.3072.
- ^ Simon, D.; Ergezer, M.; Du, D.; Rarick, R. (2011). "Markov models for biogeography-based optimization" (PDF). IEEE Transactions on Systems, Man, and Cybernetics - Part B: Cybernetics. 41 (1): 299–306. doi:10.1109/tsmcb.2010.2051149. PMID 20595090. S2CID 11852624.
- ^ Simon, D. (2011). "A dynamic system model of biogeography-based optimization" (PDF). Applied Soft Computing. 1 (8): 5652–5661. doi:10.1016/j.asoc.2011.03.028.
- ^ Wang, S. (2015). "Fruit Classification by Wavelet-Entropy and Feedforward Neural Network trained by Fitness-scaled Chaotic ABC and Biogeography-based Optimization". Entropy. 17 (8): 5711–5728. Bibcode:2015Entrp..17.5711W. doi:10.3390/e17085711.
- ^ Yang, G.; Yang, J. (2015). "Automated classification of brain images using wavelet-energy and biogeography-based optimization". Multimedia Tools and Applications. 75 (23): 15601–15617. doi:10.1007/s11042-015-2649-7. S2CID 254825916.
External links edit
- BBO Home Page