
KNOWPIA
WELCOME TO KNOWPIA

Blackburn with Darwen Borough Council elections 
Summary
Blackburn with Darwen Borough Council elections are held three years out of every four, with a third of the council being elected each time. Blackburn with Darwen Borough Council is the local authority for the unitary authority of Blackburn with Darwen in Lancashire, England. Since the last boundary changes in 2018, 51 councillors have been elected from 17 wards.[1]
Council elections edit
- 1973 Blackburn Borough Council election
- 1976 Blackburn Borough Council election
- 1979 Blackburn Borough Council election (New ward boundaries)[2]
- 1980 Blackburn Borough Council election
- 1982 Blackburn Borough Council election
- 1983 Blackburn Borough Council election
- 1984 Blackburn Borough Council election
- 1986 Blackburn Borough Council election
- 1987 Blackburn Borough Council election
- 1988 Blackburn Borough Council election
- 1990 Blackburn Borough Council election
- 1991 Blackburn Borough Council election
- 1992 Blackburn Borough Council election
- 1994 Blackburn Borough Council election (Borough boundary changes took place but the number of seats remained the same)[3]
- 1995 Blackburn Borough Council election
- 1996 Blackburn Borough Council election
- 1997 Blackburn with Darwen Borough Council election (New ward boundaries)[4]
- 1999 Blackburn with Darwen Borough Council election
- 2000 Blackburn with Darwen Borough Council election
- 2002 Blackburn with Darwen Borough Council election
- 2003 Blackburn with Darwen Borough Council election
- 2004 Blackburn with Darwen Borough Council election (New ward boundaries increased the number of seats by 2)[5][6][7]
- 2006 Blackburn with Darwen Borough Council election
- 2007 Blackburn with Darwen Borough Council election
- 2008 Blackburn with Darwen Borough Council election
- 2010 Blackburn with Darwen Borough Council election
- 2011 Blackburn with Darwen Borough Council election
- 2012 Blackburn with Darwen Borough Council election
- 2014 Blackburn with Darwen Borough Council election
- 2015 Blackburn with Darwen Borough Council election
- 2016 Blackburn with Darwen Borough Council election
- 2018 Blackburn with Darwen Borough Council election (New ward boundaries)[1]
- 2019 Blackburn with Darwen Borough Council election
- 2021 Blackburn with Darwen Borough Council election
- 2022 Blackburn with Darwen Borough Council election
- 2023 Blackburn with Darwen Borough Council election
Results maps edit
-
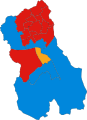
 2018 results map
 -
 2019 results map
 -
 2021 results map
 -
 2022 results map
 -
 2023 results map


By-election results edit
2002-2006 edit
| Party | Candidate | Votes | % | ±% | |
|---|---|---|---|---|---|
| BNP | Robin Evans | 578 | 32.1 | +32.1 | |
| Labour | Gail Barton | 562 | 31.2 | -16.3 | |
| Liberal Democrats | David D'Arcy | 505 | 28.1 | -24.4 | |
| Conservative | Karl Turner | 154 | 8.6 | +8.6 | |
| Majority | 16 | 0.9 | |||
| Turnout | 1,799 | 39.4 | |||
| BNP gain from Liberal Democrats | Swing | ||||
| Party | Candidate | Votes | % | ±% | |
|---|---|---|---|---|---|
| Labour | Moira Barrett | 492 | 20.4% | ||
| Labour | Francis Davis | 443 | 18.3% | ||
| Liberal Democrats | John East | 300 | 12.4% | ||
| Liberal Democrats | Anthony Melia | 277 | 11.4% | ||
| Conservative | Julie Slater | 212 | 8.7% | ||
| Conservative | Konrad Tapp | 201 | 8.3% | ||
| BNP | Nicholas Holt | 133 | 5.5% | ||
| Independent | Sam Stone | 114 | 4.7% | ||
| Independent | Trevor Maxfield | 109 | 4.5% | ||
| BNP | Anthony Dailly | 106 | 4.3% | ||
| British National Socialist Party | Robin Evans | 14 | 0.5% | ||
| British National Socialist Party | Natalia Finn | 10 | 0.4% | ||
| Turnout | 2,411 | 37.9 | |||
| Labour hold | Swing | ||||
| Labour gain from Conservative | Swing | ||||
2006-2010 edit
| Party | Candidate | Votes | % | ±% | |
|---|---|---|---|---|---|
| Independent | Julie Slater | 209 | 28.1 | +28.1 | |
| Conservative | John Raseta | 201 | 27.0 | -66.7 | |
| England First | Stephen Hart | 99 | 13.3 | +13.3 | |
| Liberal Democrats | Brian Dunning | 91 | 12.2 | +12.2 | |
| Labour | Stella McLennan | 75 | 10.1 | +3.8 | |
| BNP | Nicholas Holt | 70 | 9.4 | +9.4 | |
| Majority | 8 | 1.1 | |||
| Turnout | 745 | 46.2 | |||
| Independent gain from Conservative | Swing | ||||
| Party | Candidate | Votes | % | ±% | |
|---|---|---|---|---|---|
| Labour | Mustafa Desai | 638 | 54.2 | +3.0 | |
| Liberal Democrats | Imtiaz Patel | 366 | 31.1 | -17.8 | |
| Conservative | Asghar Ali | 174 | 14.8 | +14.8 | |
| Majority | 272 | 23.1 | |||
| Turnout | 1,178 | 28.4 | |||
| Labour gain from Liberal Democrats | Swing | ||||
2010-2014 edit
| Party | Candidate | Votes | % | ±% | |
|---|---|---|---|---|---|
| Conservative | Julie Daley | 1,097 | 63.8 | +3.4 | |
| Labour | Ashley Whalley | 572 | 33.3 | +0.1 | |
| Liberal Democrats | Salim Lorgat | 51 | 3.0 | -3.4 | |
| Majority | 525 | 30.5 | |||
| Turnout | 1,720 | ||||
| Conservative hold | Swing | ||||
2014-2018 edit
| Party | Candidate | Votes | % | ±% | |
|---|---|---|---|---|---|
| Labour | Carl Nuttall | 505 | 58.8 | +9.0 | |
| UKIP | Michael Longbottom | 179 | 20.8 | -7.6 | |
| Conservative | Helen Tolley | 106 | 12.3 | -4.9 | |
| Liberal Democrats | Alan Dean | 69 | 8.0 | +3.4 | |
| Majority | 326 | 38.0 | |||
| Turnout | 859 | ||||
| Labour hold | Swing | ||||
| Party | Candidate | Votes | % | ±% | |
|---|---|---|---|---|---|
| Labour | Amy Johnson | 435 | 58.2 | -15.7 | |
| UKIP | Ian Grimshaw | 187 | 25.0 | +25.0 | |
| Conservative | Maureen McGarvey | 125 | 16.7 | -9.4 | |
| Majority | 248 | 33.2 | |||
| Turnout | 747 | ||||
| Labour hold | Swing | ||||
| Party | Candidate | Votes | % | ±% | |
|---|---|---|---|---|---|
| Labour | Adam Holden | 446 | 59.6 | -14.3 | |
| UKIP | Ian Grimshaw | 169 | 22.6 | +22.6 | |
| Conservative | Maureen McGarvey | 133 | 17.8 | -8.3 | |
| Majority | 277 | 37.0 | |||
| Turnout | 748 | ||||
| Labour hold | Swing | ||||
| Party | Candidate | Votes | % | ±% | |
|---|---|---|---|---|---|
| Conservative | Lynn Perkins | 748 | 41.5 | +7.7 | |
| Liberal Democrats | Paul Browne | 580 | 32.2 | +15.3 | |
| Labour | Kieran Richards | 474 | 26.3 | -7.4 | |
| Majority | 168 | 9.3 | |||
| Turnout | 1,802 | ||||
| Conservative gain from Labour | Swing | ||||
| Party | Candidate | Votes | % | ±% | |
|---|---|---|---|---|---|
| Labour | Matt Gibson | 1,579 | 57.6 | -16.3 | |
| Conservative | Ann Tolley | 818 | 29.9 | +3.8 | |
| UKIP | Ian Grimshaw | 343 | 12.5 | +12.5 | |
| Majority | 761 | 27.8 | |||
| Turnout | 2,740 | ||||
| Labour hold | Swing | ||||
2022-2026 edit
| Party | Candidate | Votes | % | ±% | |
|---|---|---|---|---|---|
| Labour | Matt Jackson | 569 | 44.9 | +6.6 | |
| Conservative | Janine Crook | 562 | 44.3 | -1.8 | |
| Liberal Democrats | Mark Peter Davies | 137 | 10.8 | -4.9 | |
| Majority | 7 | 0.6 | |||
| Turnout | 1,271 | 19.9 | |||
| Labour gain from Conservative | Swing | ||||
References edit
- ^ a b "The Blackburn with Darwen (Electoral Changes) Order 2017", legislation.gov.uk, The National Archives, SI 2017/1270, retrieved 22 August 2022
- ^ The Borough of Blackburn (Electoral Arrangements) Order 1976
- ^ legislation.gov.uk - The Greater Manchester and Lancashire (County and District Boundaries) Order 1993. Retrieved on 5 November 2015.
- ^ legislation.gov.uk - The Borough of Blackburn (Parishes and Electoral Changes) Order 1997. Retrieved on 4 October 2015.
- ^ "Blackburn With Darwen council". BBC News Online. Retrieved 5 February 2010.
- ^ legislation.gov.uk - The Borough of Blackburn with Darwen (Electoral Changes) Order 2002. Retrieved on 4 October 2015.
- ^ "Councillors and wards". Blackburn with Darwen Borough Council. Archived from the original on 6 June 2011. Retrieved 5 February 2010.
- ^ Herbert, Ian (23 November 2002). "Straw calls for race tolerance as BNP wins council seat". The Independent. London. Retrieved 5 February 2010.[dead link]
- ^ "Borough council election results – June 10, 2004". Blackburn with Darwen Borough Council. Archived from the original on 7 June 2011. Retrieved 5 February 2010.
- ^ "Election win keeps up family tradition". Blackburn Citizen. 30 September 2006. Retrieved 5 February 2010.[permanent dead link]
- ^ "Labour wins Blackburn with Darwen council seat". Blackburn Citizen. 5 February 2010. Retrieved 5 February 2010.
- ^ "Result of the February 2010 by-election in Queen's Park ward". Blackburn with Darwen Borough Council. Archived from the original on 6 June 2011. Retrieved 5 February 2010.
- ^ "Local Elections Archive Project — Beardwood with Lammack Ward". www.andrewteale.me.uk. Retrieved 22 April 2022.
- ^ "Local Elections Archive Project — Mill Hill Ward". www.andrewteale.me.uk. Retrieved 22 April 2022.
- ^ a b c "Local Elections Archive Project — Higher Croft Ward". www.andrewteale.me.uk. Retrieved 22 April 2022.
- ^ "Local Elections Archive Project — Marsh House Ward". www.andrewteale.me.uk. Retrieved 22 April 2022.
- ^ "Darwen South: Election of a Borough Councillor: 17.11.22". www.blackburn.gov.uk. Retrieved 18 November 2022.
- By-election results Archived 29 March 2010 at the Wayback Machine
External links edit
- Blackburn with Darwen Council