
KNOWPIA
WELCOME TO KNOWPIA

Blair Mountain (Colorado) 
Summary
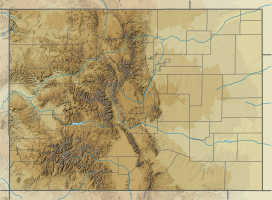
Blair Mountain is the highest summit of the White River Plateau in the Rocky Mountains of North America. The prominent 11,465-foot (3,495 m) peak is located in White River National Forest, 17.5 miles (28.2 km) north by west (bearing 344°) of the City of Glenwood Springs in Garfield County, Colorado, United States.[2][3][1]
| Blair Mountain | |
|---|---|
 Blair Mountain | |
| Highest point | |
| Elevation | 11,465 ft (3,495 m)[2][3] |
| Prominence | 1,736 ft (529 m)[3] |
| Isolation | 11.50 mi (18.51 km)[3] |
| Listing | Colorado prominent summits Colorado range high points |
| Coordinates | 39°47′40″N 107°25′03″W / 39.7944257°N 107.417556°W[1] |
| Geography | |
| Location | Garfield County, Colorado, U.S.[1] |
| Parent range | Highest summit of the White River Plateau[3] |
| Topo map | USGS 7.5' topographic map Blair Mountain, Colorado[1] |
Mountain edit
Blair Mountain in the White River Forest in Colorado was named for James Allison Blair who had been a Supervisor at White River Forest and died at the age of 52 in 1928. Held in high regard by his superiors for his service, the highest mountain in the area (formerly called 'Old Baldy') was renamed Blair Mountain in James Blair's honor. [4]
Climate edit
| Climate data for Blair Mountain 39.7924 N, 107.4197 W, Elevation: 11,260 ft (3,430 m) (1991–2020 normals) | |||||||||||||
|---|---|---|---|---|---|---|---|---|---|---|---|---|---|
| Month | Jan | Feb | Mar | Apr | May | Jun | Jul | Aug | Sep | Oct | Nov | Dec | Year |
| Mean daily maximum °F (°C) | 26.7 (−2.9) |
27.0 (−2.8) |
33.0 (0.6) |
38.2 (3.4) |
47.3 (8.5) |
58.3 (14.6) |
64.8 (18.2) |
62.9 (17.2) |
55.2 (12.9) |
43.0 (6.1) |
33.3 (0.7) |
26.2 (−3.2) |
43.0 (6.1) |
| Daily mean °F (°C) | 16.1 (−8.8) |
15.8 (−9.0) |
21.2 (−6.0) |
26.4 (−3.1) |
35.5 (1.9) |
45.9 (7.7) |
52.7 (11.5) |
51.1 (10.6) |
43.8 (6.6) |
32.5 (0.3) |
23.1 (−4.9) |
16.1 (−8.8) |
31.7 (−0.2) |
| Mean daily minimum °F (°C) | 5.5 (−14.7) |
4.6 (−15.2) |
9.4 (−12.6) |
14.6 (−9.7) |
23.7 (−4.6) |
33.5 (0.8) |
40.5 (4.7) |
39.3 (4.1) |
32.4 (0.2) |
22.0 (−5.6) |
12.9 (−10.6) |
6.0 (−14.4) |
20.4 (−6.5) |
| Average precipitation inches (mm) | 4.70 (119) |
4.48 (114) |
4.10 (104) |
4.47 (114) |
3.36 (85) |
1.54 (39) |
1.68 (43) |
1.99 (51) |
2.50 (64) |
3.16 (80) |
3.78 (96) |
4.51 (115) |
40.27 (1,024) |
| Source: PRISM Climate Group[5] | |||||||||||||
There is a weather station at Bison Lake, near the peak of Blair Mountain.
| Climate data for Bison Lake, Colorado (10880ft or 3316m), 1991–2020 normals | |||||||||||||
|---|---|---|---|---|---|---|---|---|---|---|---|---|---|
| Month | Jan | Feb | Mar | Apr | May | Jun | Jul | Aug | Sep | Oct | Nov | Dec | Year |
| Mean daily maximum °F (°C) | 24.0 (−4.4) |
26.0 (−3.3) |
33.6 (0.9) |
39.6 (4.2) |
48.5 (9.2) |
57.9 (14.4) |
64.1 (17.8) |
61.6 (16.4) |
53.9 (12.2) |
42.1 (5.6) |
31.0 (−0.6) |
23.4 (−4.8) |
42.1 (5.6) |
| Daily mean °F (°C) | 16.3 (−8.7) |
17.3 (−8.2) |
23.6 (−4.7) |
29.3 (−1.5) |
38.5 (3.6) |
47.8 (8.8) |
54.3 (12.4) |
52.3 (11.3) |
45.2 (7.3) |
34.1 (1.2) |
23.2 (−4.9) |
16.0 (−8.9) |
33.2 (0.6) |
| Mean daily minimum °F (°C) | 8.6 (−13.0) |
8.6 (−13.0) |
13.6 (−10.2) |
19.0 (−7.2) |
28.4 (−2.0) |
37.8 (3.2) |
44.5 (6.9) |
43.0 (6.1) |
36.4 (2.4) |
25.9 (−3.4) |
15.5 (−9.2) |
8.4 (−13.1) |
24.1 (−4.4) |
| Average precipitation inches (mm) | 4.82 (122) |
4.53 (115) |
4.16 (106) |
4.69 (119) |
3.34 (85) |
1.58 (40) |
1.78 (45) |
2.12 (54) |
2.70 (69) |
3.30 (84) |
3.89 (99) |
4.72 (120) |
41.63 (1,058) |
| Source 1: XMACIS2[6] | |||||||||||||
| Source 2: NOAA (Precipitation)[7] | |||||||||||||
Historical names edit
- Bald
- Bald Mountain
- Baldy
- Blair Mountain – 1928 [1]
See also edit
References edit
- ^ a b c d e "Blair Mountain". Geographic Names Information System. United States Geological Survey, United States Department of the Interior. Retrieved October 19, 2014.
- ^ a b The elevation of Blair Mountain includes an adjustment of +1.565 m (+5.13 ft) from NGVD 29 to NAVD 88.
- ^ a b c d e "Blair Mountain, Colorado". Peakbagger.com. Retrieved October 19, 2014.
- ^ Google Books online: The 1929 Blair Magazine
- ^ "PRISM Climate Group, Oregon State University". PRISM Climate Group, Oregon State University. Retrieved October 2, 2023.
To find the table data on the PRISM website, start by clicking Coordinates (under Location); copy Latitude and Longitude figures from top of table; click Zoom to location; click Precipitation, Minimum temp, Mean temp, Maximum temp; click 30-year normals, 1991-2020; click 800m; click Retrieve Time Series button.
- ^ "xmACIS2". National Oceanic and Atmospheric Administration. Retrieved September 24, 2023.
- ^ "Bison Lake, Colorado 1991-2020 Monthly Normals". Retrieved September 26, 2023.
External links edit
Blair Mountain (Colorado) at Wikipedia's sister projects
 Definitions from Wiktionary
 Media from Commons
 News from Wikinews
 Quotations from Wikiquote
 Texts from Wikisource
 Textbooks from Wikibooks
 Resources from Wikiversity