


Summary
A carpet plot is any of a few different specific types of plot. The more common plot referred to as a carpet plot is one that illustrates the interaction between two or more independent variables and one or more dependent variables in a two-dimensional plot. Besides the ability to incorporate more variables, another feature that distinguishes a carpet plot from an equivalent contour plot or 3D surface plot is that a carpet plot can be used to more accurately interpolate data points. A conventional carpet plot can capture the interaction of up to three independent variables and three dependent variables and still be easily read and interpolated.

Carpet plots have common applications within areas such as material science for showing elastic modulus in laminates,[1] and within aeronautics.[2][3]
Another plot sometimes referred to as a carpet plot is the temporal raster plot.
Variants edit
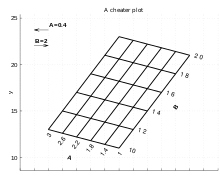
Three-variable carpet plot (cheater plot) edit
A carpet plot with two independent variables and one dependent variable is often called a cheater plot for the use of a phantom "cheater" axis instead of the horizontal axis. As a result of this missing axis, the values can be shifted horizontally such that the intersections line up vertically. This allows easy interpolation by having fixed horizontal intervals correspond to fixed intervals in both independent variables. The horizontal shift must sometimes be adjusted in order to eliminate or mitigate overlapping.[4] Depending on the data being depicted, eliminating overlapping is not always possible. The common solution is to split the plot into two carpets.
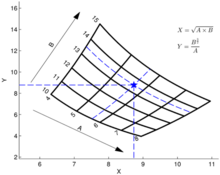
Four-variable carpet plot (true carpet plot) edit
Instead of using the horizontal axis to adjust the plot perspective and align carpet intersections vertically, the horizontal axis can be used to show the effects on an additional dependent variable.[5] In this case the perspective is fixed, and any overlapping cannot be adjusted. Because a true carpet plot represents two independent variables and two dependent variables simultaneously, there is no corresponding way to show the information on a conventional contour plot or 3D surface plot.
Carpet plot with isolines edit
To add an additional dependent variable, isolines that are a function of the two independent variables can be added within the carpet to create a contour plot in the carpet domain. Contours can be added to cheater plots as well as to true carpet plots.[6]
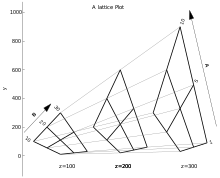
Lattice plot edit
The effects of an additional independent variable can be visualized by multiple carpets on the same plot corresponding to different values of the third independent variable. If the intersections are connected, a lattice appears. For an intermediate value, a whole carpet can be interpolated using the lattice lines.[2] This technique may result in too much overlapping of carpets in a true carpet plot but is always possible for a cheater plot because the separation of the additional carpets can be adjusted on the phantom horizontal axis.
References edit
- ^ "Laminate Carpet Plots". Archived from the original on 20 November 2008. Retrieved 6 January 2010.
- ^ a b "Use of Carpet Plots to represent functions of two variables". Retrieved 2 November 2013.
- ^ Raymer, D. P. (1992). Aircraft Design: A Conceptual Approach. Reston: American Institut of Aeronautics. p. 529.
- ^ "The Generation of Carpet Plots" (PDF). Retrieved 1 November 2013.
- ^ Schneider, Markus. How to Generate Carpet Plots: A Guide to Creating Visual Trade Studies.
- ^ "'Gasturb Tutorial 2 - Cycle Design Parametric Study'". Archived from the original on 6 November 2013. Retrieved 2 November 2013.
External links edit
- Matlab Carpet Plot Toolkit by Rob McDonald
- Matlab Carpet Plot Class by Matthias Oberhauser
- Carpet Plots in Python with Plotly
- Carpet Plots in R with Plotly
- Carpet Plots in Javascript with Plotly