
KNOWPIA
WELCOME TO KNOWPIA

Cecilville, California 
Summary
Cecilville (Karuk: íshirak[1]) is a small unincorporated community in Siskiyou County, California, United States. It is on the south fork of the Salmon River and was established when the area was settled by miners during the Gold Rush. The community was named for a prospector.[2] It was formerly in Klamath County before that county was dissolved and the part of that county, including Cecilville, was annexed by Siskiyou County.
Cecilville | |
|---|---|
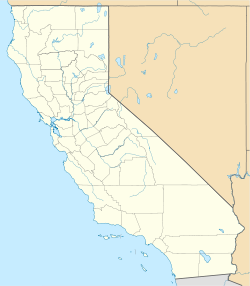 Cecilville Location within California  Cecilville Location within the United States | |
| Coordinates: 41°08′27″N 123°08′24″W / 41.14083°N 123.14000°W | |
| Country | United States |
| State | California |
| County | Siskiyou |
Climate edit
| Climate data for Cecilville, California, 1991–2020 normals, extremes 1985–2003 | |||||||||||||
|---|---|---|---|---|---|---|---|---|---|---|---|---|---|
| Month | Jan | Feb | Mar | Apr | May | Jun | Jul | Aug | Sep | Oct | Nov | Dec | Year |
| Record high °F (°C) | 66 (19) |
77 (25) |
81 (27) |
92 (33) |
99 (37) |
106 (41) |
111 (44) |
110 (43) |
106 (41) |
98 (37) |
78 (26) |
62 (17) |
111 (44) |
| Mean maximum °F (°C) | 55.9 (13.3) |
64.4 (18.0) |
74.5 (23.6) |
85.4 (29.7) |
91.7 (33.2) |
99.7 (37.6) |
105.1 (40.6) |
104.1 (40.1) |
99.1 (37.3) |
88.5 (31.4) |
66.6 (19.2) |
54.8 (12.7) |
107.0 (41.7) |
| Mean daily maximum °F (°C) | 44.6 (7.0) |
51.4 (10.8) |
58.6 (14.8) |
65.5 (18.6) |
75.4 (24.1) |
84.7 (29.3) |
95.9 (35.5) |
93.9 (34.4) |
89.3 (31.8) |
69.7 (20.9) |
53.7 (12.1) |
42.5 (5.8) |
68.8 (20.4) |
| Daily mean °F (°C) | 37.4 (3.0) |
41.2 (5.1) |
46.0 (7.8) |
50.7 (10.4) |
58.7 (14.8) |
65.5 (18.6) |
74.1 (23.4) |
72.1 (22.3) |
67.2 (19.6) |
53.5 (11.9) |
43.4 (6.3) |
36.5 (2.5) |
53.9 (12.1) |
| Mean daily minimum °F (°C) | 30.1 (−1.1) |
30.9 (−0.6) |
33.4 (0.8) |
36.0 (2.2) |
42.1 (5.6) |
46.3 (7.9) |
52.3 (11.3) |
50.4 (10.2) |
45.0 (7.2) |
37.3 (2.9) |
33.1 (0.6) |
30.5 (−0.8) |
39.0 (3.9) |
| Mean minimum °F (°C) | 21.7 (−5.7) |
21.6 (−5.8) |
25.3 (−3.7) |
27.7 (−2.4) |
30.8 (−0.7) |
36.3 (2.4) |
42.8 (6.0) |
42.2 (5.7) |
36.7 (2.6) |
28.6 (−1.9) |
23.8 (−4.6) |
18.7 (−7.4) |
15.2 (−9.3) |
| Record low °F (°C) | 13 (−11) |
6 (−14) |
22 (−6) |
23 (−5) |
28 (−2) |
30 (−1) |
38 (3) |
38 (3) |
33 (1) |
22 (−6) |
16 (−9) |
2 (−17) |
2 (−17) |
| Average precipitation inches (mm) | 5.80 (147) |
4.74 (120) |
4.91 (125) |
2.58 (66) |
1.91 (49) |
0.99 (25) |
0.49 (12) |
0.43 (11) |
0.52 (13) |
2.30 (58) |
5.56 (141) |
7.59 (193) |
37.82 (960) |
| Average snowfall inches (cm) | 1.7 (4.3) |
3.5 (8.9) |
0.9 (2.3) |
0.8 (2.0) |
0.0 (0.0) |
0.0 (0.0) |
0.0 (0.0) |
0.0 (0.0) |
0.0 (0.0) |
0.0 (0.0) |
0.6 (1.5) |
3.4 (8.6) |
10.9 (27.6) |
| Average precipitation days (≥ 0.01 in) | 13.5 | 12.1 | 13.5 | 10.4 | 7.5 | 4.1 | 2.0 | 2.2 | 2.7 | 4.8 | 12.1 | 13.3 | 98.2 |
| Average snowy days (≥ 0.1 in) | 1.2 | 1.0 | 0.5 | 0.3 | 0.0 | 0.0 | 0.0 | 0.0 | 0.0 | 0.0 | 0.3 | 1.3 | 4.6 |
| Source 1: NOAA (aver precip/precip days, average snow/snow days 1981-2010)[3][4] | |||||||||||||
| Source 2: WRCC (mean maxima and minima 1985-2003)[5] | |||||||||||||
References edit
- ^ "Karuk Dictionary and Texts". Retrieved July 10, 2012.
- ^ Hillfinger, Charles (January 20, 1984). "The party's not over in tiny Cecilville, Calif". Sarasota Herald-Tribune. pp. 6C. Retrieved January 9, 2016.
- ^ "U.S. Climate Normals Quick Access - Station: Cecilville, CA (1991-2020)". National Oceanic and Atmospheric Administration. Retrieved October 30, 2022.
- ^ "U.S. Climate Normals Quick Access - Station: Cecilville, CA (1981-2010)". National Oceanic and Atmospheric Administration. Retrieved October 30, 2022.
- ^ "Period of Record Monthly Climate Summary". Western Regional Climate Center. Retrieved October 30, 2022.
41°08′27″N 123°08′24″W / 41.14083°N 123.14000°W