
KNOWPIA
WELCOME TO KNOWPIA

Chavin, Indre 
Summary
Chavin (French pronunciation: [ʃavɛ̃]) is a commune in the Indre department in central France.
Chavin | |
|---|---|
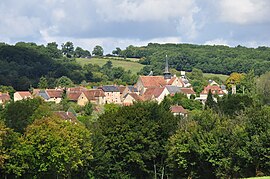 A general view of Chavin | |
Location of Chavin .mw-parser-output .locmap .od{position:absolute}.mw-parser-output .locmap .id{position:absolute;line-height:0}.mw-parser-output .locmap .l0{font-size:0;position:absolute}.mw-parser-output .locmap .pv{line-height:110%;position:absolute;text-align:center}.mw-parser-output .locmap .pl{line-height:110%;position:absolute;top:-0.75em;text-align:right}.mw-parser-output .locmap .pr{line-height:110%;position:absolute;top:-0.75em;text-align:left}.mw-parser-output .locmap .pv>div{display:inline;padding:1px}.mw-parser-output .locmap .pl>div{display:inline;padding:1px;float:right}.mw-parser-output .locmap .pr>div{display:inline;padding:1px;float:left}html.skin-theme-clientpref-night .mw-parser-output .od,html.skin-theme-clientpref-night .mw-parser-output .od .pv>div,html.skin-theme-clientpref-night .mw-parser-output .od .pl>div,html.skin-theme-clientpref-night .mw-parser-output .od .pr>div{background:#000;color:#fff}html.skin-theme-clientpref-night .mw-parser-output .locmap{filter:grayscale(0.6)}@media(prefers-color-scheme:dark){html.skin-theme-clientpref-os .mw-parser-output .locmap{filter:grayscale(0.6)}html.skin-theme-clientpref-os .mw-parser-output .od,html.skin-theme-clientpref-os .mw-parser-output .od .pv>div,html.skin-theme-clientpref-os .mw-parser-output .od .pl>div,html.skin-theme-clientpref-os .mw-parser-output .od .pr>div{background:#000;color:#fff}}  Chavin  Chavin | |
| Coordinates: 46°33′43″N 1°36′42″E / 46.5619°N 1.6117°E | |
| Country | France |
| Region | Centre-Val de Loire |
| Department | Indre |
| Arrondissement | Châteauroux |
| Canton | Argenton-sur-Creuse |
| Government | |
| • Mayor (2020–2026) | Jean-Pierre Grelet[1] |
| Area 1 | 14.01 km2 (5.41 sq mi) |
| Population (2021)[2] | 271 |
| • Density | 19/km2 (50/sq mi) |
| Time zone | UTC+01:00 (CET) |
| • Summer (DST) | UTC+02:00 (CEST) |
| INSEE/Postal code | 36048 /36200 |
| Elevation | 154–276 m (505–906 ft) (avg. 155 m or 509 ft) |
| 1 French Land Register data, which excludes lakes, ponds, glaciers > 1 km2 (0.386 sq mi or 247 acres) and river estuaries. | |
Population edit
| Year | Pop. | ±% p.a. |
|---|---|---|
| 1968 | 335 | — |
| 1975 | 311 | −1.06% |
| 1982 | 292 | −0.90% |
| 1990 | 288 | −0.17% |
| 1999 | 301 | +0.49% |
| 2009 | 288 | −0.44% |
| 2014 | 274 | −0.99% |
| 2020 | 269 | −0.31% |
| Source: INSEE[3] | ||
See also edit
References edit
- ^ "Répertoire national des élus: les maires". data.gouv.fr, Plateforme ouverte des données publiques françaises (in French). 2 December 2020.
- ^ "Populations légales 2021". The National Institute of Statistics and Economic Studies. 28 December 2023.
- ^ Population en historique depuis 1968, INSEE
Wikimedia Commons has media related to Chavin (Indre).