


Summary
Cheadle is a borough constituency represented in the House of Commons of the Parliament of the United Kingdom.
| Cheadle | |
|---|---|
| Borough constituency for the House of Commons | |
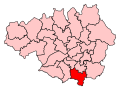 Boundary of Cheadle in Greater Manchester | |
| County | Greater Manchester |
| Population | 91,023 (2011 census)[1] |
| Electorate | 71,797 (December 2010)[2] |
| Major settlements | Cheadle, Cheadle Hulme, Bramhall |
| Current constituency | |
| Created | 1950 |
| Member of Parliament | Mary Robinson (Conservatives) |
| Seats | One |
| Created from | Bucklow, Knutsford and Macclesfield |
It elects one Member of Parliament (MP) by the first-past-the-post voting system.
It is a marginal seat between the Conservatives and the Liberal Democrats. From 1970 until 2001, it was held by the Conservatives, after which it was held by the Liberal Democrats from 2001 until the 2015 general election, when it was taken back by the Conservatives.[3]
Boundaries edit

1950–1955: The Urban Districts of Bredbury and Romiley, Cheadle and Gatley, Hazel Grove and Bramhall, and Marple.[4]
Cheadle and Gatley previously part of the abolished constituency of Bucklow, Hazel Grove and Bramhall transferred from Knutsford, and Bredbury, Romiley and Marple transferred from Macclesfield. Also included Mellor (now part of the Urban District of Marple), which was previously in the Derbyshire constituency of High Peak.
1955–1974: As above except the part of Bredbury ward added to the County Borough of Stockport by the Stockport (Extension) Order 1952, which was transferred to Stockport South (Statutory Instrument 1953–742).[4]
1974–1983: The Urban Districts of Cheadle and Gatley, and Wilmslow.[4]
The majority of the constituency was hived off to form Hazel Grove, leave just Cheadle and Gatley. Partly compensated by the transfer of Wilmslow from Macclesfield.
From 1 April 1974 until the next boundary review came into effect for the 1983 general election, the constituency comprised parts of the Metropolitan Borough of Stockport in Greater Manchester (Cheadle and Gatley) and parts of the expanded Borough of Macclesfield in Cheshire (Wilmslow), but its boundaries were unchanged.
1983–2010: The Borough of Stockport wards of Cheadle, Cheadle Hulme North, Cheadle Hulme South, East Bramhall, Heald Green, and West Bramhall.[5][6]
Wilmslow included in the new constituency of Tatton in Cheshire, with smaller parts transferred to Macclesfield and Stockport, Bramhall transferred from Hazel Grove.
2010–present: The Borough of Stockport wards of Bramhall North, Bramhall South, Cheadle and Gatley, Cheadle Hulme North, Cheadle Hulme South, Heald Green, and Stepping Hill.[7]
Boundaries adjusted to take account of revision of local authority wards.
Proposed edit
Further to the 2023 Periodic Review of Westminster constituencies, enacted by the Parliamentary Constituencies Order 2023, the composition of the constituency from the next general election, due by January 2025, will be unchanged.[8]
History edit
Cheadle was created as a county constituency under the Representation of the People Act 1948, for the 1950 general election. it covered a predominantly urban and relatively affluent area in the south-eastern suburbs of the Manchester conurbation.
The growth of the suburbs of Manchester led to a rapidly rising electorate from the late 1950s and by the 1970 election there were 107,225 electors and some reduction was inevitable. At the February 1974 general election the seat was re-classified as a borough constituency and split in two, with the eastern parts forming the new Hazel Grove constituency.
As a result of changes to the county boundaries which came into effect on 1 April 1974, the constituency crossed between Greater Manchester and Cheshire. Realigning with the county boundaries in 1983, the constituency was redrawn, losing Wilmslow to Tatton, whilst gaining back Bramhall from Hazel Grove.
Members of Parliament edit
The current MP is the Conservative Mary Robinson, who defeated Mark Hunter at the 2015 general election.
From 1974, (when half of the seat was split off to create the Hazel Grove constituency), Cheadle had safe Conservative majorities until the 1997 election, when the Liberal Democrats reduced the margin to around 3,000 votes. Patsy Calton scraped home in 2001 by a majority of 33 votes, the narrowest in the House of Commons, but returned with a much safer 4,000 votes in 2005. She died on 29 May 2005, triggering a by-election in July 2005, where Mark Hunter was elected with a majority of 3,657. Although held by Hunter in 2010, the Conservatives regained the seat in 2015 and held it in 2017 and 2019, albeit with reduced majorities on each occasion.
Elections edit
Elections in the 2020s edit
| Party | Candidate | Votes | % | ±% | |
|---|---|---|---|---|---|
| Labour | Kelly Fowler[11] | ||||
| Liberal Democrats | Tom Morrison[12] | ||||
Elections in the 2010s edit
| Party | Candidate | Votes | % | ±% | |
|---|---|---|---|---|---|
| Conservative | Mary Robinson | 25,694 | 46.0 | +1.4 | |
| Liberal Democrats | Tom Morrison | 23,358 | 41.8 | +5.5 | |
| Labour | Zahid Chauhan | 6,851 | 12.3 | ―6.8 | |
| Majority | 2,336 | 4.2 | ―4.1 | ||
| Turnout | 55,903 | 74.9 | +0.6 | ||
| Conservative hold | Swing | ―2.0 | |||
| Party | Candidate | Votes | % | ±% | |
|---|---|---|---|---|---|
| Conservative | Mary Robinson | 24,331 | 44.6 | +1.5 | |
| Liberal Democrats | Mark Hunter | 19,824 | 36.3 | +5.3 | |
| Labour | Martin Miller | 10,417 | 19.1 | +2.8 | |
| Majority | 4,507 | 8.3 | ―3.8 | ||
| Turnout | 54,572 | 74.3 | +1.9 | ||
| Conservative hold | Swing | ―2.0 | |||
| Party | Candidate | Votes | % | ±% | |
|---|---|---|---|---|---|
| Conservative | Mary Robinson | 22,889 | 43.1 | +2.3 | |
| Liberal Democrats | Mark Hunter | 16,436 | 31.0 | ―16.1 | |
| Labour | Martin Miller | 8,673 | 16.3 | +6.9 | |
| UKIP | Shaun Hopkins | 4,423 | 8.3 | +5.6 | |
| Independent | Matthew Torbitt | 390 | 0.7 | New | |
| Above and Beyond | Drew Carswell | 208 | 0.4 | New | |
| Independence from Europe | Helen Bashford | 76 | 0.1 | New | |
| Majority | 6,453 | 12.1 | N/A | ||
| Turnout | 53,095 | 72.5 | 0.0 | ||
| Conservative gain from Liberal Democrats | Swing | +9.2 | |||
| Party | Candidate | Votes | % | ±% | |
|---|---|---|---|---|---|
| Liberal Democrats | Mark Hunter | 24,717 | 47.1 | ―0.7 | |
| Conservative | Ben Jeffreys | 21,445 | 40.8 | +0.5 | |
| Labour | Martin Miller | 4,920 | 9.4 | ―0.5 | |
| UKIP | Tony Moore | 1,430 | 2.7 | New | |
| Majority | 3,272 | 6.3 | ―1.2 | ||
| Turnout | 52,512 | 72.5 | +3.7 | ||
| Liberal Democrats hold | Swing | ―0.6 | |||
Elections in the 2000s edit

| Party | Candidate | Votes | % | ±% | |
|---|---|---|---|---|---|
| Liberal Democrats | Mark Hunter | 19,593 | 52.2 | +3.3 | |
| Conservative | Stephen Day | 15,936 | 42.4 | +2.0 | |
| Labour | Martin Miller | 1,739 | 4.6 | ―4.2 | |
| Veritas | Leslie Leggett | 218 | 0.6 | New | |
| Alliance for Change (UK) | John Allman | 81 | 0.2 | New | |
| Majority | 3,657 | 9.8 | +1.3 | ||
| Turnout | 37,567 | 55.2 | ―14.4 | ||
| Liberal Democrats hold | Swing | +0.6 | |||
| Party | Candidate | Votes | % | ±% | |
|---|---|---|---|---|---|
| Liberal Democrats | Patsy Calton | 23,189 | 48.9 | +6.5 | |
| Conservative | Stephen Day | 19,169 | 40.4 | ―1.9 | |
| Labour | Martin Miller | 4,169 | 8.8 | ―5.2 | |
| UKIP | Vincent L. Cavanagh | 489 | 1.0 | ―0.4 | |
| BNP | Richard Chadfield | 421 | 0.9 | New | |
| Majority | 4,020 | 8.5 | +8.4 | ||
| Turnout | 47,437 | 69.6 | +6.4 | ||
| Liberal Democrats hold | Swing | +4.2 | |||
| Party | Candidate | Votes | % | ±% | |
|---|---|---|---|---|---|
| Liberal Democrats | Patsy Calton | 18,477 | 42.4 | +4.7 | |
| Conservative | Stephen Day | 18,444 | 42.3 | ―1.4 | |
| Labour | Howard Dawber | 6,086 | 14.0 | ―1.7 | |
| UKIP | Vincent Cavanagh | 599 | 1.4 | New | |
| Majority | 33 | 0.1 | N/A | ||
| Turnout | 43,606 | 63.2 | ―14.1 | ||
| Liberal Democrats gain from Conservative | Swing | +3.0 | |||
Elections in the 1990s edit
The Cheadle constituency underwent minor boundary changes after the 1992 general election and as such the change in share of vote is based on a notional calculation.
| Party | Candidate | Votes | % | ±% | |
|---|---|---|---|---|---|
| Conservative | Stephen Day | 22,944 | 43.7 | −14.0 | |
| Liberal Democrats | Patsy Calton | 19,755 | 37.7 | +8.1 | |
| Labour | Paul Diggett | 8,253 | 15.7 | +3.3 | |
| Referendum | Paul Brook | 1,511 | 2.9 | New | |
| Majority | 3,189 | 6.0 | -21.8 | ||
| Turnout | 52,463 | 77.3 | -6.9 | ||
| Conservative hold | Swing | −11.1 | |||
| Party | Candidate | Votes | % | ±% | |
|---|---|---|---|---|---|
| Conservative | Stephen Day | 32,504 | 58.2 | +3.2 | |
| Liberal Democrats | Patsy Calton | 16,726 | 30.0 | −5.9 | |
| Labour | Sandra R. Broadhurst | 6,442 | 11.5 | +2.4 | |
| Natural Law | Phillipa M. Whittle | 168 | 0.3 | New | |
| Majority | 15,778 | 28.2 | +9.1 | ||
| Turnout | 55,840 | 84.4 | +3.4 | ||
| Conservative hold | Swing | +4.6 | |||
Elections in the 1980s edit
| Party | Candidate | Votes | % | ±% | |
|---|---|---|---|---|---|
| Conservative | Stephen Day | 30,484 | 55.0 | −0.7 | |
| Liberal | Brian Leah | 19,853 | 35.9 | −1.4 | |
| Labour | Ann Coffey | 5,037 | 9.1 | +2.1 | |
| Majority | 10,631 | 19.1 | +0.7 | ||
| Turnout | 55,374 | 81.0 | +4.2 | ||
| Conservative hold | Swing | +0.4 | |||
The boundaries of the constituency changed in 1983. Changes in the vote are based on the estimated results for 1979 had the 1983 boundaries been in operation then.
| Party | Candidate | Votes | % | ±% | |
|---|---|---|---|---|---|
| Conservative | Tom Normanton | 28,452 | 55.7 | −4.5 | |
| Liberal | Paul R. Clark | 19,072 | 37.3 | +9.0 | |
| Labour | Kenneth Parker | 3,553 | 7.0 | −4.5 | |
| Majority | 9,380 | 18.4 | -11.7 | ||
| Turnout | 51,077 | 76.8 | −5.0 | ||
| Conservative hold | Swing | ||||
Elections in the 1970s edit
| Party | Candidate | Votes | % | ±% | |
|---|---|---|---|---|---|
| Conservative | Tom Normanton | 32,407 | 58.8 | +9.6 | |
| Liberal | David Austick | 15,268 | 27.7 | −7.8 | |
| Labour | Frances Done | 7,415 | 13.5 | −1.8 | |
| Majority | 17,139 | 31.1 | +17.4 | ||
| Turnout | 55,090 | 81.8 | +1.6 | ||
| Conservative hold | Swing | +8.7 | |||
| Party | Candidate | Votes | % | ±% | |
|---|---|---|---|---|---|
| Conservative | Tom Normanton | 25,863 | 49.2 | −0.5 | |
| Liberal | Christopher Green | 18,687 | 35.5 | −3.0 | |
| Labour | Paul Castle | 8,048 | 15.3 | +3.4 | |
| Majority | 7,176 | 13.7 | +2.5 | ||
| Turnout | 52,598 | 80.2 | -5.2 | ||
| Conservative hold | Swing | +1.3 | |||
After the 1970 general election, boundary changes created the Hazel Grove constituency which reduced the size of the Cheadle one. The previous Member of Parliament for Cheadle, Dr Michael Winstanley became the first member returned by Hazel Grove.
| Party | Candidate | Votes | % | ±% | |
|---|---|---|---|---|---|
| Conservative | Tom Normanton | 27,556 | 49.7 | -1.3 | |
| Liberal | Christopher Green | 21,332 | 38.5 | +2.3 (est.) | |
| Labour | Paul Castle | 6,584 | 11.9 | -0.9 | |
| Majority | 6,224 | 11.2 | -3.6 | ||
| Turnout | 55,472 | 85.4 | |||
| Conservative hold | Swing | ||||
| Party | Candidate | Votes | % | ±% | |
|---|---|---|---|---|---|
| Conservative | Tom Normanton | 39,728 | 46.3 | +4.8 | |
| Liberal | Michael Winstanley | 37,974 | 44.3 | +1.9 | |
| Labour | Roger Stott | 8,062 | 9.4 | −6.8 | |
| Majority | 1,754 | 2.0 | N/A | ||
| Turnout | 85,764 | 79.9 | -2.5 | ||
| Conservative gain from Liberal | Swing | +3.3 | |||
Elections in the 1960s edit
| Party | Candidate | Votes | % | ±% | |
|---|---|---|---|---|---|
| Liberal | Michael Winstanley | 32,071 | 42.4 | +7.6 | |
| Conservative | William Shepherd | 31,416 | 41.5 | −5.3 | |
| Labour | Sholto Moxley | 12,244 | 16.2 | −2.3 | |
| Majority | 655 | 0.9 | N/A | ||
| Turnout | 75,731 | 82.4 | -1.2 | ||
| Liberal gain from Conservative | Swing | +6.7 | |||
| Party | Candidate | Votes | % | ±% | |
|---|---|---|---|---|---|
| Conservative | William Shepherd | 33,911 | 46.8 | −8.2 | |
| Liberal | Roger Cuss | 25,220 | 34.8 | +8.8 | |
| Labour | Sholto Moxley | 13,379 | 18.5 | −0.6 | |
| Majority | 8,691 | 12.0 | -17.0 | ||
| Turnout | 72,510 | 83.6 | -0.1 | ||
| Conservative hold | Swing | −8.5 | |||
Elections in the 1950s edit
| Party | Candidate | Votes | % | ±% | |
|---|---|---|---|---|---|
| Conservative | William Shepherd | 32,787 | 55.0 | −7.3 | |
| Liberal | Roger Cuss | 15,469 | 26.0 | +10.4 | |
| Labour | Charles Morris | 11,373 | 19.0 | −3.1 | |
| Majority | 17,318 | 29.0 | -11.2 | ||
| Turnout | 59,629 | 83.7 | +3.1 | ||
| Conservative hold | Swing | −8.9 | |||
| Party | Candidate | Votes | % | ±% | |
|---|---|---|---|---|---|
| Conservative | William Shepherd | 30,940 | 62.3 | −0.3 | |
| Labour | Harry V. Stone | 10,966 | 22.1 | −2.9 | |
| Liberal | Ronald Palmer | 7,756 | 15.6 | +3.2 | |
| Majority | 19,974 | 40.2 | +2.6 | ||
| Turnout | 49,662 | 80.6 | -5.1 | ||
| Conservative hold | Swing | +1.3 | |||
| Party | Candidate | Votes | % | ±% | |
|---|---|---|---|---|---|
| Conservative | William Shepherd | 32,369 | 62.6 | +4.4 | |
| Labour | Hatton Jones | 12,910 | 25.0 | −0.3 | |
| Liberal | George Samways | 6,388 | 12.4 | −4.2 | |
| Majority | 19,459 | 37.6 | +4.8 | ||
| Turnout | 51,667 | 85.7 | -3.2 | ||
| Conservative hold | Swing | +2.4 | |||
| Party | Candidate | Votes | % | ±% | |
|---|---|---|---|---|---|
| Conservative | William Shepherd | 30,740 | 58.2 | ||
| Labour | Hatton Jones | 13,389 | 25.3 | ||
| Liberal | George Edward Samways | 8,801 | 16.6 | ||
| Majority | 17,351 | 32.8 | |||
| Turnout | 52,930 | 88.9 | |||
| Conservative win (new seat) | |||||
See also edit
References edit
- ^ "Cheadle: Usual Resident Population, 2011". Neighbourhood Statistics. Office for National Statistics. Retrieved 20 February 2015.
- ^ "Electorate Figures – Boundary Commission for England". 2011 Electorate Figures. Boundary Commission for England. 4 March 2011. Archived from the original on 6 November 2010. Retrieved 13 March 2011.
- ^ Statham, Nick (8 May 2015). "Cheadle constituency results: General Election 2015 – Tories take seat from the Liberal Democrats". Manchester Evening News. Retrieved 8 May 2015.
- ^ a b c Craig, Fred W. S. (1972). Boundaries of parliamentary constituencies 1885-1972. Chichester: Political Reference Publications. ISBN 0-900178-09-4. OCLC 539011.
- ^ "The Parliamentary Constituencies (England) Order 1983" (PDF).
- ^ "The Parliamentary Constituencies (England) Order 1995".
- ^ "The Parliamentary Constituencies (England) Order 2007".
- ^ "The Parliamentary Constituencies Order 2023". Schedule 1 Part 5 North West region.
- ^ "Cheadle 1950–". Parliamentary Debates (Hansard). Retrieved 20 February 2015.
- ^ Leigh Rayment's Historical List of MPs – Constituencies beginning with "C" (part 3)
- ^ Kelly Fowler [@kelly4labour] (10 April 2024). "I am honoured and grateful to have been selected as Cheadle's parliamentary candidate for #Labour" (Tweet) – via Twitter.
- ^ "Liberal Democrat Prospective Parliamentary Candidates". Mark Pack. Retrieved 27 January 2024.
- ^ "Statement of persons nominated 2019" (PDF).
- ^ "Liberal Democrats select local Councillors Lisa Smart and Mark Hunter to fight for Hazel Grove and Cheadle – Stockport Liberal Democrats". stockportlibdems.org.uk. 19 July 2016. Retrieved 23 April 2018.
- ^ Mary Robinson MP [@MaryRobinson01] (23 April 2017). "Absolutely delighted to have been readopted by Cheadle Conservatives to be the Conservative Party candidate in the…" (Tweet) – via Twitter.
- ^ "Labour Cheadle (@cheadlelabour) – Twitter". twitter.com. Retrieved 23 April 2018.
- ^ "Election Data 2015". Electoral Calculus. Archived from the original on 17 October 2015. Retrieved 17 October 2015.
- ^ "Cheadle parliamentary constituency – Election 2015 – BBC News". BBC News. Retrieved 8 May 2015.
- ^ "Election Data 2010". Electoral Calculus. Archived from the original on 26 July 2013. Retrieved 17 October 2015.
- ^ "Election Data 2005". Electoral Calculus. Archived from the original on 15 October 2011. Retrieved 18 October 2015.
- ^ "Election Data 2001". Electoral Calculus. Archived from the original on 15 October 2011. Retrieved 18 October 2015.
- ^ "Election Data 1997". Electoral Calculus. Archived from the original on 15 October 2011. Retrieved 18 October 2015.
- ^ "Election Data 1992". Electoral Calculus. Archived from the original on 15 October 2011. Retrieved 18 October 2015.
- ^ "UK General Election results April 1992". Richard Kimber's Political Science Resources. Politics Resources. 9 April 1992. Archived from the original on 11 August 2011. Retrieved 6 December 2010.
- ^ "Election Data 1987". Electoral Calculus. Archived from the original on 15 October 2011. Retrieved 18 October 2015.
- ^ "Election Data 1983". Electoral Calculus. Archived from the original on 15 October 2011. Retrieved 18 October 2015.
Sources edit
- Liberal Democrat Patsy Calton, 56, dies of Cancer
- Election result, 2005
- Election results, 1997 – 2001 Archived 2010-05-03 at the Wayback Machine
- Election results, 1983 – 1992
- Election results, 1959 – 2001 Archived 5 May 2004 at the Wayback Machine
- F.W.S. Craig. British Parliamentary Election Results 1950–1973. ISBN 0-900178-07-8
External links edit
- nomis Constituency Profile for Cheadle — presenting data from the ONS annual population survey and other official statistics.
53°23′46″N 2°12′14″W / 53.396°N 2.204°W