


Summary
Chevroux is a municipality in the district of Broye-Vully in the canton of Vaud in Switzerland.
Chevroux | |
|---|---|
 | |
 Coat of arms | |
Location of Chevroux .mw-parser-output .locmap .od{position:absolute}.mw-parser-output .locmap .id{position:absolute;line-height:0}.mw-parser-output .locmap .l0{font-size:0;position:absolute}.mw-parser-output .locmap .pv{line-height:110%;position:absolute;text-align:center}.mw-parser-output .locmap .pl{line-height:110%;position:absolute;top:-0.75em;text-align:right}.mw-parser-output .locmap .pr{line-height:110%;position:absolute;top:-0.75em;text-align:left}.mw-parser-output .locmap .pv>div{display:inline;padding:1px}.mw-parser-output .locmap .pl>div{display:inline;padding:1px;float:right}.mw-parser-output .locmap .pr>div{display:inline;padding:1px;float:left}html.skin-theme-clientpref-night .mw-parser-output .od,html.skin-theme-clientpref-night .mw-parser-output .od .pv>div,html.skin-theme-clientpref-night .mw-parser-output .od .pl>div,html.skin-theme-clientpref-night .mw-parser-output .od .pr>div{background:#000;color:#fff}html.skin-theme-clientpref-night .mw-parser-output .locmap{filter:grayscale(0.6)}@media(prefers-color-scheme:dark){html.skin-theme-clientpref-os .mw-parser-output .locmap{filter:grayscale(0.6)}html.skin-theme-clientpref-os .mw-parser-output .od,html.skin-theme-clientpref-os .mw-parser-output .od .pv>div,html.skin-theme-clientpref-os .mw-parser-output .od .pl>div,html.skin-theme-clientpref-os .mw-parser-output .od .pr>div{background:#000;color:#fff}}  Chevroux 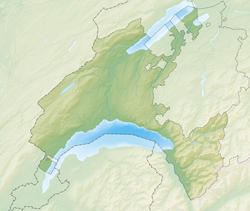 Chevroux | |
| Coordinates: 46°53′N 6°54′E / 46.883°N 6.900°E | |
| Country | Switzerland |
| Canton | Vaud |
| District | Broye-Vully |
| Government | |
| • Mayor | Syndic |
| Area | |
| • Total | 4.37 km2 (1.69 sq mi) |
| Elevation | 454 m (1,490 ft) |
| Population (31 December 2018)[2] | |
| • Total | 480 |
| • Density | 110/km2 (280/sq mi) |
| Time zone | UTC+01:00 (Central European Time) |
| • Summer (DST) | UTC+02:00 (Central European Summer Time) |
| Postal code(s) | 1545 |
| SFOS number | 5813 |
| ISO 3166 code | CH-VD |
| Surrounded by | Bevaix (NE), Boudry (NE), Cortaillod (NE), Forel (FR), Gletterens (FR), Grandcour |
| Website | www Profile (in French), SFSO statistics |
History edit
Chevroux is first mentioned in 1286 as Chevroth.[3]
Geography edit
As of 2009, Chevroux has an area of 4.37 square kilometers (1.69 sq mi). Of this area, 2.08 km2 (0.80 sq mi) or 47.6% is used for agricultural purposes, while 0.83 km2 (0.32 sq mi) or 19.0% is forested. Of the rest of the land, 0.41 km2 (0.16 sq mi) or 9.4% is settled (buildings or roads), 0.02 km2 (4.9 acres) or 0.5% is either rivers or lakes and 1.01 km2 (0.39 sq mi) or 23.1% is unproductive land.[4]
Of the built up area, industrial buildings made up 1.1% of the total area while housing and buildings made up 5.0% and transportation infrastructure made up 2.5%. Out of the forested land, all of the forested land area is covered with heavy forests. Of the agricultural land, 39.1% is used for growing crops and 4.6% is pastures, while 3.9% is used for orchards or vine crops. All the water in the municipality is in lakes.[4]
The municipality was part of the Payerne District until it was dissolved on 31 August 2006, and Chevroux became part of the new district of Broye-Vully.[5]
The municipality is located on the south-east bank of Lake Neuchâtel. It consists of the village of Chevroux and the hamlet of Ostende (previously known as Chevrottet).
Coat of arms edit
The blazon of the municipal coat of arms is Per bend Gules and Argent, overall behind a Lion passant guardant holding a Scimitar a rising Sun all of Or.[6]
Demographics edit
Chevroux has a population (as of December 2020[update]) of 494.[7] As of 2008[update], 5.8% of the population are resident foreign nationals.[8] Over the last 10 years (1999–2009 ) the population has changed at a rate of 6.2%. It has changed at a rate of 5.4% due to migration and at a rate of 0.3% due to births and deaths.[9]
Most of the population (as of 2000[update]) speaks French (347 or 90.6%), with German being second most common (24 or 6.3%) and Polish third (5 or 1.3%).[10]
Of the population in the municipality 185 or about 48.3% were born in Chevroux and lived there in 2000. There were 76 or 19.8% who were born in the same canton, while 84 or 21.9% were born somewhere else in Switzerland, and 31 or 8.1% were born outside of Switzerland.[10]
In 2008[update] there were 4 live births to Swiss citizens and 1 death of a Swiss citizen. Ignoring immigration and emigration, the population of Swiss citizens increased by 3 while the foreign population remained the same. There was 1 non-Swiss man and 2 non-Swiss women who immigrated from another country to Switzerland. The total Swiss population change in 2008 (from all sources, including moves across municipal borders) was an increase of 15 and the non-Swiss population increased by 5 people. This represents a population growth rate of 5.3%.[8]
The age distribution, as of 2009[update], in Chevroux is; 36 children or 9.1% of the population are between 0 and 9 years old and 58 teenagers or 14.7% are between 10 and 19. Of the adult population, 38 people or 9.6% of the population are between 20 and 29 years old. 40 people or 10.2% are between 30 and 39, 66 people or 16.8% are between 40 and 49, and 58 people or 14.7% are between 50 and 59. The senior population distribution is 49 people or 12.4% of the population are between 60 and 69 years old, 32 people or 8.1% are between 70 and 79, there are 16 people or 4.1% who are between 80 and 89, and there is 1 person who is 90 and older.[11]
As of 2000[update], there were 152 people who were single and never married in the municipality. There were 190 married individuals, 27 widows or widowers and 14 individuals who are divorced.[10]
As of 2000[update], there were 143 private households in the municipality, and an average of 2.6 persons per household.[9] There were 36 households that consist of only one person and 22 households with five or more people. Out of a total of 145 households that answered this question, 24.8% were households made up of just one person and there were 4 adults who lived with their parents. Of the rest of the households, there are 43 married couples without children, 56 married couples with children There were 3 single parents with a child or children. There was 1 household that was made up of unrelated people and 2 households that were made up of some sort of institution or another collective housing.[10]
In 2000[update] there were 137 single family homes (or 69.5% of the total) out of a total of 197 inhabited buildings. There were 22 multi-family buildings (11.2%), along with 25 multi-purpose buildings that were mostly used for housing (12.7%) and 13 other use buildings (commercial or industrial) that also had some housing (6.6%). Of the single family homes 16 were built before 1919, while 14 were built between 1990 and 2000. The greatest number of single family homes (42) were built between 1961 and 1970. The most multi-family homes (5) were built before 1919 and the next most (4) were built between 1981 and 1990. There was 1 multi-family house built between 1996 and 2000.[12]
In 2000[update] there were 239 apartments in the municipality. The most common apartment size was 3 rooms of which there were 84. There were 6 single room apartments and 63 apartments with five or more rooms. Of these apartments, a total of 137 apartments (57.3% of the total) were permanently occupied, while 94 apartments (39.3%) were seasonally occupied and 8 apartments (3.3%) were empty.[12] As of 2009[update], the construction rate of new housing units was 0 new units per 1000 residents.[9] The vacancy rate for the municipality, in 2010[update], was 0.39%.[9]
The historical population is given in the following chart:[3][13]

World heritage sites edit
The prehistoric settlements at La Bessime and Village are part of the Prehistoric Pile dwellings around the Alps a UNESCO World Heritage Site.[14]
Politics edit
In the 2007 federal election the most popular party was the SVP which received 33.96% of the vote. The next three most popular parties were the FDP (24.81%), the SP (15.89%) and the LPS Party (5.8%). In the federal election, a total of 154 votes were cast, and the voter turnout was 54.2%.[15]
Economy edit
As of 2010[update], Chevroux had an unemployment rate of 2.2%. As of 2008[update], there were 40 people employed in the primary economic sector and about 19 businesses involved in this sector. 22 people were employed in the secondary sector and there were 4 businesses in this sector. 52 people were employed in the tertiary sector, with 10 businesses in this sector.[9] There were 179 residents of the municipality who were employed in some capacity, of which females made up 40.8% of the workforce.
In 2008[update] the total number of full-time equivalent jobs was 84. The number of jobs in the primary sector was 24, of which 20 were in agriculture and 5 were in fishing or fisheries. The number of jobs in the secondary sector was 20 of which 5 or (25.0%) were in manufacturing and 2 (10.0%) were in construction. The number of jobs in the tertiary sector was 40. In the tertiary sector; 7 or 17.5% were in wholesale or retail sales or the repair of motor vehicles, 1 was in the movement and storage of goods, 23 or 57.5% were in a hotel or restaurant, 5 or 12.5% were in education.[16]
In 2000[update], there were 38 workers who commuted into the municipality and 101 workers who commuted away. The municipality is a net exporter of workers, with about 2.7 workers leaving the municipality for every one entering.[17] Of the working population, 3.9% used public transportation to get to work, and 63.1% used a private car.[9]
Religion edit
From the 2000 census[update], 73 or 19.1% were Roman Catholic, while 266 or 69.5% belonged to the Swiss Reformed Church. Of the rest of the population, there was 1 member of an Orthodox church who belonged, and there were 8 individuals (or about 2.09% of the population) who belonged to another Christian church. There were 2 (or about 0.52% of the population) who were Islamic. There were and 1 individual who belonged to another church. 26 (or about 6.79% of the population) belonged to no church, are agnostic or atheist, and 6 individuals (or about 1.57% of the population) did not answer the question.[10]
Education edit
In Chevroux about 121 or (31.6%) of the population have completed non-mandatory upper secondary education, and 35 or (9.1%) have completed additional higher education (either university or a Fachhochschule). Of the 35 who completed tertiary schooling, 62.9% were Swiss men, 22.9% were Swiss women.[10]
In the 2009/2010 school year there were a total of 53 students in the Chevroux school district. In the Vaud cantonal school system, two years of non-obligatory pre-school are provided by the political districts.[18] During the school year, the political district provided pre-school care for a total of 155 children of which 83 children (53.5%) received subsidized pre-school care. The canton's primary school program requires students to attend for four years. There were 23 students in the municipal primary school program. The obligatory lower secondary school program lasts for six years and there were 30 students in those schools.[19]
As of 2000[update], there were 19 students in Chevroux who came from another municipality, while 60 residents attended schools outside the municipality.[17]
References edit
- ^ a b "Arealstatistik Standard - Gemeinden nach 4 Hauptbereichen". Federal Statistical Office. Retrieved 13 January 2019.
- ^ "Ständige Wohnbevölkerung nach Staatsangehörigkeitskategorie Geschlecht und Gemeinde; Provisorische Jahresergebnisse; 2018". Federal Statistical Office. 9 April 2019. Retrieved 11 April 2019.
- ^ a b Chevroux in German, French and Italian in the online Historical Dictionary of Switzerland.
- ^ a b Swiss Federal Statistical Office-Land Use Statistics 2009 data (in German) accessed 25 March 2010
- ^ Nomenklaturen – Amtliches Gemeindeverzeichnis der Schweiz Archived 2015-11-13 at the Wayback Machine (in German) accessed 4 April 2011
- ^ Flags of the World.com accessed 10-May-2011
- ^ "Ständige und nichtständige Wohnbevölkerung nach institutionellen Gliederungen, Geburtsort und Staatsangehörigkeit". bfs.admin.ch (in German). Swiss Federal Statistical Office - STAT-TAB. 31 December 2020. Retrieved 21 September 2021.
- ^ a b Swiss Federal Statistical Office - Superweb database - Gemeinde Statistics 1981-2008 Archived June 28, 2010, at the Wayback Machine (in German) accessed 19 June 2010
- ^ a b c d e f Swiss Federal Statistical Office Archived January 5, 2016, at the Wayback Machine accessed 10-May-2011
- ^ a b c d e f STAT-TAB Datenwürfel für Thema 40.3 - 2000 Archived April 9, 2014, at the Wayback Machine (in German) accessed 2 February 2011
- ^ Canton of Vaud Statistical Office Archived 2015-03-16 at the Wayback Machine (in French) accessed 29 April 2011
- ^ a b Swiss Federal Statistical Office STAT-TAB - Datenwürfel für Thema 09.2 - Gebäude und Wohnungen Archived September 7, 2014, at the Wayback Machine (in German) accessed 28 January 2011
- ^ Swiss Federal Statistical Office STAT-TAB Bevölkerungsentwicklung nach Region, 1850-2000 Archived September 30, 2014, at the Wayback Machine (in German) accessed 29 January 2011
- ^ UNESCO World Heritage Site - Prehistoric Pile dwellings around the Alps
- ^ Swiss Federal Statistical Office, Nationalratswahlen 2007: Stärke der Parteien und Wahlbeteiligung, nach Gemeinden/Bezirk/Canton Archived May 14, 2015, at the Wayback Machine (in German) accessed 28 May 2010
- ^ Swiss Federal Statistical Office STAT-TAB Betriebszählung: Arbeitsstätten nach Gemeinde und NOGA 2008 (Abschnitte), Sektoren 1-3 Archived December 25, 2014, at the Wayback Machine (in German) accessed 28 January 2011
- ^ a b Swiss Federal Statistical Office - Statweb (in German) accessed 24 June 2010
- ^ Organigramme de l'école vaudoise, année scolaire 2009-2010 Archived 2016-03-04 at the Wayback Machine (in French) accessed 2 May 2011
- ^ Canton of Vaud Statistical Office - Scol. obligatoire/filières de transition Archived 2016-04-25 at the Wayback Machine (in French) accessed 2 May 2011