


Summary
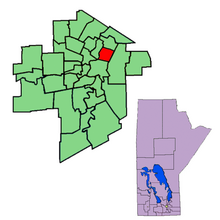
Concordia is a provincial electoral division in the Canadian province of Manitoba. It is in the northeastern part of the city of Winnipeg.
 | |||
| Provincial electoral district | |||
| Legislature | Legislative Assembly of Manitoba | ||
| MLA |
New Democratic | ||
| District created | 1979 | ||
| First contested | 1981 | ||
| Last contested | 2023 | ||
It is bordered to the south by St. Boniface, to the west by Elmwood, to the north by Rossmere, and to the east by Radisson. The riding was created by redistribution in 1979, and formally came into existence with the provincial election of 1981.
Concordia is an ethnically diverse riding, with 16% of its human population born outside Canada. According to a 1999 census report, 9% of the riding's residents are aboriginal, with a further 9% of German background and 7% of Ukrainian background.
Concordia's population in 1996 was 20,318. The average family income of the riding in 1999 was $39,613, one of the lowest in the province. Thirty-two percent of the riding's residents are listed as low-income, and 21% of its households are single-parent families. The unemployment rate in 1996 was 9.50%.
The riding's primary industry in 1999 was manufacturing (18%), followed by services (14%) and the retail trade (14%).
The New Democratic Party has represented Concordia since its creation. Gary Doer was its Member of the Legislative Assembly (MLA) from 1986, leader of the NDP from 1988, and Premier of Manitoba from 1999; he gave up all three of these positions when he was appointed as Ambassador to the United States in 2009. He had been re-elected in 2003 and 2007 with 77% and 70% of the popular vote. A by-election to succeed Doer was scheduled for March 2, 2010.[1] In the event, Matt Wiebe, who previously worked for Doer as a constituency assistant, retained Concordia for the NDP,[2] and he has continued to represent it since.
List of provincial representatives edit
| Parliament | Years | Member | Party | |
|---|---|---|---|---|
| Riding created from Rossmere, Kildonan, Elmwood and Radisson | ||||
| 32nd | 1981–1986 | Peter Fox | New Democratic | |
| 33rd | 1986–1988 | Gary Doer | ||
| 34th | 1988–1990 | |||
| 35th | 1990–1995 | |||
| 36th | 1995–1999 | |||
| 37th | 1999–2003 | |||
| 38th | 2003–2007 | |||
| 39th | 2007–2009 | |||
| 2010–2011 | Matt Wiebe | |||
| 40th | 2011–2016 | |||
| 41st | 2016–2019 | |||
| 42nd | 2019–2023 | |||
| 43rd | 2023–present | |||
Election results edit
1981 edit
| 1981 Manitoba general election | ||||||||
|---|---|---|---|---|---|---|---|---|
| Party | Candidate | Votes | % | |||||
| New Democratic | Peter Fox | 5,333 | 60.91 | |||||
| Progressive Conservative | Scotty McVicar | 2,586 | 29.54 | |||||
| Liberal | Gail Stapon | 309 | 3.53 | |||||
| Progressive | Josephine Young | 306 | 3.50 | |||||
| Independent | Bob Fraser | 221 | 2.52 | |||||
| Total valid votes | 8,755 | – | ||||||
| Rejected | 15 | – | ||||||
| Eligible voters / Turnout | 12,589 | 69.54 | ||||||
Source(s)
Source: Manitoba. Chief Electoral Officer (1999). Statement of Votes for the 37th Provincial General Election, September 21, 1999 (PDF) (Report). Winnipeg: Elections Manitoba. | ||||||||
1986 edit
| 1986 Manitoba general election | ||||||||
|---|---|---|---|---|---|---|---|---|
| Party | Candidate | Votes | % | ±% | ||||
| New Democratic | Gary Doer | 4,525 | 54.37 | -6.54 | ||||
| Progressive Conservative | Brent Aubertin | 2,684 | 32.25 | 2.71 | ||||
| Liberal | Gail Stapon | 909 | 10.92 | 7.39 | ||||
| WCC | Fred Cameron | 204 | 2.45 | – | ||||
| Total valid votes | 8,322 | – | – | |||||
| Rejected | 13 | – | ||||||
| Eligible voters / Turnout | 12,587 | 66.22 | – | |||||
| New Democratic hold | Swing | -4.63 | ||||||
Source(s)
Source: Manitoba. Chief Electoral Officer (1999). Statement of Votes for the 37th Provincial General Election, September 21, 1999 (PDF) (Report). Winnipeg: Elections Manitoba. | ||||||||
1988 edit
| 1988 Manitoba general election | ||||||||
|---|---|---|---|---|---|---|---|---|
| Party | Candidate | Votes | % | ±% | ||||
| New Democratic | Gary Doer | 3,702 | 37.71 | -16.66 | ||||
| Liberal | Barbara Blomeley | 2,948 | 30.03 | 19.11 | ||||
| Progressive Conservative | Victor Rubiletz | 2,634 | 26.83 | -5.42 | ||||
| Independent | Bill Seman | 358 | 3.65 | – | ||||
| Western Independence | Fred Cameron | 114 | 1.16 | – | ||||
| Progressive | Charles Henry | 61 | 0.62 | – | ||||
| Total valid votes | 9,817 | – | – | |||||
| Rejected | 10 | – | ||||||
| Eligible voters / turnout | 12,857 | 76.43 | 10.21 | |||||
| New Democratic hold | Swing | -17.89 | ||||||
Source(s)
Source: Manitoba. Chief Electoral Officer (1999). Statement of Votes for the 37th Provincial General Election, September 21, 1999 (PDF) (Report). Winnipeg: Elections Manitoba. | ||||||||
1990 edit
| 1990 Manitoba general election | ||||||||
|---|---|---|---|---|---|---|---|---|
| Party | Candidate | Votes | % | ±% | ||||
| New Democratic | Gary Doer | 4,588 | 58.17 | 20.46 | ||||
| Progressive Conservative | Vic Hubiletz | 1,937 | 24.56 | -2.27 | ||||
| Liberal | Gunther Grosskamper | 1,059 | 13.43 | -16.60 | ||||
| Western Independence | Fred Cameron | 168 | 2.13 | 0.97 | ||||
| Libertarian | Guy Beaudry | 135 | 1.71 | – | ||||
| Total valid votes | 7,887 | – | – | |||||
| Rejected | 12 | – | ||||||
| Eligible voters / turnout | 11,551 | 68.38 | -8.05 | |||||
Source(s)
Source: Manitoba. Chief Electoral Officer (1999). Statement of Votes for the 37th Provincial General Election, September 21, 1999 (PDF) (Report). Winnipeg: Elections Manitoba. | ||||||||
1995 edit
| 1995 Manitoba general election | ||||||||
|---|---|---|---|---|---|---|---|---|
| Party | Candidate | Votes | % | ±% | Expenditures | |||
| New Democratic | Gary Doer | 4,827 | 63.58 | 5.41 | $17,879.00 | |||
| Progressive Conservative | Paul Murphy | 1,845 | 24.30 | -0.26 | $13,105.33 | |||
| Liberal | Bret Dobbin | 816 | 10.75 | -2.68 | $11,467.33 | |||
| Libertarian | Guy Beaudry | 104 | 1.37 | -0.34 | $477.96 | |||
| Total valid votes | 7,592 | – | – | |||||
| Rejected | 30 | – | ||||||
| Eligible voters / turnout | 11,406 | 66.82 | -1.56 | |||||
Source(s)
Source: Manitoba. Chief Electoral Officer (1999). Statement of Votes for the 37th Provincial General Election, September 21, 1999 (PDF) (Report). Winnipeg: Elections Manitoba. | ||||||||
1999 edit
| 1999 Manitoba general election | ||||||||
|---|---|---|---|---|---|---|---|---|
| Party | Candidate | Votes | % | ±% | Expenditures | |||
| New Democratic | Gary Doer | 5,691 | 70.09 | 6.51 | $13,477.00 | |||
| Progressive Conservative | Paul Murphy | 1,898 | 23.37 | -0.93 | $21,285.31 | |||
| Liberal | Chris Hlady | 444 | 5.47 | -5.28 | $193.61 | |||
| Green | Dave Nickarz | 87 | 1.07 | – | $25.00 | |||
| Total valid votes | 8,120 | – | – | |||||
| Rejected | 48 | – | ||||||
| Eligible voters / turnout | 12,703 | 64.30 | -2.52 | |||||
Source(s)
Source: Manitoba. Chief Electoral Officer (1999). Statement of Votes for the 37th Provincial General Election, September 21, 1999 (PDF) (Report). Winnipeg: Elections Manitoba. | ||||||||
2003 edit
| 2003 Manitoba general election | ||||||||
|---|---|---|---|---|---|---|---|---|
| Party | Candidate | Votes | % | ±% | Expenditures | |||
| New Democratic | Gary Doer | 4,450 | 76.67 | 6.59 | $20,354.04 | |||
| Progressive Conservative | Conor Lloyd | 935 | 16.11 | -7.26 | $0.00 | |||
| Liberal | Tanya Parks | 419 | 7.22 | 1.75 | $1,033.77 | |||
| Total valid votes | 5,804 | – | – | |||||
| Rejected | 38 | – | ||||||
| Eligible voters / turnout | 12,564 | 46.50 | -17.80 | |||||
Source(s)
Source: Manitoba. Chief Electoral Officer (2003). Statement of Votes for the 38th Provincial General Election, June 3, 2003 (PDF) (Report). Winnipeg: Elections Manitoba. | ||||||||
2007 edit
| 2007 Manitoba general election | ||||||||
|---|---|---|---|---|---|---|---|---|
| Party | Candidate | Votes | % | ±% | Expenditures | |||
| New Democratic | Gary Doer | 3,862 | 69.05 | -7.62 | $14,144.95 | |||
| Progressive Conservative | Ken Waddell | 1,209 | 21.62 | 5.51 | $15,745.09 | |||
| Liberal | Leslie Worthington | 336 | 6.01 | -1.21 | $340.30 | |||
| Green | Andrew Basham | 186 | 3.33 | – | $199.88 | |||
| Total valid votes | 5,593 | – | – | |||||
| Rejected | 28 | – | ||||||
| Eligible voters / turnout | 11,853 | 47.42 | 0.92 | |||||
Source(s)
Source: Manitoba. Chief Electoral Officer (2007). Statement of Votes for the 39th Provincial General Election, May 22, 2007 (PDF) (Report). Winnipeg: Elections Manitoba. | ||||||||
2010 by-election edit
| Manitoba provincial by-election, March 2, 2010 | ||||||||
|---|---|---|---|---|---|---|---|---|
| Party | Candidate | Votes | % | ±% | Expenditures | |||
| New Democratic | Matt Wiebe | 2,065 | 58.90 | -10.15 | $20,394.67 | |||
| Progressive Conservative | Brian Biebrich | 694 | 19.79 | -1.82 | $9,160.24 | |||
| Liberal | Judi Heppner | 613 | 17.48 | 11.48 | $5,750.52 | |||
| Green | Ellen Young | 134 | 3.82 | 0.50 | $762.27 | |||
| Total valid votes | 3,506 | – | – | |||||
| Rejected | 11 | – | ||||||
| Eligible voters / Turnout | 11,150 | 31.44 | -15.98 | |||||
Source(s)
Source: | ||||||||
2011 edit
| 2011 Manitoba general election | ||||||||
|---|---|---|---|---|---|---|---|---|
| Party | Candidate | Votes | % | ±% | Expenditures | |||
| New Democratic | Matt Wiebe | 4,008 | 63.06 | 4.16 | $15,634.85 | |||
| Progressive Conservative | Naseer Warraich | 1,803 | 28.37 | 8.57 | $29,145.84 | |||
| Green | Ryan Poirier | 308 | 4.85 | 1.02 | $0.00 | |||
| Liberal | Isaiah Oyeleru | 237 | 3.73 | -13.76 | $641.00 | |||
| Total valid votes | 6,356 | – | – | |||||
| Rejected | 34 | – | ||||||
| Eligible voters / turnout | 12,834 | 49.79 | 18.35 | |||||
Source(s)
Source: Manitoba. Chief Electoral Officer (2011). Statement of Votes for the 40th Provincial General Election, October 4, 2011 (PDF) (Report). Winnipeg: Elections Manitoba. "Election Returns: 40th General Election". Elections Manitoba. 2011. Retrieved September 12, 2018. | ||||||||
2016 edit
| 2016 Manitoba general election | ||||||||
|---|---|---|---|---|---|---|---|---|
| Party | Candidate | Votes | % | ±% | Expenditures | |||
| New Democratic | Matt Wiebe | 2,761 | 44.97 | -18.09 | $28,493.70 | |||
| Progressive Conservative | Andrew Frank | 2,483 | 40.44 | 12.07 | $21,965.28 | |||
| Liberal | Donovan Martin | 642 | 10.46 | 6.73 | $7,841.60 | |||
| Manitoba | Terry Scott | 254 | 4.14 | – | $548.47 | |||
| Total valid votes | 6,140 | – | – | |||||
| Rejected | 101 | – | ||||||
| Eligible voters / Turnout | 11,538 | 54.09 | 4.30 | |||||
Source(s)
Source: Manitoba. Chief Electoral Officer (2016). Statement of Votes for the 41st Provincial General Election, April 19, 2016 (PDF) (Report). Winnipeg: Elections Manitoba. "Election Returns: 41st General Election". Elections Manitoba. 2016. Retrieved September 10, 2018. | ||||||||
2019 edit
| 2019 Manitoba general election | ||||||||
|---|---|---|---|---|---|---|---|---|
| Party | Candidate | Votes | % | ±% | Expenditures | |||
| New Democratic | Matt Wiebe | 4,305 | 59.69 | +14.72 | $18,272.23 | |||
| Progressive Conservative | Andrew Frank | 2,295 | 31.82 | -8.62 | $11,453.01 | |||
| Liberal | Maria Albo | 612 | 8.49 | -1.97 | $0.00 | |||
| Total valid votes | 7,212 | – | – | |||||
| Rejected | 67 | – | ||||||
| Eligible voters / Turnout | 15,021 | 48.46 | -5.63 | |||||
Source(s)
Source: Manitoba. Chief Electoral Officer (2019). Statement of Votes for the 42nd Provincial General Election, September 10, 2019 (PDF) (Report). Winnipeg: Elections Manitoba. "Candidate Election Returns". Elections Manitoba. Elections Manitoba. Retrieved March 2, 2020. | ||||||||
2023 edit
| 2023 Manitoba general election | ||||||||
|---|---|---|---|---|---|---|---|---|
| ** Preliminary results — Not yet official ** | ||||||||
| Party | Candidate | Votes | % | ±% | Expenditures | |||
| New Democratic | Matt Wiebe | 4,203 | 64.46 | +4.77 | ||||
| Progressive Conservative | Alex Rogers | 1,836 | 28.16 | -3.66 | ||||
| Liberal | Trish Rawsthorne | 481 | 7.38 | -1.11 | ||||
| Total valid votes/expense limit | 6,520 | 99.27 | ||||||
| Total rejected, unmarked and declined ballots | 48 | 0.73 | ||||||
| Turnout | 6,568 | 43.97 | -4.49 | |||||
| Eligible voters | 14,936 | |||||||
| New Democratic hold | Swing | +4.22 | ||||||
Source(s)
Source: Elections Manitoba[3] | ||||||||
Previous boundaries edit
References edit
- ^ "Concordia byelection set for March 2". Winnipeg Free Press, January 29, 2010.
- ^ "Wiebe sweeps Concordia for NDP". Winnipeg Free Press, March 2, 2010.
- ^ "Elections Manitoba - Manitoba's 43rd General Election - October 3, 2023 - Unofficial Results". results.electionsmanitoba.ca. Elections Manitoba. Retrieved October 5, 2023.
49°54′47″N 97°05′31″W / 49.913°N 97.092°W