
KNOWPIA
WELCOME TO KNOWPIA

Crater Peak (Colorado) 
Summary
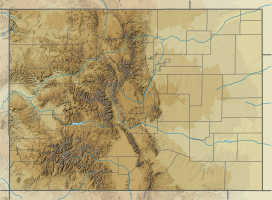
Crater Peak is the highest summit of Grand Mesa in the Rocky Mountains of North America. The prominent 11,333-foot (3,454 m) peak is located on the drainage divide separating Grand Mesa National Forest and Gunnison National Forest, 12.3 miles (19.8 km) north-northwest (bearing 342°) of the Town of Paonia in Delta County, Colorado, United States.[2][3][4][1]
| Crater Peak | |
|---|---|
 Crater Peak | |
| Highest point | |
| Elevation | 11,333 ft (3,454 m)[2][3] |
| Prominence | 2,307 ft (703 m)[4] |
| Isolation | 17.98 mi (28.94 km)[4] |
| Listing | Colorado prominent summits Colorado range high points |
| Coordinates | 39°02′23″N 107°39′46″W / 39.0395962°N 107.6628354°W[2] |
| Geography | |
| Location | Delta County, Colorado, U.S.[1] |
| Parent range | Highest summit of Grand Mesa[4] |
| Topo map | USGS 7.5' topographic map Chalk Mountain, Colorado[2] |
| Climbing | |
| Easiest route | hike |
Climate edit
| Climate data for Crater Peak 39.0480 N, 107.6844 W, Elevation: 10,971 ft (3,344 m) (1991–2020 normals) | |||||||||||||
|---|---|---|---|---|---|---|---|---|---|---|---|---|---|
| Month | Jan | Feb | Mar | Apr | May | Jun | Jul | Aug | Sep | Oct | Nov | Dec | Year |
| Mean daily maximum °F (°C) | 25.8 (−3.4) |
27.6 (−2.4) |
34.9 (1.6) |
40.0 (4.4) |
48.9 (9.4) |
60.2 (15.7) |
66.2 (19.0) |
64.0 (17.8) |
57.0 (13.9) |
45.8 (7.7) |
33.8 (1.0) |
25.6 (−3.6) |
44.2 (6.8) |
| Daily mean °F (°C) | 13.9 (−10.1) |
15.2 (−9.3) |
21.6 (−5.8) |
27.2 (−2.7) |
36.2 (2.3) |
46.2 (7.9) |
52.7 (11.5) |
50.8 (10.4) |
44.0 (6.7) |
33.5 (0.8) |
22.1 (−5.5) |
14.1 (−9.9) |
31.5 (−0.3) |
| Mean daily minimum °F (°C) | 2.0 (−16.7) |
2.8 (−16.2) |
8.3 (−13.2) |
14.5 (−9.7) |
23.5 (−4.7) |
32.3 (0.2) |
39.2 (4.0) |
37.5 (3.1) |
31.0 (−0.6) |
21.3 (−5.9) |
10.4 (−12.0) |
2.7 (−16.3) |
18.8 (−7.3) |
| Average precipitation inches (mm) | 4.34 (110) |
4.63 (118) |
4.33 (110) |
4.11 (104) |
3.07 (78) |
1.40 (36) |
2.85 (72) |
2.86 (73) |
3.47 (88) |
3.92 (100) |
3.88 (99) |
4.54 (115) |
43.4 (1,103) |
| Source: PRISM Climate Group[5] | |||||||||||||
Mountain edit
See also edit
References edit
- ^ a b "Crater Peak". Geographic Names Information System. United States Geological Survey, United States Department of the Interior. Retrieved October 29, 2014.
- ^ a b c d "CRATER PK". NGS Data Sheet. National Geodetic Survey, National Oceanic and Atmospheric Administration, United States Department of Commerce. Retrieved October 19, 2014.
- ^ a b The elevation of Crater Peak includes an adjustment of +1.750 m (+5.74 ft) from NGVD 29 to NAVD 88.
- ^ a b c d "Crater Peak, Colorado". Peakbagger.com. Retrieved October 19, 2014.
- ^ "PRISM Climate Group, Oregon State University". PRISM Climate Group, Oregon State University. Retrieved December 9, 2023.
To find the table data on the PRISM website, start by clicking Coordinates (under Location); copy Latitude and Longitude figures from top of table; click Zoom to location; click Precipitation, Minimum temp, Mean temp, Maximum temp; click 30-year normals, 1991-2020; click 800m; click Retrieve Time Series button.
External links edit
Crater Peak (Colorado) at Wikipedia's sister projects
 Definitions from Wiktionary
 Media from Commons
 News from Wikinews
 Quotations from Wikiquote
 Texts from Wikisource
 Textbooks from Wikibooks
 Resources from Wikiversity