


Summary
Cynon Valley (Welsh: Cwm Cynon) is a constituency[n 1] in Wales represented in the House of Commons of the UK Parliament since 2019 by Beth Winter of the Labour Party.[n 2]
| Cynon Valley | |
|---|---|
| County constituency for the House of Commons | |
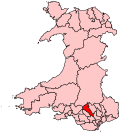 Boundary of Cynon Valley in Wales | |
| Preserved county | Mid Glamorgan |
| Electorate | 52,372 (December 2010)[1] |
| Major settlements | Aberdare, Mountain Ash, Hirwaun |
| Current constituency | |
| Created | 1983 |
| Member of Parliament | Beth Winter (Labour) |
| Seats | One |
| Created from | Aberdare and parts of Brecon and Radnor and Neath[2] |
| Overlaps | |
| Senedd | Cynon Valley, South Wales Central |
The Cynon Valley Senedd constituency was created with the same boundaries in 1999 (as an Assembly constituency).
The constituency is set to be abolished, as part of the 2023 Periodic Review of Westminster constituencies and under the June 2023 final recommendations of the Boundary Commission for Wales for the next United Kingdom general election. Its wards are to be split between Merthyr Tydfil and Aberdare, and Pontypridd.[3]
Boundaries edit

1983–2010: The Borough of Cynon Valley.
2010–present: The Rhondda Cynon Taff County Borough electoral divisions of Aberaman North, Aberaman South, Abercynon, Aberdare East, Aberdare West/Llwydcoed, Cilfynydd, Cwmbach, Glyncoch, Hirwaun, Mountain Ash East, Mountain Ash West, Penrhiwceiber, Pen-y-waun, Rhigos, and Ynysybwl.
The constituency encompasses the towns of Aberdare, Mountain Ash, Cilfynydd, Abercynon and Hirwaun.
Members of Parliament edit
| Election | Member[4] | Party | |
|---|---|---|---|
| 1983 | Ioan Evans | Labour Co-op | |
| 1984 by-election | Ann Clwyd | Labour | |
| 2019 | Beth Winter | Labour | |
Elections edit

Elections in the 1980s edit
| Party | Candidate | Votes | % | ±% | |
|---|---|---|---|---|---|
| Labour Co-op | Ioan Evans | 20,668 | 56.0 | N/A | |
| SDP | Felix Aubel | 7,594 | 20.6 | N/A | |
| Conservative | James Arbuthnot | 5,240 | 14.2 | N/A | |
| Plaid Cymru | Pauline Jarman | 3,421 | 9.3 | N/A | |
| Majority | 13,074 | 35.4 | N/A | ||
| Turnout | 36,923 | 73.4 | N/A | ||
| Registered electors | 50,284 | ||||
| Labour Co-op win (new seat) | |||||
| Party | Candidate | Votes | % | ±% | |
|---|---|---|---|---|---|
| Labour | Ann Clwyd | 19,389 | 58.8 | +2.8 | |
| SDP | Felix Aubel | 6,554 | 19.9 | −0.7 | |
| Plaid Cymru | Clayton F. Jones | 3,619 | 11.0 | +1.8 | |
| Conservative | James Arbuthnot | 2,441 | 7.4 | −6.8 | |
| Communist | Mary Winter | 642 | 1.9 | N/A | |
| Independent | Noel E. Rencontre | 215 | 0.6 | N/A | |
| Independent | Paul Nicholls-Jones | 122 | 0.4 | N/A | |
| Majority | 12,835 | 38.9 | +3.5 | ||
| Turnout | 32,982 | 65.7 | -7.7 | ||
| Registered electors | 50,237 | ||||
| Labour hold | Swing | ||||
| Party | Candidate | Votes | % | ±% | |
|---|---|---|---|---|---|
| Labour | Ann Clwyd | 26,222 | 68.9 | +12.9 | |
| SDP | Keith Butler | 4,651 | 12.2 | −8.4 | |
| Conservative | Mark Bishop | 4,638 | 12.2 | −2.0 | |
| Plaid Cymru | Dorothy Richards | 2,549 | 6.7 | −2.6 | |
| Majority | 21,571 | 56.7 | +21.3 | ||
| Turnout | 38,060 | 76.7 | +3.3 | ||
| Registered electors | 49,621 | ||||
| Labour hold | Swing | ||||
Elections in the 1990s edit
| Party | Candidate | Votes | % | ±% | |
|---|---|---|---|---|---|
| Labour | Ann Clwyd | 26,254 | 69.1 | +0.2 | |
| Conservative | Andrew Smith | 4,890 | 12.9 | +0.7 | |
| Plaid Cymru | Clifford Benney | 4,186 | 11.0 | +4.3 | |
| Liberal Democrats | Marcello Verma | 2,667 | 7.0 | -5.2 | |
| Majority | 21,364 | 56.2 | −0.5 | ||
| Turnout | 37,997 | 76.5 | −0.2 | ||
| Registered electors | 49,695 | ||||
| Labour hold | Swing | −0.2 | |||
| Party | Candidate | Votes | % | ±% | |
|---|---|---|---|---|---|
| Labour | Ann Clwyd | 23,307 | 69.7 | +0.6 | |
| Plaid Cymru | Alun Davies | 3,552 | 10.6 | −0.4 | |
| Liberal Democrats | Huw Price | 3,459 | 10.3 | +3.3 | |
| Conservative | Andrew Smith | 2,260 | 6.8 | −6.1 | |
| Referendum | Gwyn John | 844 | 2.5 | N/A | |
| Majority | 19,755 | 59.1 | +2.9 | ||
| Turnout | 33,422 | 69.2 | -7.3 | ||
| Registered electors | 48,286 | ||||
| Labour hold | Swing | +0.5 | |||
Elections in the 2000s edit
| Party | Candidate | Votes | % | ±% | |
|---|---|---|---|---|---|
| Labour | Ann Clwyd | 17,685 | 65.6 | −4.1 | |
| Plaid Cymru | Steven J. Cornelius | 4,687 | 17.4 | +6.8 | |
| Liberal Democrats | Ian Parry | 2,541 | 9.4 | −0.9 | |
| Conservative | Julian Waters | 2,045 | 7.6 | +0.8 | |
| Majority | 12,998 | 48.2 | −10.9 | ||
| Turnout | 26,958 | 55.4 | −13.8 | ||
| Registered electors | 48,639 | ||||
| Labour hold | Swing | −5.4 | |||
| Party | Candidate | Votes | % | ±% | |
|---|---|---|---|---|---|
| Labour | Ann Clwyd | 17,074 | 64.1 | −1.5 | |
| Plaid Cymru | Geraint Benney | 3,815 | 14.3 | −3.1 | |
| Liberal Democrats | Margaret Phelps | 2,991 | 11.2 | +1.8 | |
| Conservative | Antonia Dunn | 2,062 | 7.7 | +0.1 | |
| UKIP | Sue Davies | 705 | 2.6 | N/A | |
| Majority | 13,259 | 49.8 | +1.6 | ||
| Turnout | 26,647 | 58.7 | +3.3 | ||
| Registered electors | 44,803 | ||||
| Labour hold | Swing | +0.8 | |||
Elections in the 2010s edit
| Party | Candidate | Votes | % | ±% | |
|---|---|---|---|---|---|
| Labour | Ann Clwyd | 15,681 | 52.5 | −10.5 | |
| Plaid Cymru | Dafydd Trystan Davies | 6,064 | 20.3 | +6.8 | |
| Liberal Democrats | Lee Thacker | 4,120 | 13.8 | +1.6 | |
| Conservative | Juliette Ash | 3,010 | 10.1 | +2.1 | |
| UKIP | Frank Hughes | 1,001 | 3.4 | +0.7 | |
| Majority | 9,617 | 32.2 | −17.6 | ||
| Turnout | 29,876 | 59.0 | −1.3 | ||
| Registered electors | 50,650 | ||||
| Labour hold | Swing | −8.6 | |||
| Party | Candidate | Votes | % | ±% | |
|---|---|---|---|---|---|
| Labour | Ann Clwyd | 14,532 | 47.7 | −4.8 | |
| Plaid Cymru | Cerith Griffiths | 5,126 | 16.8 | −3.5 | |
| UKIP | Rebecca Rees-Evans | 4,976 | 16.3 | +12.9 | |
| Conservative | Keith Dewhurst | 3,676 | 12.1 | +2.0 | |
| Liberal Democrats | Angharad Jones | 830 | 2.7 | −11.1 | |
| Green | John Matthews | 799 | 2.6 | N/A | |
| Socialist Labour | Chris Beggs | 533 | 1.7 | N/A | |
| Rejected ballots | 81 | ||||
| Majority | 9,406 | 30.9 | −1.3 | ||
| Turnout | 30,472 | 59.3 | +0.3 | ||
| Registered electors | 51,422 | ||||
| Labour hold | Swing | −0.6 | |||
Of the 81 rejected ballots:
- 59 were either unmarked or it was uncertain who the vote was for.[21]
- 22 voted for more than one candidate.[21]
| Party | Candidate | Votes | % | ±% | |
|---|---|---|---|---|---|
| Labour | Ann Clwyd | 19,404 | 61.0 | +13.3 | |
| Conservative | Keith Dewhurst | 6,166 | 19.4 | +7.3 | |
| Plaid Cymru | Liz Walters | 4,376 | 13.8 | −3.0 | |
| UKIP | Ian McLean | 1,271 | 4.0 | −12.3 | |
| Liberal Democrats | Nicola Knight | 585 | 1.8 | −0.9 | |
| Majority | 13,238 | 41.6 | +11.7 | ||
| Turnout | 31,802 | 62.0 | +2.7 | ||
| Registered electors | 51,334 | ||||
| Labour hold | Swing | +3.0 | |||
| Party | Candidate | Votes | % | ±% | |
|---|---|---|---|---|---|
| Labour | Beth Winter | 15,533 | 51.4 | −9.6 | |
| Conservative | Pauline Church | 6,711 | 22.2 | +2.8 | |
| Brexit Party | Rebecca Rees-Evans | 3,045 | 10.1 | N/A | |
| Plaid Cymru | Geraint Benney | 2,562 | 8.5 | −5.3 | |
| Cynon Valley | Andrew Chainey | 1,322 | 4.4 | N/A | |
| Liberal Democrats | Steve Bray | 949 | 3.1 | +1.3 | |
| SDP | Ian McLean | 114 | 0.4 | N/A | |
| Majority | 8,822 | 29.2 | −12.4 | ||
| Turnout | 30,236 | 59.1 | −2.9 | ||
| Registered electors | 51,134 | ||||
| Labour hold | Swing | -6.2 | |||
See also edit
Notes edit
- ^ A borough constituency (for the purposes of election expenses and type of returning officer)
- ^ As with all constituencies, the constituency elects one Member of Parliament (MP) by the first past the post system of election at least every five years.
References edit
- ^ "Beyond 20/20 WDS - Table view". 2011 Electorate Figures. StatsWales. 1 December 2010. Retrieved 13 March 2011.
- ^ "'Cynon Valley', June 1983 up to May 1997". ElectionWeb Project. Cognitive Computing Limited. Archived from the original on 11 March 2016. Retrieved 10 March 2016.
- ^ 2023 Review of Parliamentary Constituencies - The 2023 Review of Parliamentary Constituencies in Wales (PDF). Boundary Commission for Wales. 28 June 2023.
- ^ Leigh Rayment's Historical List of MPs – Constituencies beginning with "C" (part 6)
- ^ "Election Data 1983". Electoral Calculus. Archived from the original on 15 October 2011. Retrieved 18 October 2015.
- ^ Boothroyd, David. "Results of Byelections in the 1983-87 Parliament". United Kingdom Election Results. Archived from the original on 5 April 2018. Retrieved 19 September 2015.
- ^ "Election Data 1987". Electoral Calculus. Archived from the original on 15 October 2011. Retrieved 18 October 2015.
- ^ "Election Data 1992". Electoral Calculus. Archived from the original on 15 October 2011. Retrieved 18 October 2015.
- ^ "Politics Resources". Election 1992. Politics Resources. 9 April 1992. Archived from the original on 24 July 2011. Retrieved 6 December 2010.
- ^ "Election Data 1997". Electoral Calculus. Archived from the original on 15 October 2011. Retrieved 18 October 2015.
- ^ "Vote 2001". BBC News Vote 2001. British Broadcasting Corporation. Retrieved 11 April 2010.
- ^ "Election Data 2001". Electoral Calculus. Archived from the original on 15 October 2011. Retrieved 18 October 2015.
- ^ "BBC NEWS > Cynon Valley". Vote 2001. BBC News. 7 June 2001. Retrieved 10 March 2020.
- ^ "Election Data 2005". Electoral Calculus. Archived from the original on 15 October 2011. Retrieved 18 October 2015.
- ^ "Cynon Valley parliamentary constituency - Election 2005" – via www.bbc.co.uk.
- ^ "Election Data 2010". Electoral Calculus. Archived from the original on 26 July 2013. Retrieved 17 October 2015.
- ^ Cynon Valley BBC Election - Cynon Valley
- ^ "Election Data 2015". Electoral Calculus. Archived from the original on 17 October 2015. Retrieved 17 October 2015.
- ^ "MP wins fight to defend her seat". 13 December 2014 – via www.bbc.co.uk.
- ^ "Cynon Valley Parliamentary constituency". Election 2015 Results. BBC. Retrieved 1 March 2020.
- ^ a b c "Cynon Valley Results". UK Parliamentary Elections May 2015 results. Rhondda Cynon Taf Council. Retrieved 1 March 2020.
- ^ "Cynon Valley Parliamentary constituency". Election 2017 Results. BBC. Retrieved 10 March 2020.
- ^ "2017 Results". Rhondda Cynon Taf Council. Rhondda Cynon Taf Council. Retrieved 10 March 2020.
- ^ "Statements of Persons Nominated" (PDF). Rhondda Cynon Taf Council. Rhondda Cynon Taf Council. Retrieved 16 November 2019.
- ^ "Cynon Valley Parliamentary constituency". Election 2019 Results. BBC. Retrieved 10 March 2020.
- ^ "Results". Rhondda Cynon Taf Council. Rhondda Cynon Taf Council. Retrieved 10 March 2020.
Further reading edit
- Britain Votes/Europe Votes By-Election Supplement 1983-, compiled and edited by F.W.S. Craig (Parliamentary Research Services 1985)
External links edit
- Politics Resources (Election results from 1922 onwards)
- Electoral Calculus (Election results from 1955 onwards)
- 2017 Election House Of Commons Library 2017 Election report
- A Vision Of Britain Through Time (Constituency elector numbers)
51°39′25″N 3°27′40″W / 51.657°N 3.461°W